HAL Id: hal-02416674
https://hal.archives-ouvertes.fr/hal-02416674
Submitted on 10 Dec 2020HAL is a multi-disciplinary open access archive for the deposit and dissemination of sci-entific research documents, whether they are pub-lished or not. The documents may come from teaching and research institutions in France or abroad, or from public or private research centers.
L’archive ouverte pluridisciplinaire HAL, est destinée au dépôt et à la diffusion de documents scientifiques de niveau recherche, publiés ou non, émanant des établissements d’enseignement et de recherche français ou étrangers, des laboratoires publics ou privés.
Henry’s law constant measurements for phenol, o-, m-,
and p-cresol as a function of temperature
Valérie Feigenbrugel, Stéphane Le Calvé, Philippe Mirabel, Florent Louis
To cite this version:
Valérie Feigenbrugel, Stéphane Le Calvé, Philippe Mirabel, Florent Louis. Henry’s law constant measurements for phenol, o-, m-, and p-cresol as a function of temperature. Atmospheric Environment, Elsevier, 2004, 38 (33), pp.5577-5588. �10.1016/j.atmosenv.2004.06.025�. �hal-02416674�
Henry's Law Constant measurements for phenol, o-, m-, and p-cresol
as a function of temperature
Valérie Feigenbrugel, Stéphane Le Calvé*, Philippe Mirabel
Centre de Géochimie de la Surface, CNRS and Université Louis Pasteur, 1 rue Blessig, F-67084 Strasbourg Cedex, France
Florent Louis
Physico-Chimie des Processus de Combustion et de l’Atmosphère (PC2A),
UMR CNRS 8522, FR CNRS 2416, Bât. C11, Université des Sciences et Technologies de Lille, F-59655 Villeneuve d’Ascq Cedex, France
Abstract
In this work, a dynamic system based on the water/air equilibrium at the interface within the length of a microporous tube was used to experimentally determine the Henry’s Law Constants (HLC) of phenol and cresols. The measurements were conducted over the range 278-298 K in both deionized water and 35 g L-1°/°° solution of NaCl. At 293 K and in pure water, HLC were found to be equal to (in units of M atm-1): phenol, HLC = (1005 270); o-cresol, HLC = (690 95); m-o-cresol, HLC = (1324 172); p-o-cresol, HLC = (1742 ± 360). The obtained data were used to derive the following Arrhenius expressions: HLC = (4.1 ± 0.6) 10-9 exp((7684 ± 874)/T), HLC = (1.5 ± 0.1) 10-10 exp((8544 ± 512)/T), HLC = (5.5 ± 0.4) 10-11 exp((9028 ± 508)/T) and HLC = (3.3 ± 0.4) 10-11 exp((9258 ± 818)/T) for phenol, o-cresol, m-cresol and p-o-cresol, respectively. All of the values for HLC in 35 g L-1 salt solution were 10 to 30% lower than their respective values in deionised water, depending on the compound and the temperature.
These data were then used to estimate the fractions of phenol or of cresols in atmospheric aqueous phase. In order to evaluate the impact of a cloud on the atmospheric chemistry of phenol and cresols, we compare also their atmospheric lifetimes under clear sky (τgas), and
significantly lower than those in gas phase at a cumulus temperature of 283 K (in parentheses): phenol, 0.26 (0.45); o-cresol, 0.17 (0.24); m-cresol, 0.13 (0.22); p-cresol, 0.11 (0.23).
Keywords: Henry’s Law Constant, temperature, salinity, phenol, cresols.
* Corresponding author.
Introduction
Phenols constitute a class of organic substances of particular environmental interest. Due to their widespread discharge into the environment and their toxicity to many living organisms, phenol and its methyl derivates (cresols) are presently found on most priority lists of hazardous substances (Mackay, 1991). The major emission sources of phenol and cresol isomers into the troposphere are from automobile exhaust, wood burning and industrial sources. These compounds are released to the environment as fugitive emissions and effluents during coal tar and petroleum refining, metal refining and wood pulping as well as during manufacturing and use of many specialized chemicals (resins, disinfectants, insecticides, fungicides, etc.). Phenol and cresols can also be formed in the atmosphere by gas phase photo-oxidation of alkylbenzenes (Atkinson et al., 1989; Bjergbakke et al., 1996; Klotz et al., 1998; Smith et al., 1998; Berndt et al., 1999; Berndt and Böge, 2001; Volkammer et al., 2002).
Ambient levels of phenol and cresols have been measured in urban atmosphere (Leuenberger et al., 1985). Results of these studies revealed a mean concentration of 320, 71, and 130 ng m-3 respectively for phenol, o-cresol, and the sum of m-cresol and p-cresol. Emission data from road traffic indicated that phenol and cresols can reach up to 3% of the overall relative concentrations of the VOCs measured for different locations and engine types (Kurtenbach et al., 1999, 2000; Schmitz et al., 2000).
Phenol and cresol isomers are polar molecules. They have high solubilities in water and are expected to be efficiently scavenged from the gas phase by rain and fog. Values ranging between 0.2 and 9 µg L-1 were measured for phenol at different locations and the concentration of cresols in the rainwater was estimated to be in the range 0.38 – 2 µg L-1 (Kawamura and Kaplan, 1983; Leuenberger et al., 1985; Levsen et al., 1990; Richartz et al., 1990; Grosjean, 1991; Tremp et al., 1993; Allen and Allen, 1997; Lüttke and Levsen, 1997; Lüttke et al., 1997; Belloli et al., 1999; Lüttke et al., 1999; Morville et al., 2001). These concentration levels make them one of the most abundant organic compounds in rainwater.
An additional atmospheric sink for phenol and cresols is the removal by wet and dry depositions. Phenol, cresols and catechols (o-dihydroxybenzene) were the most common phenolic compounds identified in seawater sampled in coastal California with typical concentrations ranging from 2.5 to 370 ng L-1 (Boyd, 1994).Biodegradation will generally be
the dominant loss mechanism when cresols are released into water with half-lives of several days in estuarine waters. The half-lives are shorter in fresh water and longer in marine water.
An additional source of phenol and cresols in seawater is the produced water issued from the oil production. Methylphenols are an important group of organic contaminates in produced water with concentrations between 0.6 and 10 mg L-1 in the North Sea (Meier et al., 2003).
The partitioning of phenol and cresol isomers between the aqueous liquid phase and the air has to be investigated in order to shed some light in the understanding of the fate, the transport, and the removal of these pollutants in the troposphere. A key physical characteristic to describe the behaviour of a component in the environment (Rice et al., 1997) is given by the Henry’s law constant (HLC) that represents the partitioning between the gas and aqueous phases.
In order to use HLCs in environmental modeling, temperature and salinity effects have also to be investigated. Although several database of HLCs exist for organic compounds (Staudinger and Roberts, 1996; Sander, 1999), a detailed inspection of the literature showed a substantial variation in the previously quoted values for phenol and cresols : the data results may differ by as much as a factor of 3.
In this work, direct HLC determinations have been therefore performed with a dynamic equilibrium system, between 278 and 298 K. The effect on HLCs of a 35 g L-1°/°°°/°° solution of NaCl, used as a surrogate for an ocean seawater, was also studied over the same temperature range.
Experimental Section
Reagents
Aqueous solutions of phenol and cresols were made using Milli-Q Water (18 m cm). Pure phenol (GC grade, 99.5%), o-cresol (GC grade, 99.5%), m-cresol (GC grade, 98.0%), and p-cresol (GC grade, 98.0%) were obtained from Fluka Chemical Company and used without further purification. Sodium chloride ( 99.8%) was obtained from Riedel-de Haën Chemical Company. The aqueous concentrations used for the experiments were in the range 40-300 mg L-1 for phenol, 80-260 mg L-1 for o-cresol, 50-180 mg L-1 for m-cresol and 60-310 mg L-1 for p-cresol, given that their water solubilities at 298 K are 77500 mg L-1
(Frier, 1976), 25900, 22700, and 21520 mg L-1 respectively (Yalkowsky and Dannenfelser,
1992). To investigate the effects of salinity on HLCs, a water solution of NaCl (35 g L-1) was used.
Dynamic equilibrium system
The measurements of HLC were conducted using a dynamic equilibrium system shown in figure 1 and already used in previous work (Gautier et al., 2003; Katrib et al., 2003; Feigenbrugel et al., 2004).
Compressed air was passed through a microporous PTFE membrane tube (180 cm 0.8 cm i.d., Sumitomo Corporation) at a highly controlled flow rate (0.1 - 0.5 L min-1). The tube was immersed in about 0.6 L of the diluted aqueous solution containing the phenolic derivative. Phase equilibrium was achieved, for the dissolved compound, at the gas/water interface along the inner surface of the tube. The contact time between the two phases varied between 7 and 36 s depending on the flow rate. At the exit of the reactor, the gas phase which contains the studied compound at equilibrium concentration was then diluted using clean dry air (0.5 L min-1). The compound present in the gas phase was trapped using two cartridges connected in series and filled with a XAD-2 Amberlite resin (Supelco). Before use, this resin was purified by Soxhlet extraction with n-hexane/dichloromethane (50/50) for 24 hours and then dried at room temperature (Sanusi et al., 1997; Sauret et al., 2000).
After sampling, the compound was extracted three times by passing 20 mL, 10 mL and 10 mL of methanol through the cartridge. The mass of methanol which stayed in the cartridge was measured after each extraction in order to know the dead volume in the cartridge. The
experiments revealed that for o-cresol more than 99% of the compound was trapped in the first cartridge while for phenol, m-cresol and p-cresol the same percentage ranged respectively between 70 and 100 %, 85 and 100%, and 94 and 100%. 20 minutes to 3 hours were required to concentrate the phenol and cresols in the cartridges. Note that the mass of phenolic derivatives trapped in the cartridges was always negligible compared to their total mass in the aqueous solution so that their aqueous concentration were effectively constant during the course of the experiment.
Analysis
Phenol and cresols were analysed with a GC-MS (CGP 6890N / MSD 5973N, Agilent Technologies) equipped by a 5%- phenylmethylsiloxane capillary column (HP-5MS, 30 m 0.25 mm i.d. 2.5 µm film thickness). For this, 1µL of the solution obtained after extraction was injected in the splitless mode by an automatic sampler (7683, Agilent Technologies). Helium (UHP certified to > 99.9995% from Air Liquid) was used as carrier gas with a flow-rate of 1 mL min-1 and the injector temperature was set at 250°C. For all the solutions, the column temperature was kept at 60°C for 4 min, was then brought to 220°C at a rate of 20°C min-1, and was held at 220°C for 4 min.
In order to increase the sensitivity, phenol and cresols were analysed by applying single ion monitoring mode of the characteristic fragment ions at m/z 94, 107, and 108 amu. The gas-phase concentrations of the compounds were quantitatively determined from calibration curves made after each measurement. For this, known concentrations of the compounds were prepared in methanol and 1 µL of the obtained solution was then injected into the GC-MS in order to plot concentration curves versus GC-MS peak areas. The calibration curves were linear in the concentration range used in this study i.e. between 100-4000 µg L-1 for phenol, 200-2000 µg L-1 for o-cresol, 200-2000 µg L-1 for m-cresol and 160-3300 µg L-1 for p-cresol and the correlation coefficients were always greater than 0.99.
Results and discussion Effect of temperature
The Arrhenius plots of the Henry's Law Constants (in M atm-1) measured for the phenol and cresols in deionized water for a temperature range 278-298 K are presented in figure 2. The HLC values are also listed in tables 1 to 4 where the quoted uncertainties vary between 6 and 18 %. These values correspond to the sum of the uncertainties on the calibration curve
(ranging from 1 and 5 % for phenol and cresols), on the extraction process (determined to be of the order of 5 %), on the flow rates (less than 2.5 % in our conditions) and on the aqueous concentration of the phenol and cresols (less than 0.5 % for the phenol and cresols due to the relatively high aqueous concentrations in the experiments). Within these experimental errors, HLC values of the phenol and cresols are shown to be independent of their aqueous concentration over the ranges stated in the experimental section (see tables 1 to 4) and of the changes in air flow rate (0.1 – 0.5 L min-1) as shown in figure 3. This confirms that the equilibrium between solution and vapour is indeed achieved at the exit of reactor.
At 293 K, our recommended values of HLC calculated from the Arrhenius expression using a weighted analysis fit (see text below), are the following (in units of M atm-1): HLC = 1005 ± 270 (phenol); HLC = 690 ± 95 (o-cresol); HLC = 1324 ± 172 (m-cresol); HLC = 1742 ± 360 (p-cresol). The quoted errors correspond to 2 level and are determined from the standard deviations on both slope and intercept of Arrhenius expression. These data together with those reported in figure 2 show that the position of the methyl groups on the aromatic ring influences largely the HLC values of the cresols. For instance, the HLC of p-cresol is approximately 3 times higher than that obtained for o-cresol. Moreover, the temperature dependence are very similar for the four studied compounds meaning that their enthalpies of solvation are approximately the same. Based on these observations, it seems that the HLC values of other phenolic derivatives can be predicted at low temperature from a single determination at room temperature.
The following Arrhenius expressions can be derived from our data using a weighted analysis fit: HLC(phenol) = (4.1 ± 0.6) 10-9 exp((7684 ± 874)/T), HLC(o-cresol) = (1.5 ±
0.1) 10-10 exp((8544 ± 512)/T), HLC(m-cresol) = (5.5 ± 0.4) 10-11 exp((9028 ± 508)/T)
and HLC(p-cresol) = (3.3 ± 0.4) 10-11 exp((9258 ± 818)/T). The quoted errors are given at the 2 level from the least-squares analysis. These Arrhenius expressions permit to highlight the strong temperature dependence of HLC values for phenol and cresols. For instance, at 283 K, HLC values are between 2.5 and 3 times higher that those measured at 293 K. This is in quite good agreement with the commonly cited “rule of thumb” (Staudinger and Roberts, 2001) that doubles HLC values per 10°C decrease in temperature.
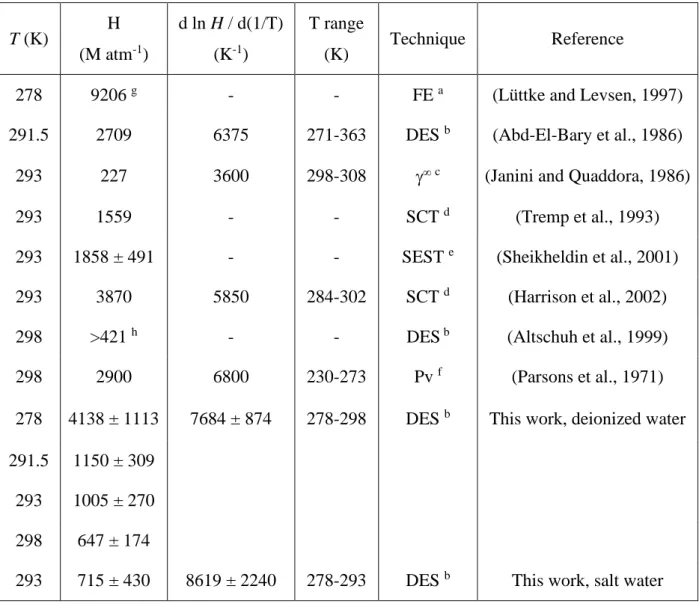
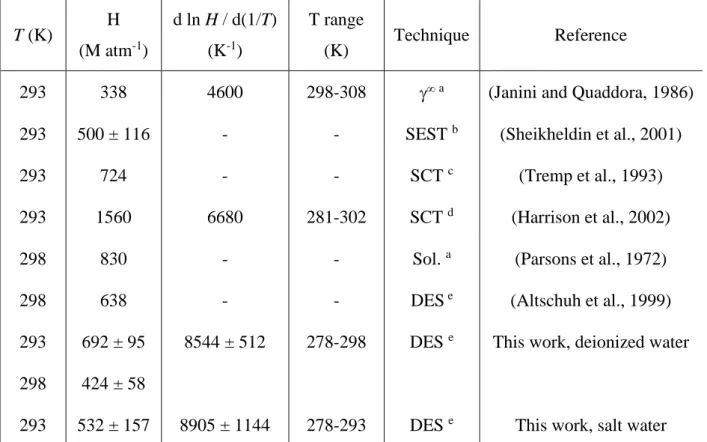
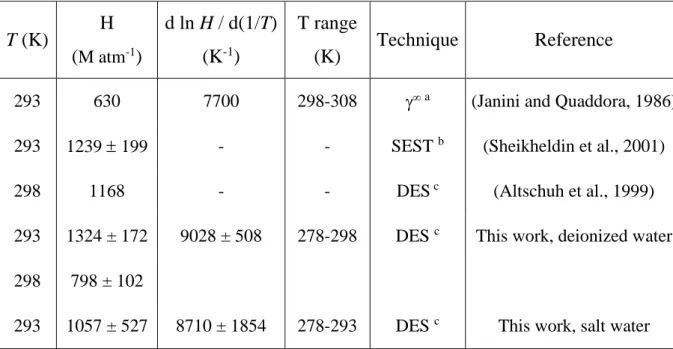
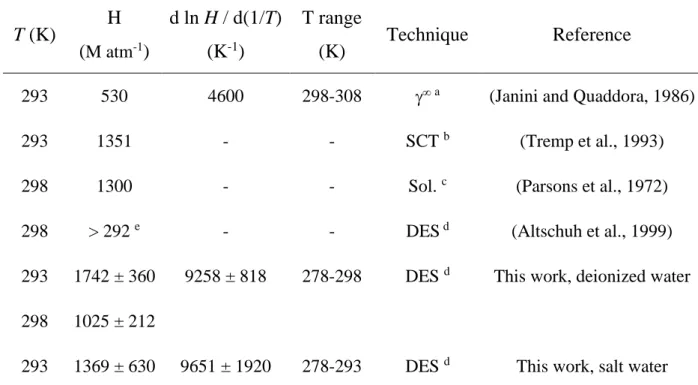
In Tables 5-8, our values of HLC are compared with those given in the literature. Tables 5-8 also provide previously reported temperature dependence of HLC whenever available.
One note that few measurements, as a function of temperature, are available for m- and p-cresols and therefore the comparison is rather limited in these cases.
Concerning phenol, our value at 293 K is in quite good agreement with that determined by Tremp et al. (Tremp et al., 1993) using a Stripping Column Technique (see table 5) and with that of Sheikheldin et al., 2001. Our experimental data are also quite consistent with the average value of 9206 M atm-1 derived at 278 K from simultaneous measurements of the phenol concentration in gas and aqueous phases (Lüttke and Levsen, 1997). However, our values are between 2 and 5 times lower than the previous ones (Parsons et al., 1971; Abd-El-Bary et al., 1986; Sheikheldin et al., 2001; Harrison et al., 2002) as shown in figure 4. On the contrary, the value reported by Janini and Quaddora (1986) at 296 K is approximately 4 times lower than our own determination.
For o-cresol, our experimental determination of HLC at 293 K agrees well, within experimental errors, with the values reported by Tremp et al. (1993) and Sheikheldin et al. (2001), who determined HLC by using a stripping column technique and a single equilibrium static technique, respectively (see table 6). The agreement is also reasonable between our measurement at 298 K and the values reported by Parsons et al. (1972) and Altschuh et al. (1999) while our determination is 2.5 times lower than that determined by Harrison et al. (2002) and 2 times higher than that reported by Janini and Quaddora (1986).
For m-cresol, our determination at 293 K is in very good agreement with the previous one reported recently by Sheikheldin et al. (2001) as shown in table 7. Our value at 298 K is also consistent with that determined by Altschuch et al. (1999). However, our value at 293 K is about 2 times higher than the previously reported data by Janini and Quaddora (Janini and Quaddora, 1986) who estimated HLC from experimentally determined activity coefficients and reported vapor pressure data.
For p-cresol, our experimental determination of HLC at 293 K in deionized water is consistent with the lower limit estimated by Altschuh et al. and the values obtained by Parsons et al. (1972) and by Tremp et al. (1993) even if these latter are about 30% lower (see table 8). Our value of HLC obtained at 293 K is about more than 3 times higher than the previous one reported by Janini and Quaddora (1986).
For phenol and o-cresol, we report respectively the fifth and the fourth temperature dependence of HLC. To our knowledge, we report the second measurement of HLC as a function of temperature for m- and p-cresol. The previous temperature dependence
recommended by Janini and Quaddora (1986) is probably suspicious because their determination at 293 K are much lower than all the other reported values for the four studied compounds. For phenol and o-cresol, our temperature dependence d(lnHLC)/d(1/T) agrees reasonably with the previous determinations (Parsons et al., 1971; Abd-El-Bary et al., 1986; Harrison et al., 2002).
Effect of salinity
The Arrhenius plots of the Henry's Law Constants, measured for the phenol and cresols in aqueous solutions of NaCl (35 g L-1) simulating seawater for a temperature range 278-298 K, are presented in the figures 4-7. The following Arrhenius expressions can be derived from our data using a weighted analysis fit: HLCS = (1.2 ± 0.4) 10-10 exp((8619 ± 2240)/T),
HLCS = (3.4 ± 0.6) 10-11 exp((8905 ± 1144)/T), HLCS = (1.3 ± 0.4) 10-10 exp((8710 ±
1854)/T) and HLCS = (6.8 ± 1.8) 10-12 exp((9651 ± 1920)/T) for phenol, o-cresol, m-cresol
and p-cresol, respectively. All of the HLC values for the salt solution were 10 to 30 % lower than their respective values in deionized water (Tables 1-4), depending on the compound and the temperature. For instance, the determined HLC values at 293 K in salt solution obtained from Arrhenius expression given above, can be compared with those measured in pure water (in parentheses): phenol, HLC = 715 ± 430 (1005 ± 270); o-cresol, HLC = 532 ± 157 (692 ± 95); m-cresol, HLC = 1057 ± 527 (1324 ± 172); p-cresol, HLC = 1369 ± 630 (1742 ± 360) (units of M atm-1). This phenomenon is related to the salting-out effect which impacts on the water solubility (reduction in solubility by a factor of 1.25 to 1.40 for the studied compounds). The effect of salt on the solubility of gases in seawater has been studied theoretically for a variety of small gas molecules (Danckwerts, 1970). The presence of a salt in an aqueous solution changes the water structure in the vicinity of the solute. An empirical relation for the effect of ionic strength on a compound’s HLC in an aqueous solution was given by (Setschenow, 1889):
log (HLC / HLCS) = h (NaCl) (1)
where HLC and HLCS are the Henry’s law coefficient of the compound in pure water and in
the salt solution, respectively, (NaCl) is the molarity of the NaCl solution and h is the Setschenow salting-out coefficient (L mol-1).
Our results of HLC and HLCS at 293 K (see tables 5-8) were used to estimate the
following Setschenow coefficients: phenol, 0.25; o-cresol, 0.19; m-cresol, 0.16; p-cresol, 0.18. Values of the salting-out coefficients are similar to those of other phenolic derivatives (Xie et al., 1997). Our determinations are also close to those obtained from experiments for phenol by (Morrison, 1944) (0.22 for (NaCl) = 1 M at 298 K) and m-cresol by (Carter and Hardy, 1928) (0.17 for (NaCl) = 0.5 M at 298 K).
These data on salting-out are valuable for assessing the solubility of organic substances in seawater from corresponding data for freshwater. The magnitude of the salting-out effect is large enough to have a significant influence on mass transfer rate of phenolic compounds in natural processes. For example, at 293 K and for an ionic strength of 0.6 M, which is representative of seawater, the rate of absorption of the gases into the ocean from the troposphere would be slower than in freshwater of the same temperature.
Atmospheric implications
Once released in the atmosphere, Volatile Organic Compounds (VOCs) can react in the gas phase or can be taken up by water droplets where they can also be oxidized. For most of them, OH radical is the most efficient oxidizing species in both the gas phase (Atkinson, 2000) and the aqueous phase (Ervens et al., 2003). To evaluate the impact of a cloud on the atmospheric chemistry of phenol and cresols, we compare in this section their atmospheric lifetimes under clear sky (τgas), and cloudy conditions (τmultiphase).
The lifetime of A in the gas phase (τA,gas) taking only into account the reaction of A with
OH radicals, is defined as follow:
g g OH, g g gas A, ] [OH k 1 /dt d[A] [A]
τ
= − = (3)where kOH,g is the rate constant of the gas phase reaction of OH radicals with A, [OH]g is the
mean concentration of OH radicals and [A]g is the concentration of A in the troposphere.
If we consider now the cloudy atmosphere as a multiphase reactor where both the gas and aqueous phases coexist, then the multiphase lifetime of A can be defined as (Monod et al., 2003):
/dt d[A] -/dt d[A] [A] [A] aq g aq g multiphase A,
τ
= − + (4)where [A]aq is the concentrations of A in the aqueous phase. At equilibrium, the fractions of A
in the gas (fA,g) and aqueous phases (fA,aq) are the following:
T L R HLC 1 T L R HLC [A] [A] [A] wc wc aq g aq , + = + = aq A f (5) T L R HLC 1 1 [A] [A] [A] wc aq g g , + = + = g A f (6)
where R the ideal gas constant (in L atm mol-1 K-1), L
wc the dimensionless liquid water
content of the cloud (typically 4.210-7).
Mass accommodation can limit the rate of gas uptake. The accommodation time-scale accom can be estimated from the mass accommodation coefficient as:
α A c 4 1 1 τ c accom = (7)
where <c> is the mean molecular velocity of the trace gas.
The mass accommodation coefficients have been measured for the cresol isomers by Louis and coworkers (Leyssens et al., 2004) and their values at 293K are respectively equal to 6.6 10-4 for o-cresol, 1.1 10-3 for m-cresol, and 2.9 10-3 for p-cresol. In addition, a value of 8.3 10-3 for phenol at 293 K has already been reported by Müller and Heal (Müller and
Heal, 2002). From the values of the calculated accommodation time scale varies between 0.6 and 8.4 min. In regard to the tropospheric lifetimes of phenol or cresols in the gas phase (see table 9), mass accommodation is indeed a fast process. Therefore, the uptake of these compounds by atmospheric droplets will not be limited by mass transport.
Assuming that equilibrium is effectively rapidly reached, eq. (3) can be written as follows: ) ] [OH (k T L R HLC ) ] [OH (k T L R HLC 1 τ aq wc g wc multiphase A, + + = (8)
where kOH,aq is the rate constant of OH reaction with A in aqueous phase, [OH]aq is the mean
concentration of OH radicals in the tropospheric aqueous phase.
The rate constants of OH reaction with phenol or cresols in both aqueous and gas phases have already been reported (Savel'eva et al., 1972; Feitelson and Hayon, 1973; Field et al., 1982; Semadeni et al., 1995), and are shown in table 9 together with the Henry's law constants determined in this work. By analogy with other cresols, the rate coefficient of OH reaction with m-cresol was estimated to 1.21010 M-1 s-1. These data have then been used to estimate the atmospheric lifetimes of these organic compounds under clear sky (τgas), and cloudy
conditions (τmultiphase), by using typical concentrations of OH radicals in the gas and in
aqueous phases: [OH]g=1106 cm-3 and [OH]aq=110-13 M (Monod et al., 2003). We assume
here that the OH concentration in the gas phase is the same under clear sky and cloudy conditions although it is reduced as soon as clouds are formed, and the magnitude of the decrease strongly depends on the pH value of the droplet (Monod and Carlier, 1999).
At 298 K, the calculated aqueous fraction are the following: phenol, 6.710-3; o-cresol, 4.310-3; m-cresol, 8.110-3; p-cresol, 10.610-3. At 298 K which is the temperature where most of experimental rate constants were measured, the atmospheric lifetimes of phenol and cresols are slightly reduced in the cloud as shown in table 9. However, the average temperature of tropospheric clouds is 283 K and therefore, the calculated aqueous fraction of phenol rises from 6.710-3 to 2.810-2 when the temperature decreases from 298 K to 283 K,
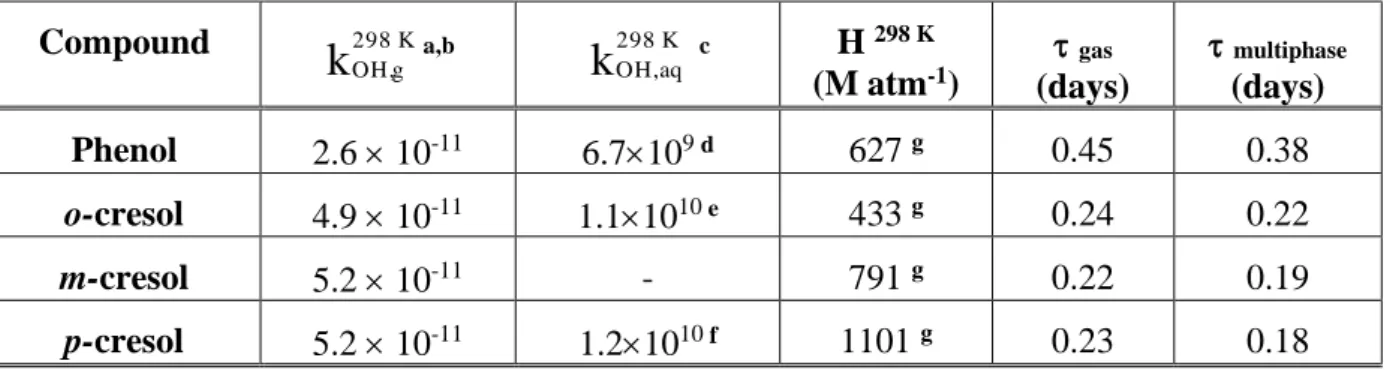
temperature range where the HLC value of phenol increases from 658 to 2815 M atm-1. Assuming that the rate constants of OH reactions with phenol or cresols in the gas and aqueous phases do not vary a lot between 283 and 298 K as it was already observed for many oxygenated VOCs, we can then estimate the multiphase lifetimes of these compounds at 283 K. These calculated lifetimes at 283 K (in units of days) are significantly lower than those at 298 K (in parentheses): phenol, 0.26 (0.38); o-cresol, 0.17 (0.22); m-cresol, 0.13 (0.19); p-cresol, 0.11 (0.18). Considering all the uncertainties associated with the above calculations, one can conclude that the oxidations of phenol and cresols in the gas and aqueous phases are of the same order of magnitude and can really compete. Mechanisms of OH-oxidation in aqueous phase are therefore needed to identify the products that can be deposited to ground by wet deposition and consequently to better estimate the environmental impact of phenol and cresols.
Acknowledgment
Financial support for this work has been provided by the CNRS through the "Programme National de Chimie Atmosphérique (PNCA)". This work was also sponsored in part by the French Agency for Environment and Energy Management (ADEME) and the region of Alsace. This is the EOST contribution n° 2003.101-UMR7517.
References
Abd-El-Bary, M.F., Hamoda, M.F., Tanisho, S. and Wakao, N., 1986. Henry's constants for phenol over its diluted aqueous solution. J. Chem. Eng. Data 31, 229-230.
Allen, S.K. and Allen, C.W., 1997. Phenol concentrations in air and rain water samples collected near a wood preserving facility. Bulletin of Environmental Contamination and Toxicology 59, 702-707.
Altschuh, J., Brüggemann, R., Santl, H., Eichinger, G. and Piringer, O.G., 1999. Henry's law constants for a diverse set of organic chemicals: Experimental determination and comparison of estimation methods. Chemosphere 39(11), 1871-1887.
Atkinson, R., 2000. Atmospheric chemistry of VOCs and NOx. Atmos. Envir. 34, 2063-2101. Atkinson, R., Aschmann, S.M., Arey, J. and Carter, W.P.L., 1989. Formation of ring-retaining
products from the OH radical-initiated reactions of benzene and toluene. Int. J. Chem. Kinet. 21, 801-827.
Belloli, R., Barletta, B., Bolzacchini, E., Meinardi, S., Orlandi, M. and Rindone, B., 1999. Determination of toxic nitrophenols in the atmosphere by high-performance liquid chromatography. J. Chromatography A 846, 277-281.
Berndt, T. and Böge, O., 2001. Gas-phase reaction of OH radicals with benzene: products and mechanism. Phys. Chem. Chem. Phys. 3, 4946-4959.
Berndt, T., Böge, O. and Herrmann, H., 1999. On the formation of benzene oxide/oxepin in the gas-phase reaction of OH radicals with benzene. Chem. Phys. Lett. 314, 435-442. Bjergbakke, E., Sillesen, A. and Pagsberg, P., 1996. UV spectrum and kinetics of
hydroxycyclohexadienyl radicals. J. Phys. Chem. 100, 5729-5736.
Boyd, T.J., 1994. Identification and quantification of mono-, di- and trihydroxybenzenes (phenols) at trace concentrations in seawater by aqueous acetylation and gas chromatographic-mass spectrometric analysis. J. Chromatography A 662, 281-292. Carter, J.S. and Hardy, R.K., 1928. The salting-out effect: Influence of electrolytes on the
solubility of m-cresol in water. J. Chem. Society-Faraday Transactions 131, 127-29. Danckwerts, P.V., 1970. Gas-liquid reactions. McGraw-Hill Book Co., New York,, xiii, 276
pp.
Ervens, B., Gligorovski, S. and Herrmann, H., 2003. Phys. Chem. Chem. Phys. 5, 1811-1824. Feigenbrugel, V., Le Calvé, S. and Mirabel, P., 2004. Henry's law constants measurements of
metolachlor and diazinon between 283 and 298 K. Chemosphere submitted. Feitelson, J. and Hayon, E., 1973. J. Phys. Chem. 73, 10-15.
Field, R.J., Raghavan, N.V. and Brummer, J.G., 1982. A Pulse Radiolysis Investigation of the Reactions of BrO,. with Fe(CN),4-, Mn( I I ), Phenoxide Ion, and Phenol. J. Phys. Chem. 86, 2443-2449.
Frier, R.K., 1976. Aqueous solutions:Data for Inorganic and Organic Compounds, Vol. 1. Walter de Gruyter, Berlin, 440 p. pp.
Gautier, C., Le Calvé, S. and Mirabel, P., 2003. Henry's law constants measurements of alachlor and dichlorvos between 283 and 298 K. Atmos Env 37, 2347-2353.
Grosjean, D., 1991. Atmospheric fate of toxic aromatic compounds. Sci. Total Environ. 100, 367-414.
Harrison, M.A.J., Cape, J.N. and Heal, M.R., 2002. Experimentally determined Henry's Law coefficients of phenol, 2-methylphenol and 2-nitrophenol in the temperature range 281–302 K. Atmos. Envir. 36(11), 1843-1851.
Janini, G.M. and Quaddora, L.A., 1986. Determination of activity coefficients of oxygenated hydrocarbons by liquid-liquid chromatography. J. Liq. chromatography 9, 39-53. Katrib, Y., Le Calvé, S. and Mirabel, P., 2003. Uptake measurements of dibasic esters by
water droplets and determination of their Henry's law constants. J. Phys. Chem. A to be published.
Kawamura, K. and Kaplan, I.R., 1983. Organic compounds in the rain water of Los Angeles. Environ Sci. Technol. 17, 497-501.
Klotz, B., Sörensen, S., Barnes, I., Becker, K.H., Etzkorn, T., Volkammer, R., Platt, U., Wirtz, K. and Martin-Reviejo, M., 1998. Atmospheric oxidation of toluene in a large-volume outdoor photoreactor: In situ Determination of ring-retaining products yields. J. Phys. Chem. A 102, 10289-10299.
Kurtenbach, R., Ackermann, R., Brockmann, K.J., Geyer, A., Gomes, J.A.G., Lörzer, J.C., Niedojadlo, A., Platt, U. and Becker, K.H., 1999, VOC-Measurements in a road traffic tunnel and in urban air of the city of Wuppertal, in TFS-LT3 Annual Report 1998 (German), edited by K.H. Becker, University of Wuppertal, Germany,
Kurtenbach, R., Ackermann, R., Brockmann, K.J., Geyer, A., Gomes, J.A.G., Lörzer, J.C., Niedojadlo, A., Platt, U. and Becker, K.H., 2000, VOC-Measurements in a road traffic tunnel and in urban air of the city of Wuppertal, in TFS-LT3 Annual Report 1999 (German), edited by K.H. Becker, University of Wuppertal, Germany,
Leuenberger, C., Ligocki, M.P. and Pankow, J.F., 1985. Trace organic compounds in rain: 4. Identities, concentrations, scavenging mechanisms for phenols in urban air and rain. Environ Sci. Technol. 19, 1053-1058.
Levsen, K., Behnert, S., Priess, B., Svoboda, M., Winkeler, H.D. and Zietlow, J., 1990. Organic compounds in precipitation. Chemosphere 21, 1037-1061.
Leyssens, G., Louis, F. and Sawerysyn, J.P., 2004. Temperature Dependence of the Mass Accommodation Coefficients of 2-Nitrophenol, 2-Methylphenol, 3-Methylphenol, and 4-Methylphenol on Aqueous Surfaces. private communication.
Lüttke, J. and Levsen, K., 1997. Phase partitioning of phenol and nitrophenols in clouds. Atmos. Envir. 31, 2649-2655.
Lüttke, J., Levsen, K., Acker, K., Wieprecht, W. and Möller, D., 1999. Phenols and nitrated phenols in clouds at Mount Brocken. Int. J. Environ. Anal. Chem. 74, 69-89.
Lüttke, J., Scheer, V., Levsen, K., Wünsch, G., Cape, J.N., Hargreaves, K.J., Storenton-West, R.L., Acker, K., Wieprecht, W. and Jones, B., 1997. Occurrence and formation of nitrated phenols in and out of clouds. Atmos. Envir. 31, 2637-2648.
Mackay, D., 1991. Multimedia Environmental Models. The Fugacity Approach. Lewis Publishers, Chelsea, MI.
(negative-ion chemical ionization), Norwegian Society for Mass Spectrometry, Lillehammer, Norway.
Monod, A. and Carlier, P., 1999. Impact of clouds on the tropospheric ozone budget: Direct effect of multiphase photochemistry of soluble organic compounds. Atmos. Envir. 33, 4431-4446.
Monod, A., Poulain, L., Grubert, S., Voisin, D. and Wortham, H., 2003. Kinetics of OH-initiated oxidation of some oxygenated organic compounds in the aqueous phase under tropospheric conditions – 1 – New results. Atmos. Envir. submitted.
Morrison, T.J., 1944. The salting-out effect. Transactions of the Faraday Society 40, 43-48. Morville, S., Scheyer, A., Mirabel, P. and Millet, M., 2001. Analysis of phenols and
nitrophenols in rain and fog collected in an urban area (Strasbourg, France), A Changing Atmosphere. 8th European Symposium on the Physico-Chemical Behavior of Atmospheric Pollutants, Torino, Italy.
Müller, B. and Heal, M.R., 2002. Mass Accommodation Coefficients of Phenol, 2-Nitrophenol, and 3-Methylphenol over the Temperature Range 278-298 K. J. Phys. Chem. A, 106,5120-5127.
Parsons, G.H., Rochester, C.H., Rostron, A. and Sykes, P.C., 1972. The thermodynamics of hydration of phenols. J. Chem. Soc. Perkin Trans. 2 2, 136-138.
Parsons, G.H., Rochester, C.H. and Wood, C.E.C., 1971. Effect of 4-substitution on the thermodynamics of hydration of phenol and the phenoxide anion. J. Chem. Soc. B, 533-536.
Rice, C.P., Chernyak, S.M. and Mc Connell, L.L., 1997. Henry's Law Constants for pesticides measured as a function of temperature and salinity. J. Agric. Food Chemistry 45, 2291-2298.
Richartz, H., Reischl, A., Trautner, F. and Hutzinger, O., 1990. Nitrated phenols in fog. Atmos. Envir. 24, 3067-3071.
Sander, R., 1999. Compilation of Henry's law constants for inorganic and organic species of potential importance in environmental chemistry. Version 3, http:/www.mpch-mainz.mpg.de/~sander/res/henry.html.
Sanusi, A., Millet, M., Wortham, H. and Mirabel, P., 1997. A Multiresidue Method for Determination of Trace Levels of Pesticides in Atmosphere. Analusis 25, 302-307. Sauret, N., Millet, M., Herckes, P., Mirabel, P. and Wortham, H., 2000. Analytical method
using gas chromatography and ion trap tandem mass spectrometry for the determination of S-triazines and their metabolites in the atmosphere. Envir. Poll. 110, 243-252.
Savel'eva, O.S., Shevchuk, L.G. and Vysotskaya, N.A., 1972. Reactions of substituted phenols with hydroxyl radicals and their dissociated form O-. J. Org. Chem. USSR 8, 283-286.
Schmitz, T., Hassel, D. and Weber, F.J., 2000. Determination of VOC-components in the exhaust of gasoline and diesel passenger cars. Atmos Envir. 34, 4639-4647.
Semadeni, M., Stocker, D.W. and Kerr, J.A., 1995. The Temperature Dependence of OH Radical Reactions with Aromatic Compounds under Simulated Tropospheric Conditions. Int. J. Chem. Kinet. 27, 287-304.
Setschenow, S., 1889. Über die Konstitution der Salzlösungen auf Grund ihres Verhaltens zu Kohlensäure. Zerichte für Physikalische Chemie 4, 117-125.
Sheikheldin, S.Y., Cardwell, T.J., Cattrall, R.W., De Castro, M.D.L. and Kolev, S.D., 2001. Determination of Henry’s law constants of phenols by pervaporation-.ow injection analysis. Environ Sci. Technol. 35, 178-181.
Smith, D.F., Melver, C.D. and Kleindienst, T.E., 1998. Primary product distribution from the reaction of hydroxyl radicals with toluene at ppb NOx mixing ratios. J. atmos. Chem. 30, 209-228.
Staudinger, J. and Roberts, P.J., 1996. A critical review of Henry's law constants for environmental applications. Crit. Rev. Environ. Sci. Technol. 26, 205-297.
Staudinger, J. and Roberts, P.V., 2001. A critical compilation of Henry's law constant temperature dependence relations for organic compounds in dilute aqueous solutions. Chemosphere 44, 561-576.
Tremp, J., Mattrel, P., Fingler, S. and Giger, W., 1993. Phenols and nitrophenols as tropospheric pollutants - emissions from automobile exhausts and phase-transfert in the atmosphere. Water Air Soil Poll. 68, 113-123.
Volkammer, R., Klotz, B., Barnes, I., Imamura, T., Wirtz, K., Washida, N., Becker, K.H. and Platt, U., 2002. OH-initiated oxidation of benzene: I. Phenol formation under atmospheric conditions. Phys. Chem. Chem. Phys. 4, 1598-1610.
Xie, W.-H., Shiu, W.-Y. and Mackay, D., 1997. A Review of the Effects of Salts on the Solubility of Organic Compounds in Seawater. Marine Environmental Research 44, 429-444.
Yalkowsky, S.H. and Dannenfelser, R.M., 1992. The AQUASOL DATABASE of Aqueous Solubility. Tucson AZ, Univ. Arizona, College of Pharmacy.
Figure Captions
Figure 1 : Scheme of the dynamic equilibrium system used to determine Henry's law constants as a function of the temperature.
Figure 2 : Plot of ln HLC versus 1000/T in deionized water for the four compounds studied: phenol, o-cresol, m-cresol, p-cresol, in the temperature range of 278-298 K. Our errors on HLC varied typically between 6 and 18 % and are determined as mentioned in the text.
Figure 3 : Plot of HLC versus the flow rate ranging between 0.1 and 0.5 L min-1 for phenol, o-cresol, m-cresol, p-cresol at 293 K. Our errors on HLC varied typically between 6 and 11 % and are determined as mentioned in the text.
Figure 4 : Plot of ln HLC versus 1000/T for phenol in the temperature range of 278-298 K in deionized and salt water. Our determinations are compared to the experimental data of the literature. Our errors on HLC varied typically between 7 and 9 % and are determined as mentioned in the text. Straigth lines represent Arrhenius plots derived by Harrison et al. (long dash line), by Abd-El-Bary et al. (short dash line), or in this work for deionized water (solid line) and a 35 g L-1°/°° solution of NaCl (dash-dot line).
Figure 5 : Plot of ln HLC versus 1000/T for o-cresol in the temperature range of 278-298 K in deionized and salt water. Our determinations are compared to the experimental data of the literature. Our errors on HLC varied typically between 6 and 12 % and are determined as mentioned in the text. Straigth lines represent Arrhenius plots derived by Harrison et al. (long dash line), or in this work for deionized water (solid line) and a 35 g L-1°/°° solution of NaCl (dash-dot line).
Figure 6 : Plot of ln HLC versus 1000/T for m-cresol in the temperature range of 278-298 K in deionized and salt water. Our determinations are compared to the experimental data of the literature. Our errors on HLC varied typically between 8 and 11 % and are determined as mentioned in the text. Solid and dash-dot lines represent Arrhenius plots derived in this work for deionized water and a 35 g L-1°/°° solution of NaCl, respectively.
Figure 7 : Plot of ln HLC versus 1000/T for p-cresol in the temperature range of 278-298 K in deionized and salt water. Our determinations are compared to the experimental data of the
literature. Our errors on HLC varied typically between 7 and 18 % and are determined as mentioned in the text. Solid and dash-dot lines represent Arrhenius plots derived in this work for deionized water and a 35 g L-1°/°°°/°°solution of NaCl, respectively.
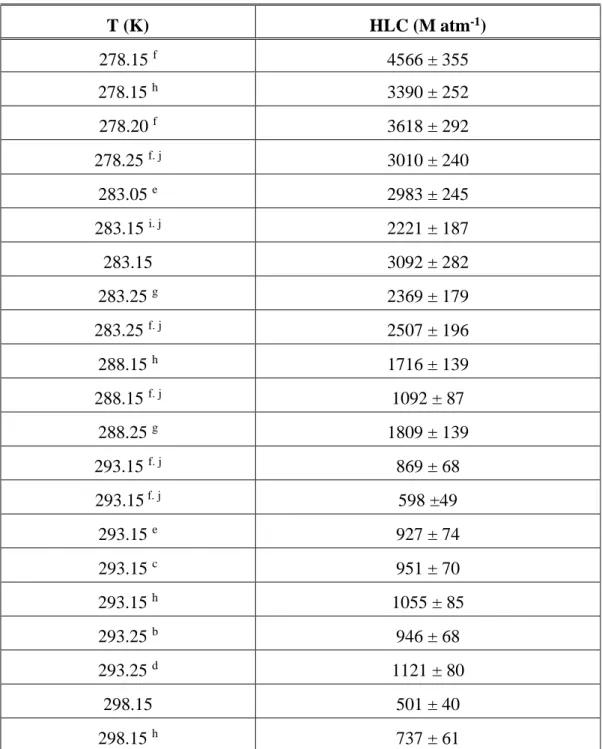
Table 1: Henry’s Law Constants of phenol as a function of the temperature determined by using the dynamic equilibrium system.
T (K) HLC (M atm-1) 278.15 f 4566 ± 355 278.15 h 3390 ± 252 278.20 f 3618 ± 292 278.25 f. j 3010 ± 240 283.05 e 2983 ± 245 283.15 i. j 2221 ± 187 283.15 3092 ± 282 283.25 g 2369 ± 179 283.25 f. j 2507 ± 196 288.15 h 1716 ± 139 288.15 f. j 1092 ± 87 288.25 g 1809 ± 139 293.15 f. j 869 ± 68 293.15 f. j 598 ±49 293.15 e 927 ± 74 293.15 c 951 ± 70 293.15 h 1055 ± 85 293.25 b 946 ± 68 293.25 d 1121 ± 80 298.15 501 ± 40 298.15 h 737 ± 61
By default, the experiments were carried out in deionized water with a flow rate of 0.2 L min-1
and with an aqueous concentration of phenol of 100 mg L-1 ( 1.110-3 M). Experiments carried out with an air flow rate of: a 0.1 L min-1; b 0.3 L min-1; c 0.4 L min-1; d 0.5 L min-1.
Experiments performed with an aqueous phenol concentration of: e 50 mg L-1 ( 5.310-4 M); f 150 mg L-1 ( 1.610-3 M); g 200 mg L-1 ( 2.110-3 M). ); h 250 mg L-1 ( 2.710-3 M). i 300 mg L-1 ( 3.210-3 M) j Salt water experiments (35 g L-1°/°°).
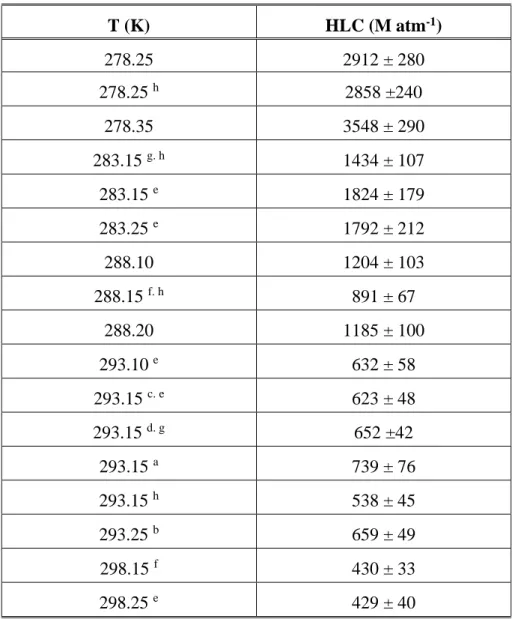
Table 2: Henry’s Law Constants of o-cresol as a function of the temperature determined by using the dynamic equilibrium system.
T (K) HLC (M atm-1) 278.25 2912 ± 280 278.25 h 2858 ±240 278.35 3548 ± 290 283.15 g. h 1434 ± 107 283.15 e 1824 ± 179 283.25 e 1792 ± 212 288.10 1204 ± 103 288.15 f. h 891 ± 67 288.20 1185 ± 100 293.10 e 632 ± 58 293.15 c. e 623 ± 48 293.15 d. g 652 ±42 293.15 a 739 ± 76 293.15 h 538 ± 45 293.25 b 659 ± 49 298.15 f 430 ± 33 298.25 e 429 ± 40
By default, the experiments were carried out in deionized water with a flow rate of 0.2 L min-1 and with an aqueous concentration of o-cresol of 150 mg L-1 ( 1.410-3 M). Experiments carried out with an air flow rate of: a 0.1 L min-1; b 0.3 L min-1; c 0.4 L min-1; d 0.5 L min-1.
Experiments performed with an aqueous o-cresol concentration of: e 100 mg L-1 ( 9.310-4 M); f 200 mg L-1 ( 1.910-3 M). ); g 250 mg L-1 ( 2.310-3 M). h Salt water experiments (35 g L-1°/°°).
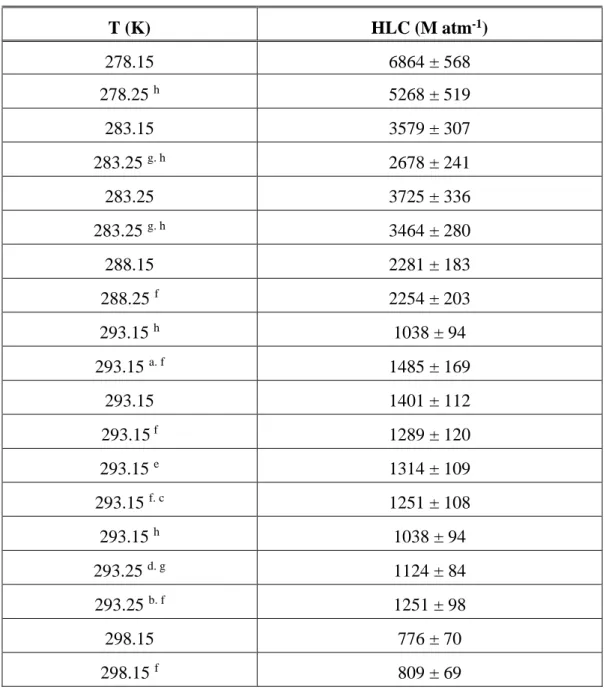
Table 3: Henry’s Law Constants of m-cresol as a function of the temperature determined by using the dynamic equilibrium system.
T (K) HLC (M atm-1) 278.15 6864 ± 568 278.25 h 5268 ± 519 283.15 3579 ± 307 283.25 g. h 2678 ± 241 283.25 3725 ± 336 283.25 g. h 3464 ± 280 288.15 2281 ± 183 288.25 f 2254 ± 203 293.15 h 1038 ± 94 293.15 a. f 1485 ± 169 293.15 1401 ± 112 293.15 f 1289 ± 120 293.15 e 1314 ± 109 293.15 f. c 1251 ± 108 293.15 h 1038 ± 94 293.25 d. g 1124 ± 84 293.25 b. f 1251 ± 98 298.15 776 ± 70 298.15 f 809 ± 69
By default, the experiments were carried out in deionized water with a flow rate of 0.2 L min-1 and with an aqueous concentration of m-cresol of 150 mg L-1 ( 1.610-3 M). Experiments carried out with an air flow rate of: a 0.125 L min-1; b 0.3 L min-1; c 0.4 L min-1 , d 0.5 L min-1. Experiments performed with an aqueous m-cresol concentration of: e 50 mg L-1 ( 5.310-4
M); f 100 mg L-1 ( 1.110-3 M); g 200 mg L-1 ( 2.110-3 M). h Salt water experiments (35 g L-1°/°°).
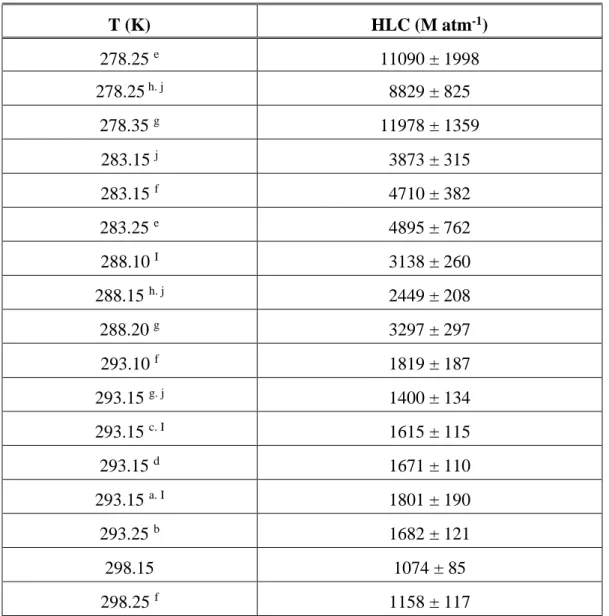
Table 4: Henry’s Law Constants of p-cresol as a function of the temperature determined by using the dynamic equilibrium system.
T (K) HLC (M atm-1) 278.25 e 11090 ± 1998 278.25 h. j 8829 ± 825 278.35 g 11978 ± 1359 283.15 j 3873 ± 315 283.15 f 4710 ± 382 283.25 e 4895 ± 762 288.10 I 3138 ± 260 288.15 h. j 2449 ± 208 288.20 g 3297 ± 297 293.10 f 1819 ± 187 293.15 g. j 1400 ± 134 293.15 c. I 1615 ± 115 293.15 d 1671 ± 110 293.15 a. I 1801 ± 190 293.25 b 1682 ± 121 298.15 1074 ± 85 298.25 f 1158 ± 117
By default, the experiments were carried out in deionized water with a flow rate of 0.2 L min-1 and with an aqueous concentration of p-cresol of 300 mg L-1 ( 2.810-3 M). Experiments carried out with an air flow rate of: a 0.1 L min-1; b 0.3 L min-1; c 0.4 L min-1; d 0.5 L min-1.
Experiments performed with an aqueous p-cresol concentration of: e 50 mg L-1 ( 4.610-4 M);f 100 mg L-1 ( 9.310-4 M); g 150 mg L-1 ( 1.410-3 M); h 200 mg L-1 ( 1.910-3 M). ); i 250 mg L-1 ( 2.310-3 M). j Salt water experiments (35 g L-1°/°°).
Table 5: Comparison of experimental Henry’s law constants for phenol with previous work. T (K) H (M atm-1) d ln H / d(1/T) (K-1) T range (K) Technique Reference
278 9206 g - - FE a (Lüttke and Levsen, 1997)
291.5 2709 6375 271-363 DES b (Abd-El-Bary et al., 1986)
293 227 3600 298-308 c (Janini and Quaddora, 1986)
293 1559 - - SCT d (Tremp et al., 1993)
293 1858 ± 491 - - SEST e (Sheikheldin et al., 2001)
293 3870 5850 284-302 SCT d (Harrison et al., 2002)
298 >421 h - - DES b (Altschuh et al., 1999)
298 2900 6800 230-273 Pv f (Parsons et al., 1971)
278 4138 ± 1113 7684 ± 874 278-298 DES b This work, deionized water 291.5 1150 ± 309
293 1005 ± 270 298 647 ± 174
293 715 ± 430 8619 ± 2240 278-293 DES b This work, salt water
a HLC derived from field experiments; b DES: Dynamic Equilibrium System; c : Infinite
dilution activity in water; d SCT: Stripping Column Technique; e SEST: Single Equilibrium Static Technique; f Pv: Calculated value from the ratio between the vapour pressure, experimentaly measured and the solubility; g average value; h Not used in validation analysis by the author.
Table 6: Comparison of experimental Henry’s law constants for o-cresol with previous work. T (K) H (M atm-1) d ln H / d(1/T) (K-1) T range (K) Technique Reference
293 338 4600 298-308 a (Janini and Quaddora, 1986)
293 500 ± 116 - - SEST b (Sheikheldin et al., 2001)
293 724 - - SCT c (Tremp et al., 1993)
293 1560 6680 281-302 SCT d (Harrison et al., 2002)
298 830 - - Sol. a (Parsons et al., 1972)
298 638 - - DES e (Altschuh et al., 1999)
293 692 ± 95 8544 ± 512 278-298 DES e This work, deionized water 298 424 ± 58
293 532 ± 157 8905 ± 1144 278-293 DES e This work, salt water
a : Infinite dilution activity in water; b SEST: Single Equilibrium Static Technique; c SCT:
Stripping Column Technique; d Sol.: Calculated value from the ratio between the vapour
Table 7: Comparison of experimental Henry’s law constants for m-cresol with previous work. T (K) H (M atm-1) d ln H / d(1/T) (K-1) T range (K) Technique Reference
293 630 7700 298-308 a (Janini and Quaddora, 1986) 293 1239 199 - - SEST b (Sheikheldin et al., 2001)
298 1168 - - DES c (Altschuh et al., 1999)
293 1324 ± 172 9028 ± 508 278-298 DES c This work, deionized water 298 798 ± 102
293 1057 ± 527 8710 ± 1854 278-293 DES c This work, salt water
a : Infinite dilution activity in water; b SEST: Single Equilibrium Static Technique; c DES:
Table 8: Comparison of experimental Henry’s law constants for p-cresol with previous work. T (K) H (M atm-1) d ln H / d(1/T) (K-1) T range (K) Technique Reference
293 530 4600 298-308 a (Janini and Quaddora, 1986)
293 1351 - - SCT b (Tremp et al., 1993)
298 1300 - - Sol. c (Parsons et al., 1972)
298 > 292 e - - DES d (Altschuh et al., 1999)
293 1742 ± 360 9258 ± 818 278-298 DES d This work, deionized water 298 1025 ± 212
293 1369 ± 630 9651 ± 1920 278-293 DES d This work, salt water
a : Infinite dilution activity in water; b SCT: Stripping Column Technique; c Sol.: Calculated
value from the ratio between the vapour pressure and the solubility, experimentaly measured;
Table 9: Rate constants of OH reaction with phenol and cresols in gas and aqueous phases and the corresponding Henry's law constants. The atmospheric lifetimes were calculated
Compound
k
298OH, gK a,bk
298OH, aqK c H 298 K (M atm-1) gas (days) multiphase (days) Phenol 2.6 10-11 6.7109 d 627 g 0.45 0.38 o-cresol 4.9 10-11 1.11010 e 433 g 0.24 0.22 m-cresol 5.2 10-11 - 791 g 0.22 0.19 p-cresol 5.2 10-11 1.21010 f 1101 g 0.23 0.18a in cm3 molecule-1 s-1; b values reported by Semadeni et al. (1995); c in M-1 s-1; d Field et al.
A
I
R
Microporous tube (160 cm) Aqueous solution of the compound (0.6 L) Dilution air (Q2 = 0.5 L min-1)Front cartridge Flow controller Flow controller water T1 T2 Back cartridge Q1 = 0.1 - 0.5 L min-1 GC-MS analysis Figure 1 1000/T (K-1) 3.3 3.4 3.5 3.6 ln HLC ( M a tm -1 ) 6 7 8 9 10 Phenol o-cresol m-cresol p-cresol Figure 2
Flow (L.min-1)
0.0 0.1 0.2 0.3 0.4 0.5 0.6HLC (M
atm
-1
)
100 1000 10000 Phenol o-cresol m-cresol p-cresol Figure 31000/T (K-1) 3.2 3.3 3.4 3.5 3.6 3.7 3.8 ln HLC (M a tm -1 ) 4 6 8 10 Tremp et al. 1993 Abd-El-Bary et al. 1986 This work, deionized water This work, salt water Harrison et al. 2002
Lüttke and Levsen 1997 Janini and Quaddora 1986 Sheikheldin et al. 2001 Altschuh et al. 1999 Parsons et al. 1971 Figure 4 3.3 3.4 3.5 3.6 ln HLC (M a tm -1 ) 6 7 8 9
This work, deionized water This work, salt water
Janini et al. 1986 Sheikheldin et al. 2001 Harrison et al. 2002
Parsons et al. 1972 Tremp et al. 1993
Figure 5 1000/T (K-1) 3.3 3.4 3.5 3.6 ln HLC (M a tm -1 ) 6.0 6.5 7.0 7.5 8.0 8.5 9.0 9.5
This work, deionized water This work, salt water Janini et al. 1986
1000/T (K-1) 3.3 3.4 3.5 3.6 ln HLC (M a tm -1 ) 6 7 8 9 10
This work, deionized water This work, salt water
Janini et al. 1986 Parsons et al. 1972 Tremp et al. 1993