HAL Id: ird-00579088
https://hal.ird.fr/ird-00579088
Submitted on 23 Mar 2011
HAL is a multi-disciplinary open access archive for the deposit and dissemination of sci-entific research documents, whether they are pub-lished or not. The documents may come from teaching and research institutions in France or
L’archive ouverte pluridisciplinaire HAL, est destinée au dépôt et à la diffusion de documents scientifiques de niveau recherche, publiés ou non, émanant des établissements d’enseignement et de recherche français ou étrangers, des laboratoires
Statistics of the French purse seine fleet targeting
tropical tunas in the Indian Ocean (1991-2009)
Emmanuel Chassot, Laurent Floch, Patrice Dewals, Viveca Fonteneau,
Renaud Pianet
To cite this version:
Emmanuel Chassot, Laurent Floch, Patrice Dewals, Viveca Fonteneau, Renaud Pianet. Statistics of the French purse seine fleet targeting tropical tunas in the Indian Ocean (1991-2009). IOTC Proceedings, 2010, IOTC-2010-WPTT-12, 31 p. �ird-00579088�
Statistics of the French purse seine fleet targeting tropical tunas in
the Indian Ocean (1991-2009)
Chassot E.a, L. Flocha,1, P. Dewalsb, V. Fonteneauc, R. Pianeta
a
Institut de Recherche pour le D´eveloppement, CRH, Avenue Jean Monnet, BP 171, 34 203 S`ete Cedex,
FRANCE
b
Institut de Recherche pour le D´eveloppement, Seychelles Fishing Authority, BP 570, Victoria,
SEYCHELLES
c
FIESTA, 9 Boulevard Por´ee, 35 400 Saint Malo, FRANCE
Abstract
The document describes the fishing activities of the French purse seiners targeting tropical tunas, i.e. Thunnus albacares, Katsuwonus pelamis, and Thunnus obesus in the Indian Ocean during 1991-2009. The catch time series of the fleet over the period 2001-2009 has been updated following a change in the spatial stratification used in the multispecies sampling and a few modifications in data processing. Information is provided on fishing effort (fishing days, searching days, and fishing sets), catch, catch rates, and mean weights for the major tropical tuna species. Two major fishing modes are considered for the fishery: log-associated and free swimming schools,
Keywords: purse seine fishing, Thunnus albacares, Katsuwonus pelamis, Thunnus obesus,
fishing aggregating device
1. Introduction
The French purse seine fishing fleet has been monitored by the Institut de Recherche pour le D´eveloppement (IRD) in collaboration with the Seychelles Fishing Authority (SFA) since the beginning of the fishery in the early 1980s (Pianet 1999). Since 2002, statistical data from the European fleet (i.e., France and Spain) have been collected within the framework of the EU “Data Collection Regulation” (DCR, Reg. 1543/2000 and 1639/2001), followed in 2008 by the “Community framework for the collection, management and use of data in the fisheries sector and support for scientific advice regarding the Common Fisheries Policy” (DCF, Reg 199/2008 and 665/2008). The document describes the activities of the French purse seine fleet during 1991-2009 that is a time period fully consistent in terms of multispecies sampling scheme and data processing used to correct for the species composition of the catch. Statistical data over the period 1981-1990 can be found in Pianet
∗Corresponding author
Email address: Laurent.Floch@ird.fr(L. Floch)
et al. (2006). The French fleet includes the vessels flying French flags as well as the vessels from the French overseas collectivity of Mayotte. The document provides a new time series of catch data by species since some changes have recently been made in the data processing, particularly through the addition of a spatial stratum so as to take into account the spatial gradients in tuna species composition observed in the Somali area in the 2000s.
2. Changes in data processing
The catch time series of the French purse seine fishing fleet in the Indian Ocean during 2001-2008 has been modified compared to the data available in Pianet et al. (2009). In particular, the progressive expansion of the purse seiners north of the Somali area in the 2000s has revealed significant differences in the species composition of tunas caught in the ET area ’East Somali’ (2201) (Pallar´es and Hallier 1997), i.e. a strong decrease in bigeye tuna proportion north of 8◦N. Accordingly, a change in the spatial strata used to estimate the species composition of tunas based on multispecies sampling has been done through the splitting of the North Somali area stratum into two areas, a ’South Somali’ (2201) area comprised between 0 and 8◦N and a ’North Somali’ area (2211) between 8◦ and 15◦N. The ’Arabian Sea’ area (2207) has then been reduced by moving up its southern limit to 15◦N. This change did not affect the total catch declarations but only slightly modified the species composition of the catch in the somali area during 2001-2009.
In addition, a few changes have been made over time in the data processing used to correct the species composition of the catch through port sampling (Pallar´es and Hallier 1997, Pianet et al. 2000). In particular, a change has been done in March 2002 in the key used to convert dorsal length into fork length data for yellowfin tuna. In November 2003, the substitution scheme of the data processing has been modified. From this period, multi-species port samples from the first 3 substitution levels have been subsequently cumulated to increase sample size, i.e. if the addition of the samples from the first substitution level to the samples from the stratum of interest was not sufficient to reach a target number (e.g. 25 samples), samples from the second substitution level would then be added up to the samples from the first substitution level. Samples from the third substitution level would then be used if necessary. Such modifications have been included to account for progressive improvements in ancillary information provided to the data processing (e.g. morphometric relationships) or in situations of very poor sampling and had only little impact on the time series of catch and effort annually provided to the IOTC.
3. Fishing capacity
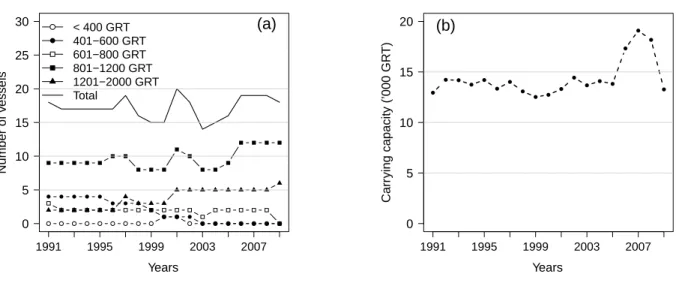
The number of fishing vessels of the French purse seine fishing fleet has varied around 16.6 (SD ± 1.3) over the period 1991-2009, with a minimum of 14 and a maximum of 19 in 2003 and 1997, respectively (Fig. 1 and Table 1). The total carrying capacity expressed in
gross tonnage (GRT) has increased through time from about 14,000 t in the early 1980s to more than 16,000 t in the late 2000s (Fig. 1). In summer 2009, 5 vessels left the Indian Ocean toward the Atlantic Ocean, decreasing the total carrying capacity to about 11,000 t. This departure was mainly related to low catch rates compared to the Atlantic ocean and the increasing expansion of Somali piracy attacks that induced a strong reduction of the fishing grounds, particularly in the vicinity of the somali area during the FAD-fishing season (June-October). In September 2009, a new purse seiner, the Franche Terre, entered the fishery. In November 2009, the Torre Giulia which was formerly flying the Italian flag joined the French purse seine fleet.
0 5 10 15 20 25 30 Years Number of v essels 1991 1995 1999 2003 2007 < 400 GRT 401−600 GRT 601−800 GRT 801−1200 GRT 1201−2000 GRT Total (a) 0 5 10 15 20 Years Carr ying capacity (’000 GR T) 1991 1995 1999 2003 2007 (b)
Figure 1: (a) Number of fishing vessels by GRT category operating in the Indian Ocean (b) Changes in total carrying capacity (CC) of the French fishing fleet during 1991-2009. Annual values of CC were weighted by the relative proportion of year (in months) spent in the Indian Ocean. The vessel GRT category was
computed as 0.7 times the capacity expressed in m3
4. Fishing effort
4.1. Fishing and searching days
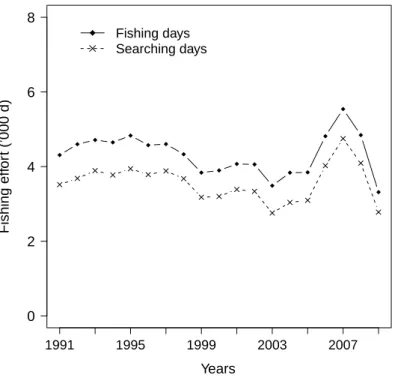
The fishing effort expressed in fishing and searching days showed similar patterns over 1991-2009 with a decrease from 1993 to 2003 followed by a large increase during 2006-2008 (Fig. 2). Fishing effort strongly decreased in 2009 and reached the lowest values of the time period with 3,315 and 2,779 fishing and searching days, respectively. This pattern was consistent with the changes of the carrying capacity observed over the time period (Fig. 1b) due to the departure of some vessels to the Atlantic ocean (see above).
0 2 4 6 8 Years Fishing eff or t (’000 d) 1991 1995 1999 2003 2007 Fishing days Searching days
Figure 2: Annual total number of fishing and searching days for the French purse seine fleet in the Indian Ocean during 1991-2009
2009
30°E 40°E 50°E 60°E 70°E 80°E 90°E 100°E 40°S 30°S 20°S 10°S 0 10°N 20°N 200 d
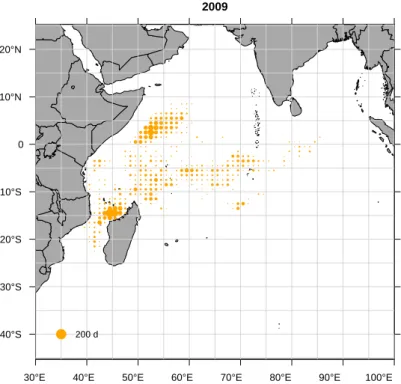
Figure 3: Spatial distribution of fishing effort (in searching days) of the French purse seine fishing fleet in 2009
The fishing effort of the French purse seine fishing fleet is mainly distributed in the western Indian Ocean, south of 10°N and north of 20°S (Fig. 3).
4.2. Fishing activities
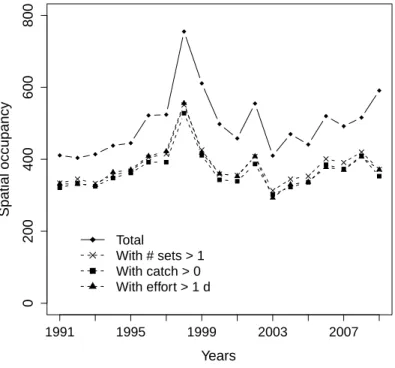
Whatever the selection criterium applied, the number of 1-degree squares by latitude and longitude where the French purse seiners occurred showed similar patterns over the period 1991-2009, except for the final year (Fig. 4 and Table 3). The purse seine fishing grounds increased from 1991 to 1998 and then decreased to reach in the early 2000s similar levels as observed in the early 1990s. The high values of spatial occupancy in 1998 corresponded to one of the strongest warm events observed in the Indian Ocean (Murtuggude et al. 1999, Murtugudde et al. 2000) that led purse seiners fishing in the eastern zone (M´enard et al. 2007). The fishing grounds area has steadily increased since 2003 but showed a decrease in 2009 probably in relation with the influence of Somali piracy and the decrease in the number of vessels occurring in the Indian Ocean.
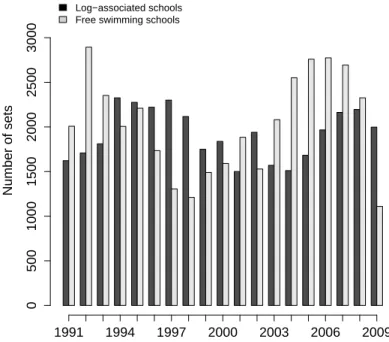
The total annual number of fishing sets made by the French purse seine fleet has varied around 4,000 during 1991-2009, showing a general pattern consistent with the annual variations in carrying capacity and in fishing effort (expressed in fishing or searching days) of the fleet (Table 4). The fleet showed a strong decrease in the number of sets from more than 4,500 in the late 2000s to about 3,100 in 2009. The total number of sets showed a
0 200 400 600 800 Years Spatial occupancy 1991 1995 1999 2003 2007 Total With # sets > 1 With catch > 0 With effort > 1 d
Number of sets 0 500 1000 1500 2000 2500 3000 1991 1994 1997 2000 2003 2006 2009 Log−associated schools
Free swimming schools
Figure 5: Annual number of fishing sets in the French purse seine fishery on log-associated and free swimming schools during 1991-2009
pattern very similar to the annual changes in the number of sets made on free swimming schools (Fig. 5). The number of sets made on log associated schools was more stable through time and in an opposite phase than sets made on free swimming schools. The percentage of log-associated over free swimming schools varied around a mean of 50% (± SD = 10%) with log-associated fishing predominating from the mid-1990s to the early 2000s while sets made on free swimming schools were more frequent during 2003-2008. In 2009, the number of sets on free swimming schools substantially decreased from more than 2,300 to 1,110 while sets made on log-associated schools remained close to 2,000. This major decrease is related to the necessity of French purse seiners to operate in pairs for security reasons, favouring fishing on log-associated over free swimming schools. Tables 5-7 give the detail of the total number of fishing sets by set size and fishing mode.
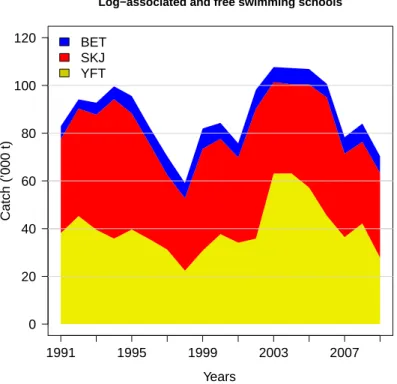
5. Fisheries production 5.1. Catch levels
The French purse seine fishery showed strong interannual variations in the catch over 1991-2009 with a minimum of 60,000 t in 1998 and a maximum of 108,000 t during 2003-2004 (Fig. 6). Catches on log-associated schools represented about 60% of the total catch, increasing from 60% in the early 1990s to about 70% in the late 1990s, and then
0 20 40 60 80 100 120
Log−associated and free swimming schools
Years Catch (’000 t) 1991 1995 1999 2003 2007 BET SKJ YFT
Figure 6: Catch by species of the French purse seine fishing fleet during 1991-2009
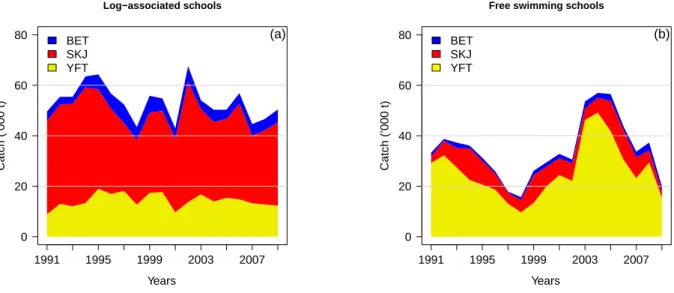
decreasing to less than 50% during 2003-2005. The percentage has increased since then to reach about 70% in 2009. Catches on log-associated schools appeared more stable than catches on free swimming schools during 1991-2009 (Fig. 7). They were largely dominated by skipjack that represented about 64% (SD ± 6.2%) of all species caught, varying from 50% to about 75% over the period (Fig. 7a). Catches of bigeye estimated through multispecies sampling varied between 5% and 14% of the total of catch on log-associated schools during 1991-2009. Catches of yellowfin on log-associated schools were stable over the period representing 27% of the catch and an annual average of about 14,000 t (SD ± 2,800 t). Catches made on free swimming schools showed strong internannual variations in the last two decades from less than 20,000 t in the late 1990s to more than 50,000 t during 2003-2005 (Fig. 7b). The changes over time in free swimming schools catches drove the trends in the total catches of the fishery. The catches were largely dominated by yellowfin that represented more than 70% (SD ± 9%) of the catch during 1991-2009. Catches of yellowfin strongly decreased from 42,000 t in 2008 to less than 30,000 t in 2009, mainly due to the departure of 5 vessels to the Atlantic Ocean and the associated decrease in fishing sets on free swimming schools, i.e. from more than 2,300 in 2008 to about 1,100 in 2009 (Table 4).
0 20 40 60 80 Log−associated schools Years Catch (’000 t) 1991 1995 1999 2003 2007 (a) BET SKJ YFT 0 20 40 60 80
Free swimming schools
Years Catch (’000 t) 1991 1995 1999 2003 2007 (b) BET SKJ YFT
Figure 7: Catch by species of the French purse seine fishing fleet on (a) log-associated and (b) free swimming schools during 1991-2009
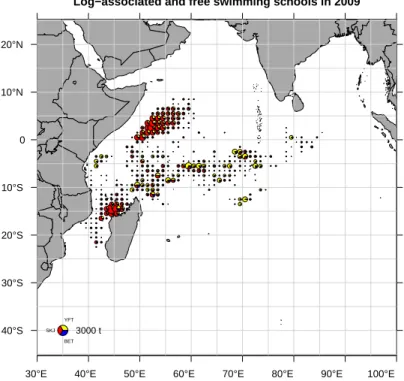
5.2. Spatial distribution of the catch
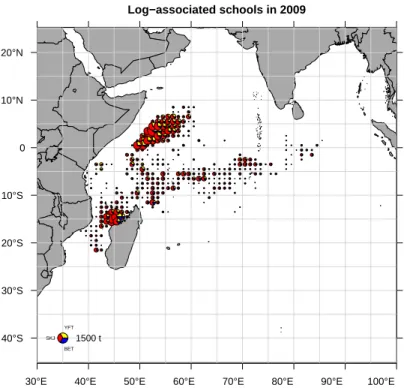
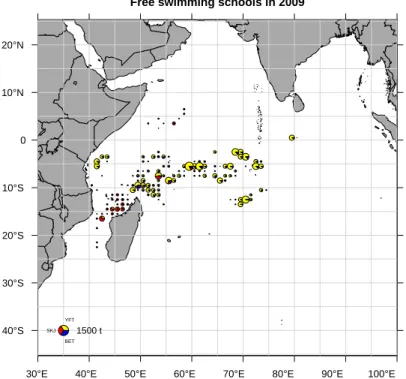
The spatial distribution of the catch in 2009 is highly patchy with two major fishing grounds dominated by skipjack located along the Somali coast and in the north of the Mozambique Channel; the catches dominated by yellowfin tuna being more spread along the 5◦S latitude around and east of the Seychelles (Fig. 8). In 2009, few catches have been made in the areas off the coasts of Tanzania, Kenya, and the south of Somali compared to the precedent years (Fig. 9). Thanks to the boarding of military personnel aboard purse seiners to ensure their security, the fishing activities in the Somali area were made in 2009 closer to the coast than in 2008. Some catches were made in 2009 east of Maldives, south of Sri Lanka which could be linked to some environmental effects.
Log−associated and free swimming schools in 2009
30°E 40°E 50°E 60°E 70°E 80°E 90°E 100°E 40°S 30°S 20°S 10°S 0 10°N 20°N YFT SKJ BET 3000 t
Figure 8: Spatial distribution of tuna catches of the French purse seine fishing fleet in 2009
Log−associated and free swimming schools in 2004−2008
30°E 40°E 50°E 60°E 70°E 80°E 90°E 100°E 40°S 30°S 20°S 10°S 0 10°N 20°N YFT SKJ BET 3000 t
Log−associated schools in 2009
30°E 40°E 50°E 60°E 70°E 80°E 90°E 100°E 40°S 30°S 20°S 10°S 0 10°N 20°N YFT SKJ BET 1500 t
Figure 10: Spatial distribution of tuna catches of the French purse seine fishing fleet made on log-associated schools in 2009
5.3. Catch rates
The catch rates (expressed in t per fishing day) for the 3 species during 1991-2009 did not exhibit clear patterns but showed a strong interannual variability very similar to the time series of catch (Figs. 6-14). The time series of catch rates computed from data collected on log-associated school fishing for the 3 species did no show any trend over time and were characterized by high interannual variability (Fig. 15a). Catch rates were around 9.8 (CV > 20%), 4.1 (CV = 25%), and 1.4 (CV > 25%) t d−1 for skipjack, yellowfin, and bigeye, respectively. Catch rates of yellowfin caught on free swimming schools showed a decrease from more than 8 t d−1 in 1991 to less than 3 t d−1 in 1998. Catch rates then increased to reach levels higher than 15 t d−1 during 2003-2004 (Fig. 15b). Since then, catch rates have decreased to lower than average levels around 5.9 t d−1 in the recent years. Catch rates of skipjack on free swimming schools showed strong interannual variability around a mean value of 2 t d−1 and without any trend. Similarly, catch rates of bigeye did not show any clear trend over 1991-2009 and were characterized by a small mean value of 0.5 t d−1 (SD ± 0.24).
5.4. Size structure of the catch
The total number of fishes caught in 2009 (∼ 550,000) was lower than during the period 2004-2008 (∼ 740,000) while the size structure of the catch was similar for the 3 tuna species (Fig. 16). The sizes of yellowfin caught on log-associated schools showed a major
Log−associated schools in 2004−2008
30°E 40°E 50°E 60°E 70°E 80°E 90°E 100°E 40°S 30°S 20°S 10°S 0 10°N 20°N YFT SKJ BET 1500 t
Figure 11: Spatial distribution of tuna catches of the French purse seine fishing fleet made on log-associated schools in 2004-2008
Free swimming schools in 2009
30°E 40°E 50°E 60°E 70°E 80°E 90°E 100°E 40°S 30°S 20°S 10°S 0 10°N 20°N YFT SKJ BET 1500 t
Figure 12: Spatial distribution of tuna catches of the French purse seine fishing fleet made on free swimming schools in 2009
Free swimming schools in 2004−2008
30°E 40°E 50°E 60°E 70°E 80°E 90°E 100°E 40°S 30°S 20°S 10°S 0 10°N 20°N YFT SKJ BET 1500 t
Figure 13: Spatial distribution of tuna catches of the French purse seine fishing fleet made on free swimming schools in 2004-2008
mode between 40 and 70 cm and a smaller mode around 110-120 cm. Bigeye caught on log associated schools were only juveniles fishes of median size 52 cm and the distribution was skewed to the right with a few individuals (< 4%) larger than 80 cm. Skipjack showed one unique mode with sizes described by a median of 47 cm (min = 30 cm and max = 70 cm). Skipjack caught on log-associated and free swimming schools in 2009 were smaller (median sizes of 47 and 48 cm, respectively) than during the 2004-2008 period (median sizes of 48 and 52 cm, respectively).
The biomass of fish caught by size class showed very similar patterns in 2009 as observed during 2004-2008 (Fig. 17). The biomass of large yellowfin (> 100 cm) caught on log-associated and free swimming schools was lower in 2009 than for the average year 2004-2008 while it was rather similar for bigeye. The biomass of skipjack 44-50 cm long caught on log-associated schools, which represent the bulk of skipjack catch, was higher in 2009 than during 2004-2008 while there was a strong decrease in skipjack catch on free swimming schools (Table 8-10). Overall, the total catch of skipjack in 2009 was very close to the catch during 2004-2008 (∼ 35,000 t) despite the strong decrease in fishing effort and was characterized by smaller individuals.
1995 2000 2005 0 10 20 30 40 50 Years
Catch per unit eff
or t (t d − 1 ) Total Skipjack Yellowfin Bigeye
Figure 14: Annual catch rates (in t per searching day) of the French purse seine fleet in the Indian Ocean during 1991-2009 0 5 10 15 20 25 Years
Catch per unit eff
or t (t d − 1 ) 1991 1995 1999 2003 2007 Total Skipjack Yellowfin Bigeye (a) 0 5 10 15 20 25 Years
Catch per unit eff
or t (t d − 1 ) 1991 1995 1999 2003 2007 Total Skipjack Yellowfin Bigeye (b)
Figure 15: Annual catch rates (in t per searching day) of the French purse seine fleet on (a) log-associated and (b) free swimming schools in the Indian Ocean during 1991-2009
0 50 100 150 0 100 300 Size class (cm) 2009 2004−2008
LOG
YFT
0 50 100 150 0 10 30 50 Size class (cm) 2009 2004−2008FREE
0 50 100 150 0 100 300 Size class (cm) 2009 2004−2008ALL
0 50 100 150 0 50 150 Size class (cm) 2009 2004−2008BET
0 50 100 150 0 2 4 6 8 10 Size class (cm) 2009 2004−2008 0 50 100 150 0 50 150 Size class (cm) 2009 2004−2008 0 20 60 100 0 500 1000 1500 Size class (cm) 2009 2004−2008SKJ
0 20 60 100 0 50 100 200 Size class (cm) 2009 2004−2008 0 20 60 100 0 500 1000 Size class (cm) 2009 2004−2008Figure 16: Total numbers of fish (in thousands of individuals) caught by size class after extrapolation of the French purse seine fleet in 2009 and for an average year representing the period 2004-2008
0 50 100 150 0 200 600 Size class (cm) 2009 2004−2008
LOG
YFT
0 50 100 150 0 1000 2000 Size class (cm) 2009 2004−2008FREE
0 50 100 150 0 1000 2000 Size class (cm) 2009 2004−2008ALL
0 50 100 150 0 200 400 600 Size class (cm) 2009 2004−2008BET
0 50 100 150 0 40 80 120 Size class (cm) 2009 2004−2008 0 50 100 150 0 200 600 Size class (cm) 2009 2004−2008 0 20 60 100 0 1000 2500 Size class (cm) 2009 2004−2008SKJ
0 20 60 100 0 200 400 600 Size class (cm) 2009 2004−2008 0 20 60 100 0 1000 3000 Size class (cm) 2009 2004−2008Figure 17: Total biomass (t) of fish caught by size class after extrapolation of the French purse seine fleet in 2009 and for an average year representing the period 2004-2008
5.5. Mean weight in the catch
The mean weight of the major tropical tunas in the catch highly differed between fishing modes and showed strong interannual variations during 1991-2009 (Fig. 18). The mean weight of yellowfin caught decreased from more than 37 kg in 1991 to about 15 kg in 1998-1999, before progressively increasing thereafter to reach about 40 kg in 2007-2008. The mean weight of yellowfin strongly decreased in 2009 to about 28 kg (Fig. 18a). After an initial decrease from about 10 kg in the early 1990s, the mean weight of yellowfin in the catch made on log-associated schools was stabilised from the mid-1990s to the late 2000s at around 5.8 kg (SD = ± 1.2 kg). Similarly to free swimming schools, the mean weight decreased in 2009 to reach a small value of 4.2 kg per individual caught. The time series pattern of the mean weight of yellowin for the whole fishery was mainly driven by the interannual changes in mean weight for individuals caught in free swimming schools.
The mean weight of skipjack was more stable than yellowfin during 1991-2009 and varied between a minimum of 2.3 kg in 2002 and a maximum of 3.1 in 2006 for fishes caught on log-associated schools Fig. 18b). In the recent years, the mean weight of skipjack strongly decreased from more than 3 kg in 2005-2006 to less than 2.4 kg in 2009. The mean weight of bigeye has remained stable during 1991-2009 at about 6 kg (SD ± 1 kg) for the whole fishery. It has shown strong interannual variations for individuals caught on free swimming schools with a pattern ver similar to yellowfin tuna.
0 10 20 30 40 50 60 Year Mean w eight (kg) 1991 1993 1995 1997 1999 2001 2003 2005 2007 2009 (a) YFT Free All Log 0 2 4 6 8 Year Mean w eight (kg) 1991 1993 1995 1997 1999 2001 2003 2005 2007 2009 (b) SKJ Free All Log 0 10 20 30 40 50 60 Year Mean w eight (kg) 1991 1993 1995 1997 1999 2001 2003 2005 2007 2009 (c) BET Free All Log
Figure 18: Annual time series of mean weight (kg) for (a) yellowfin, (b) skipjack, and (c) bigeye tuna for each fishing mode during 1991-2009
Acknowledgments. We are grateful to ORTHONGEL and all people involved in data collection and processing since the beginning of the monitoring of tuna purse seine fisheries in the Indian and Atlantic Oceans. We are indebted to Alain Fonteneau for his major contribution to the ”Observatoire Thonier” of IRD and Jean-Jacques Lechauve and Pascal Cauquil for development and management of databases. The collaboration with the Instituto Espa˜nol de Oceanografia (IEO) was instrumental in data processing and benefited from help by Alicia Delgado de Molina and Javier Ariz. This work was financed by the European Data Collection Framework and supported by the Direction des Pˆeches Maritimes et de l’Aquaculture (DPMA).
6. References
M´enard, F., F. Marsac, E. Bellier, and B. Cazelles. 2007. Climatic oscillations and tuna catch rates in the Indian Ocean: a wavelet approach to time series analysis. Fisheries Oceanography 16: 95–104.
Murtuggude, R. G., S. R. Signorini, J. R. Christian, A. J. Busalacchi, C. R. McClain, and J. Picaut. 1999. Ocean color variability of the tropical Indo-Pacific basin observed by SeaWiFS during 1997–1998. Journal of Geophysical Research 104: 18351–18351.
Murtuggude, R. G., J. P. McCreary, and A. J. Busalacchi. 2000. Oceanic processes associated with anoma-lous events in the Indian Ocean with relevance to 1997-1998. Journal of Geophysical Research 105: 3295– 3306.
Pallar´es, P., and J. -P. Hallier. 1997. Analyse du sch´ema d’´echantillonnage multisp´ecifique des thonid´es
tropicaux (Programme n° 95/37). IEO/ORSTOM. Pianet, R. 1999. Evolution du syst`eme de collecte et
de traitement des donn´ees de la pˆeche thoni`ere des senneurs europ´eens et assimil´es de 1981 `a 1998. IOTC Proceedings 2: 74–96.
Pianet, R., P. Pallar´es, and C. Petit. 2000. New sampling and data processing strategy for estimating the composition of catches by species and sizes in the European purse seine tropical tuna fisheries. IOTC Proceedings 3: 104–139.
Pianet, R., V. Nordstrøm, and A. Herv´e. 2006. French purse-seine tuna fisheries statistics in the Indian Ocean, 1981-2005. IOTC Proceedings IOTC-2006-WPTT-27.
Pianet, R., V. Nordstrøm, and P. Dewals. 2009. French purse seine tuna fisheries statistics in the Indian Ocean, 1981-2008. IOTC Proceedings IOTC-2009-WPTT-23.
7. Appendix tables
Table 1: Annual number of purse seiners by GRT category and total carrying capacity (GRT) of the French tropical tuna purse seine fishing fleet of the Indian Ocean during 1991-2009. Total carrying capacity (CC) was weighted by the proportion of time spent (in months) in the ocean
Year 200-400 401-600 601-800 801-1200 > 1200 Total CC 1991 0 4 3 9 2 18 12943 1992 0 4 2 9 2 17 14220 1993 0 4 2 9 2 17 14180 1994 0 4 2 9 2 17 13743 1995 0 4 2 9 2 17 14199 1996 0 3 2 10 2 17 13341 1997 0 3 2 10 4 19 14013 1998 0 3 2 8 3 16 13074 1999 0 2 2 8 3 15 12523 2000 1 1 2 8 3 15 12736 2001 1 1 2 11 5 20 13311 2002 0 1 2 10 5 18 14431 2003 0 0 1 8 5 14 13676 2004 0 0 2 8 5 15 14090 2005 0 0 2 9 5 16 13818 2006 0 0 2 12 5 19 17323 2007 0 0 2 12 5 19 19087 2008 0 0 2 12 5 19 18173 2009 0 0 0 12 6 18 13269
Table 2: Annual fishing effort of the French purse seine fishery expressed in fishing and searching days during 1991-2009. Searching days was derived from the total time spent at sea corrected for periods of damage, route towards port, and purse seine operation
Year Fishing days Searching days
1991 4309 3516 1992 4599 3683 1993 4711 3891 1994 4649 3774 1995 4831 3942 1996 4574 3784 1997 4603 3883 1998 4330 3676 1999 3838 3178 2000 3896 3200 2001 4070 3387 2002 4057 3335 2003 3488 2756 2004 3836 3039 2005 3845 3096 2006 4815 4024 2007 5541 4749 2008 4844 4092 2009 3315 2779
Table 3: Annual number of 1-degree squares explored by the French purse seine fleet during 1991-2009 Year Total #sets > 1 Catch > 0 Effort > 1 d Effort > 5 d
1991 411 334 321 332 203 1992 404 345 333 331 198 1993 414 333 325 328 218 1994 438 356 348 364 231 1995 445 367 362 371 232 1996 522 405 392 409 245 1997 524 415 392 422 258 1998 755 551 528 556 245 1999 611 426 411 418 196 2000 498 359 343 360 201 2001 458 355 339 353 219 2002 555 408 387 408 237 2003 410 313 302 293 186 2004 470 345 323 330 171 2005 441 353 336 337 198 2006 520 401 385 378 220 2007 492 391 373 370 242 2008 516 420 409 407 245 2009 591 372 353 371 189
Table 4: Number of positive and null sets by fishing mode made by the French purse seine fleet of the Indian ocean during 1991-2009. A = all; L = log-associated schools; F = free swimming schools
Year A-Total A-Positive A-Null L-Total L-Positive L-Null F-Total F-Positive F-Null
1991 3630 2448 1182 1622 1538 84 2008 910 1098 1992 4602 2980 1622 1708 1569 139 2894 1411 1483 1993 4164 2764 1400 1811 1612 199 2353 1152 1201 1994 4332 3099 1233 2326 2068 258 2006 1031 975 1995 4486 3066 1420 2276 2052 224 2210 1014 1196 1996 3956 2883 1073 2221 1956 265 1735 927 808 1997 3607 2714 893 2301 2035 266 1306 679 627 1998 3328 2454 874 2117 1828 289 1211 626 585 1999 3240 2371 869 1750 1553 197 1490 818 672 2000 3429 2526 903 1838 1568 270 1591 958 633 2001 3385 2481 904 1501 1378 123 1884 1103 781 2002 3469 2673 796 1940 1835 105 1529 838 691 2003 3651 2464 1187 1570 1405 165 2081 1059 1022 2004 4062 2580 1482 1511 1378 133 2551 1202 1349 2005 4442 3051 1391 1683 1532 151 2759 1519 1240 2006 4741 3233 1508 1967 1814 153 2774 1419 1355 2007 4857 3254 1603 2163 1933 230 2694 1321 1373 2008 4522 3264 1258 2196 1994 202 2326 1270 1056 2009 3108 2488 620 1998 1820 178 1110 668 442
Table 5: Distribution of the number of sets made on log-associated schools by set size (t) for the French purse seine fishery during 1991-2009 Year 0.1-10 10.1-20 20.1-30 30.1-40 40.1-50 50.1-60 60.1-70 70.1-80 80.1-90 90.1-100 >100 1991 211 428 306 211 125 68 48 26 26 26 63 1992 263 386 293 170 129 82 48 46 28 23 100 1993 264 413 294 167 118 87 60 55 44 27 83 1994 308 595 419 257 168 77 68 47 27 23 78 1995 389 511 369 239 160 104 79 57 45 37 61 1996 407 550 361 229 117 82 49 47 39 18 57 1997 530 570 334 235 121 66 47 42 29 19 42 1998 482 604 309 174 72 49 33 38 18 7 40 1999 312 360 256 165 107 74 60 48 32 26 113 2000 311 381 261 172 110 78 52 46 37 25 95 2001 274 404 233 155 81 47 42 33 24 18 67 2002 309 503 296 179 113 106 70 58 37 30 134 2003 269 344 220 137 99 76 43 49 37 15 116 2004 268 329 226 168 95 67 44 28 25 22 106 2005 315 407 238 152 110 75 71 34 28 16 86 2006 452 468 298 165 108 79 50 41 27 32 94 2007 578 553 314 185 104 74 26 30 17 10 42 2008 547 580 353 208 110 67 44 30 13 11 30 2009 424 503 287 214 120 87 48 40 24 11 61
Table 6: Distribution of the number of sets made on free swimming schools by set size (t) for the French purse seine fishery during 1991-2009 Year 0.1-10 10.1-20 20.1-30 30.1-40 40.1-50 50.1-60 60.1-70 70.1-80 80.1-90 90.1-100 >100 1991 148 200 156 103 86 47 46 24 24 17 59 1992 283 413 248 159 99 68 47 25 16 14 39 1993 242 286 191 111 95 55 52 21 22 22 54 1994 160 256 180 101 94 64 41 42 17 27 47 1995 175 265 197 115 90 47 35 27 15 17 31 1996 199 256 185 89 58 52 22 19 12 10 25 1997 163 176 128 80 47 29 18 16 4 2 16 1998 162 193 104 47 45 20 21 5 6 7 15 1999 199 196 137 73 66 30 25 18 22 13 39 2000 205 252 170 105 57 50 28 22 16 6 47 2001 282 268 181 99 73 57 43 30 18 7 45 2002 170 190 147 73 67 47 31 20 16 12 65 2003 146 195 150 108 97 78 48 35 33 34 135 2004 161 217 179 146 89 84 54 62 38 36 136 2005 224 363 275 193 120 80 58 61 25 25 95 2006 277 382 242 157 112 76 50 27 24 20 52 2007 325 387 230 126 99 41 37 24 11 9 32 2008 325 317 200 121 89 50 45 30 21 20 52 2009 147 169 111 61 64 35 24 10 11 5 31
Table 7: Distribution of the total number of sets by set size (t) for the French purse seine fishery during 1991-2009
Year 0.1-10 10.1-20 20.1-30 30.1-40 40.1-50 50.1-60 60.1-70 70.1-80 80.1-90 90.1-100 >100 1991 359 628 462 314 211 115 94 50 50 43 122 1992 546 799 541 329 228 150 95 71 44 37 139 1993 506 699 485 278 213 142 112 76 66 49 137 1994 468 851 599 358 262 141 109 89 44 50 125 1995 564 776 566 354 250 151 114 84 60 54 92 1996 606 806 546 318 175 134 71 66 51 28 82 1997 693 746 462 315 168 95 65 58 33 21 58 1998 644 797 413 221 117 69 54 43 24 14 55 1999 511 556 393 238 173 104 85 66 54 39 152 2000 516 633 431 277 167 128 80 68 53 31 142 2001 556 672 414 254 154 104 85 63 42 25 112 2002 479 693 443 252 180 153 101 78 53 42 199 2003 415 539 370 245 196 154 91 84 70 49 251 2004 429 546 405 314 184 151 98 90 63 58 242 2005 539 770 513 345 230 155 129 95 53 41 181 2006 729 850 540 322 220 155 100 68 51 52 146 2007 903 940 544 311 203 115 63 54 28 19 74 2008 872 897 553 329 199 117 89 60 34 31 82 2009 571 672 398 275 184 122 72 50 35 16 92
Table 8: Catch by species for the French purse seine fishery of the Indian ocean during 1991-2009
Year YFT SKJ BET ALB Others Total
1991 38134 39388 5441 875 0 83837 1992 45282 45048 3822 1403 0 95555 1993 39539 48192 5015 310 0 93057 1994 35819 58430 5367 292 0 99908 1995 39636 48652 7280 350 0 95918 1996 35578 40056 6908 391 0 82933 1997 31227 31276 7824 539 0 70866 1998 22382 30340 6389 460 0 59571 1999 30799 42665 8518 154 0 82136 2000 37694 39935 6673 350 172 84825 2001 34127 35673 5956 659 174 76589 2002 35815 54405 7962 264 195 98642 2003 63101 38258 6334 608 368 108670 2004 63174 37323 6798 77 649 108021 2005 57198 43220 6453 86 184 107140 2006 45383 49573 5714 850 290 101809 2007 36455 34918 6928 335 33 78669 2008 42185 34186 7652 981 10 85013 2009 27807 35532 6991 295 3 70628
Table 9: Catch by species made on log-associated schools for the French purse seine fishery of the Indian ocean during 1991-2009
Year YFT SKJ BET ALB Others Total
1991 8886 36896 3858 0 0 49639 1992 13014 39286 3112 9 0 55421 1993 12111 40582 2769 5 0 55467 1994 13340 45866 4313 23 0 63543 1995 19002 39380 5933 17 0 64332 1996 16944 33741 5975 70 0 56730 1997 18173 26882 7389 67 0 52511 1998 12680 25599 5173 13 0 43464 1999 17389 31759 6692 103 0 55943 2000 17699 32142 4960 43 172 55017 2001 9678 29045 4206 108 174 43211 2002 13704 47527 6385 0 171 67787 2003 16810 33837 3429 0 134 54209 2004 13959 31473 4882 0 339 50653 2005 15399 31270 3667 0 184 50520 2006 14818 37920 4172 0 214 57124 2007 13254 26695 4662 3 31 44645 2008 12784 29427 4486 2 10 46710 2009 12320 33004 5125 10 3 50462
Table 10: Catch by species made on free swimming schools for the French purse seine fishery of the Indian ocean during 1991-2009
Year YFT SKJ BET ALB Others Total
1991 29248 2492 1583 875 0 34198 1992 32268 5762 710 1394 0 40134 1993 27428 7611 2246 305 0 37590 1994 22479 12564 1054 269 0 36365 1995 20634 9272 1348 333 0 31587 1996 18633 6315 933 321 0 26203 1997 13054 4394 434 472 0 18355 1998 9702 4742 1215 448 0 16107 1999 13410 10907 1826 51 0 26193 2000 19995 7793 1713 307 0 29808 2001 24450 6627 1750 551 0 33377 2002 22111 6878 1578 264 24 30855 2003 46291 4422 2906 608 235 54461 2004 49215 5850 1916 77 310 57368 2005 41799 11950 2786 86 0 56620 2006 30564 11653 1542 850 76 44684 2007 23201 8224 2265 332 2 34024 2008 29401 4758 3166 979 0 38303 2009 15487 2527 1866 285 0 20166
Table 11: Catch per unit of effort (in t per searching day) for the French purse seine fishery of the Indian ocean during 1991-2009
Year YFT SKJ BET ALB Total
1991 10.85 11.20 1.55 0.25 23.84 1992 12.30 12.23 1.04 0.38 25.95 1993 10.16 12.39 1.29 0.08 23.92 1994 9.49 15.48 1.42 0.08 26.47 1995 10.05 12.34 1.85 0.09 24.33 1996 9.40 10.59 1.83 0.10 21.92 1997 8.04 8.05 2.01 0.14 18.25 1998 6.09 8.25 1.74 0.13 16.21 1999 9.69 13.43 2.68 0.05 25.85 2000 11.78 12.48 2.09 0.11 26.51 2001 10.06 10.55 1.76 0.19 22.61 2002 10.74 16.31 2.39 0.08 29.58 2003 22.90 13.88 2.30 0.22 39.43 2004 20.79 12.28 2.24 0.03 35.54 2005 18.48 13.96 2.08 0.03 34.61 2006 11.29 12.34 1.42 0.21 25.32 2007 7.70 7.37 1.47 0.07 16.61 2008 10.32 8.35 1.87 0.24 20.79 2009 10.01 12.79 2.52 0.11 25.42
Table 12: Catch per unit of effort (in t per searching day) on log-associated schools for the French purse seine fishery of the Indian ocean during 1991-2009
Year YFT SKJ BET ALB Total
1991 2.53 10.49 1.10 0.00 14.12 1992 3.53 10.67 0.85 0.00 15.05 1993 3.11 10.43 0.71 0.00 14.26 1994 3.53 12.15 1.14 0.01 16.84 1995 4.82 9.99 1.51 0.00 16.32 1996 4.48 8.92 1.58 0.02 14.99 1997 4.68 6.92 1.90 0.02 13.52 1998 3.45 6.96 1.41 0.00 11.82 1999 5.47 9.99 2.11 0.03 17.60 2000 5.53 10.04 1.55 0.01 17.19 2001 2.85 8.59 1.24 0.03 12.76 2002 4.11 14.25 1.91 0.00 20.33 2003 6.10 12.28 1.24 0.00 19.67 2004 4.59 10.36 1.61 0.00 16.67 2005 4.97 10.10 1.18 0.00 16.32 2006 3.68 9.44 1.03 0.00 14.21 2007 2.80 5.63 0.99 0.00 9.43 2008 3.13 7.19 1.10 0.00 11.42 2009 4.43 11.88 1.84 0.00 18.16
Table 13: Catch per unit of effort (in t per searching day) on free swimming schools for the French purse seine fishery of the Indian ocean during 1991-2009
Year YFT SKJ BET ALB Total
1991 8.32 0.71 0.45 0.25 9.73 1992 8.76 1.56 0.19 0.38 10.90 1993 7.05 1.96 0.58 0.08 9.66 1994 5.96 3.33 0.28 0.07 9.63 1995 5.23 2.35 0.34 0.08 8.01 1996 4.92 1.67 0.25 0.08 6.93 1997 3.36 1.13 0.11 0.12 4.73 1998 2.64 1.29 0.33 0.12 4.38 1999 4.22 3.43 0.57 0.02 8.24 2000 6.25 2.44 0.54 0.10 9.31 2001 7.22 1.96 0.52 0.16 9.85 2002 6.63 2.06 0.47 0.08 9.25 2003 16.80 1.60 1.05 0.22 19.76 2004 16.19 1.92 0.63 0.03 18.88 2005 13.50 3.86 0.90 0.03 18.29 2006 7.60 2.90 0.38 0.21 11.11 2007 4.90 1.74 0.48 0.07 7.19 2008 7.19 1.16 0.77 0.24 9.37 2009 5.57 0.91 0.67 0.10 7.26