HAL Id: hal-02746837
https://hal.archives-ouvertes.fr/hal-02746837
Preprint submitted on 3 Jun 2020HAL is a multi-disciplinary open access archive for the deposit and dissemination of sci-entific research documents, whether they are pub-lished or not. The documents may come from teaching and research institutions in France or abroad, or from public or private research centers.
L’archive ouverte pluridisciplinaire HAL, est destinée au dépôt et à la diffusion de documents scientifiques de niveau recherche, publiés ou non, émanant des établissements d’enseignement et de recherche français ou étrangers, des laboratoires publics ou privés.
Distributed under a Creative Commons Attribution - NonCommercial - ShareAlike| 4.0
Modeling the influence of extreme climate variability on
sugarcane yield gap in Reunion Island
Mathias Christina, Mickael Mézino, Lionel Le Mézo, Sandrine Auzoux,
Jean-Christophe Soulié, Matthew Jones, Christophe Poser, Pascal Marnotte,
Eward Gerardeaux
To cite this version:
Mathias Christina, Mickael Mézino, Lionel Le Mézo, Sandrine Auzoux, Jean-Christophe Soulié, et al.. Modeling the influence of extreme climate variability on sugarcane yield gap in Reunion Island. 2020. �hal-02746837�
Modeling the influence of extreme climate variability on sugarcane yield gap in Reunion Island
Christina M.1,2, Mezino M.2,3, Le Mezo L.2,3, Auzoux S.1,2, Soulié JC.4, Jones M.5,6, Poser C.2,7,
Marnotte P.1,2, Gerardeaux E.2,7
1CIRAD, UPR AIDA, F-97743 Saint-Denis, Réunion, France. 2AIDA, Univ Montpellier, CIRAD, Montpellier, France. 3CIRAD, UPR AIDA, F-97410 Saint-Pierre, Réunion, France.
4CIRAD, UPR Recyclage & Risque, F-97743 Saint-Denis, Réunion, France.
5South African Sugarcane Research Institute, Private Bag X02, Mount Edgecombe, 4300, South
Africa
6Department of Plant and Soil Sciences, University of Pretoria, Private Bag X20, Hatfield, 0028,
South Africa
7CIRAD, UPR AIDA, F-34398 Montpellier, France.
Abstract:
Among other challenges, the already increasing incidence and intensity of extreme climate events are a major threat to global crop production. Sugarcane represents the main source of sugar and important part of ethanol and material for electric energy productions in tropics and sub-tropics and grown in climatic areas subjected to extreme events.
Reunion Island presented extremely contrasting climates and is regularly subjected to tropical cyclones. In this study, we used the crop model MOSICAS, combined with spatial databases (sugarcane field boundaries, soil type, meteorological data and irrigation management practices) to predict the potential and water-limited cane yield over the entire island from 1998 to 2018. Therefore, we compared them to actual cane yield from sugar producers in five agro-climatic zones. The average total yield gap (YGT, i.e. difference between potential cane yield and actual yield) over Reunion
Island was 96 t ha-1, of which 66% was due to water deficit. YGT increased to 120 t ha-1 with
increasing temperature, radiations and precipitations, highlighting the influence of others biotic and abiotic limiting factors.
Extreme climate indices were calculated for heavy rain, extreme winds, high temperature and drought at the agro-climatic zone scale and their influence on yield gap was assessed using a Principal Component Analysis (PCA). Yield gap was strongly correlated with the first axis of this PCA (ρ=0.56), highlighting how extreme precipitation induced increase in YGT. Based on a clustering
analysis on extreme precipitation and wind, 4 agro-climatic clusters were defined. Actual yield loss (difference between yield and the yield of the best year in the same zone) was in average 10 t ha-1 higher in the cluster with the highest precipitation and wind than the cluster with low extreme events, and sugarcane losses could reach 28 t ha-1.
The objective of this study was to assess the impact of extreme climate variability on cane yield gap in Reunion Island. It highlights how sugarcane yield is constrained by both abiotic factors and extreme events occurrence in Reunion Island. The implication for sugarcane management under extreme events is discussed.
1. Introduction
The key role of crop models is to help understand and predict the effects and interactions between climate, soil and management on crop development and yield. Crop models can provide insights into the main emerging agricultural challenges such as food security, sustainability and how to cope with the possible negative effects of climate change (Spiertz, 2012). Among these challenge, extreme weather events are expected to increase worldwide and are expected to reduce crop production (Field et al., 2012; Porter et al., 2014). The already increasing incidence and intensity of extreme climate events are seen as the principle immediate threat to global crop production (Meehl et al., 2000; Rosenzweig e tal., 2001; Olesen et al., 2007; Urban et al., 2012; Min et al., 2011; Lobell et al., 2008, 2013). Therefore, anticipating and calculating their effect on crop yields is important for topics ranging from food security to the economic viability of biomass products.
Among other crops, sugarcane represents a major source of sugar, ethanol and material for electric energy productions in tropics and sub-tropics. In the energy sector, the demand for ethanol and electricity is likely to increase, as it could replace fossil fuels and reduce greenhouse gas emissions (Goldemberg et al., 2014; Leal et al., 2013). Due to their agroclimatic zones, sugarcane plantations faced various extreme events such as extreme temperature (e.g. India, Mall et al., 2016), drought (e.g. Australie, Inman-Bamber et al., 2005), flood (e.g. Florida, Gilbert 2008) or storm (e.g. Beuzelin et al., 2009), which could be responsible for strong yield loss (e.g. 54-64% under 3-month flood, Gilbert et al., 2008) up to cane failure (e.g. under drought, Inman-Bamber et al, 2005).
Yield Gap (YG) analysis, based on the differences between different crop yield types, provides a basis for identifying the main factors affecting crop yield and providing valuable information to guide the interventions of growers, researchers, public agencies and stakeholders (van Ittersum et al., 2013). The following types of crop yields can be considered: the potential yield (YP), which is the yield of a
given cultivar only determined by solar radiation, air temperature, photoperiod, CO2 concentration,
genotype and plant populations ; the water-limited yield (YW) which to the same than YP, but
additionally influenced by water deficit resulting from the rainfall amount and distribution along the crop cycle, as well as soil water holding capacity and evapotranspiration; and finally the actual or average yield (YA) which is defined as the yield actually obtained by farmers, considering fertilizer
limitations as well as soil fertility, pests and diseases damages. According to Dias and Senthelas (2018), the difference between YP and YW results in the YG caused by water deficit (YGW), whereas
the difference between YW and YA gives the YG caused by crop management and hazards (YGM).
While the use of crop models as a tool to analyze temporal and spatial variation of yield gaps appears to be straightforward, relatively few examples of this type of application can be found in literature for sugarcane. Most of these studies aimed to better separate the effect of climate and management on sugarcane yield (Garside et al., 1997 ; Jones et al., 2015 ; Cheeroo-Nayamuth et al., 2011; Van den Berg and Singels, 2013) but, to our knowledge, none of them have tried to link extreme events and yield gap.
Reunion island is a particularly adapted agro-climatic zone to assess the impact of extreme weather events variability on sugarcane yield gap. Around 23 thousand ha are cultivated with sugarcane in Reunion Island, representing about 58% of total agricultural areas (DAAF, 2015). Planted area with sugarcane ranged from sea level m to >1000 m above sea level resulting in large differences in temperature, radiation or wind conditions. The Reunion Island also presents a very strong precipitation variability over the island, with very low (<30 mm y-1) or high precipitation (>5000 mm y-1) depending on location. Moreover, growers face cyclones regularly, as well as fluctuating dry
Considering that yield gap studies are of high importance for guiding strategic actions to improve crop yields, in particular for tropical islands with such diverse environmental conditions and extreme events, the objectives of this study were i) to assess the magnitude of sugarcane yield gaps due to water deficit and crop management in Reunion Island over the last 20 years and, ii) to assess the impact of climate variability and extreme events intensity on sugarcane yield gap.
2. Material & Method
2.1. Cane management data over Reunion Island
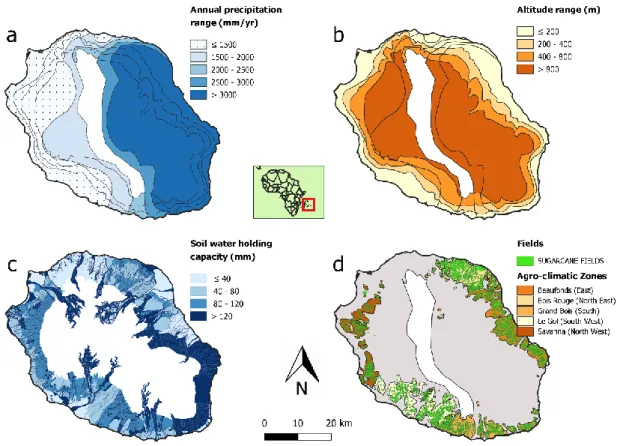
Reunion Island is commonly divided into 5 agro-climatic zones (Fig. 1). As presented in Fig. 1 and Fig. S1, two of them are rainfed in majority: Beaufonds (East part of the island) and Bois Rouge (North East) while the others are irrigated for around 50% of the area: Savanna (North West) and Le Gol (South West) and one is an intermediary zone with 20% of the area being irrigated: Grand Bois (South).
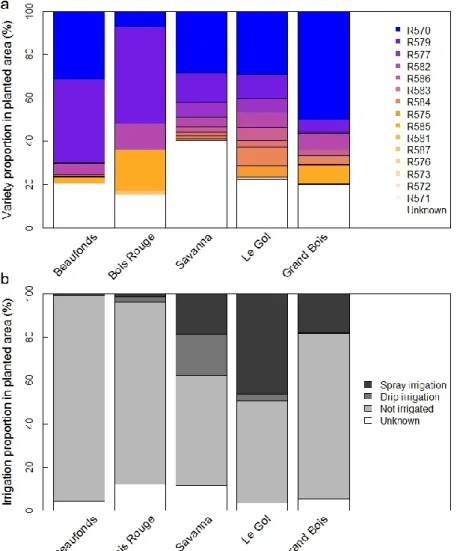
A detailed identification of 10,403 sugarcane fields was made over Reunion Island (Fig. 1d), which should represent nearly all the actual sugarcane fields in 2017. The identification was performed by combining a remote-sensing approach and the use of databases from several institutes (Centre Technique Interprofessionnel de la Canne et du Sucre, CTICS) or state agency (Direction de l'Alimentation, de l'Agriculture et de la Forêt,). At the end, all cane fields were associated with a planted area (m²), an irrigation management (drip or spray irrigation when irrigated) and planted cane varieties. The irrigation management was obtained from the CTICS database (2008, resumed in Fig S1). When not identified, the irrigation management was assumed to be a spray irrigation in Savanna, Le Gol and Grands Bois, and was assumed not to be irrigated in the east part of the island (Beaufonds and Bois Rouge, personal communication with the CTICS). The sugarcane varieties in each field were obtained from the DAAF database in 2017 (resumed in Fig. S1). Between 20 and 40% of sugarcane fields were not identified with a given variety due to a lack of information. When we did not know the variety, we assumed that the planted variety was the R570 in Savanna, Le Gol and Grand Bois, and the R579 in Beaufonds and Bois Rouge. We choose these two varieties when no data were available because there are the most planted variety in these agro-climatic zones (CTICS, personal communications).
2.1. Climate data
Based on the annual precipitation and altitude range maps (Fig. 1a,b), 33 climatic areas where defined over Reunion Island. These maps were obtained through the AWARE Atlas (https://smartis.re/p/AWARE) developed by the CIRAD institute in Reunion Island. In each climatic zone, the centroid was assessed and daily climatic data (precipitation - PPT, global radiation - RG,
potential evapotranspiration - ETP, minimum - TMIN and maximum temperature - TMAX) were
obtained using the METEOR software (https://smartis.re/METEOR). The software interpolated the daily weather data at requested localization based on a station network from the CIRAD and Météo-France (Fig. S2). Daily weather data in each of the 33 climatic zones were interpolated from 1998 to 2018. Wind speed data used for the storm indice calculation (see section 2.5) were not interpolated but obtained in 5 meteorological stations (one per agro-climatic zone) at similar distance and altitude from the coast (except for the North-West zone where cane are grown in altitude, Fig. S2). A detailed soil water holding capacity map - SWC (Fig. 1c) was also obtained from the AWARE Atlas. Soil water holding capacity over Reunion Island range from 10 to 200 mm in cane areas.
Fig 1. Soil, climate and cane field data over Reunion Island. Annual precipitation (a) and altitude range (b) were used to define climatic areas. Soil water holding capacity over Reunion Island (c) range from 10 to 200 mm in agricultural areas. Each cane fields over the island were identified and associated with an agro-climatic zone (d). Sources: a: Météo-France & Cirad ; b: IGN & SHOM ; c: Raunet 1988 ; d: ASP 2016 from IGN ; production: Cirad AIDA, 2019; EPSG:32740 - WGS84 / UTM 40Sud.
In the current study, PPT, TMEAN (daily average temperature), ETP and RG were averaged per year in
each cane field. Then, the average annual climatic data and SWC in a given agro-climatic zone was calculated as the average field-scale data weighted by the field planted areas. Additionally, a climatic variable integrating the sum of annual precipitation and the quantity of irrigated water was defined (PPTIRR).
2.2. MOSICAS model presentation
The MOSICAS model (Martiné and Todoroff, 2002) simulates the daily sugarcane growth at a field scale for given management scenarios. MOSICAS, a deterministic thermoradiative type model that accounts for water stress, consists of growth and carbon balance modules linked to a water balance module. The modeling of Leaf Area Index (LAI) is a ‘big leaf’ type, and is based on the balance between daily increase (growth) and daily decrease (senescence) in leaf surface area. This balance is mainly driven by temperature and is limited by radiation with respect to leaf mass and water stress. MOSICAS converts the daily intercepted photosynthetically active radiation (PAR) into daily gain in total dry mass. This conversion process is affected by temperature and water stress coefficients, as well as a maintenance respiration coefficient and the variety maximum radiation conversion efficiency. The partitioning of total dry mass gain to root and aboveground dry mass gain is regulated
by dynamic allometric fractions that depend on thermal time. Then, the partitioning of daily increase in aboveground dry mass to daily increase in millable stalk dry mass is regulated by dynamic allometric fractions that depend on the amount of aboveground biomass. The partitioning of daily increase in millable stalk mass to daily increase in structures is regulated by a dynamic allometric fraction that depends on the amount of existing millable stalk mass, temperature and water stress indexes. The remaining biomass not allocated to structures is stored as stalk sucrose. Above-ground and stalk water content is assumed constant (parameter) at the beginning of the growth and decreased with thermal time. The model code, executable and manual are open-source (General Public Licence) and available on Github repositories (https:// https://github.com/ChristinaMathias/MOSICAS). The main model equations driving cane growth are described in supplementary information (S3).
2.3. MOSICAS calibration
Cane varieties were calibrated using the ECOFI open database (Christina et al., 2020b). The ECOFI database includes 58 trials in total (60 varieties) carried out by CIRAD and partners from 1988 to the present, in Reunion Island and a few other countries (e.g. Guadeloupe, South Africa). The link between the ECOFI database and the MOSICAS model was performed using R script to create model input (also available in https://github.com/ChristinaMathias/MOSICAS). The model was calibrated using various measurements (Fig. S4): LAI, fraction of intercepted radiation (faPAR), aboveground dry and fresh mass, stalk dry and fresh mass, as well as aboveground and stalk water content. Calibration of parameters followed an iterative hierarchical process where priorities of decreasing order were the leaf area dynamics and interception, radiation conversion into biomass, biomass partitioning and sensitivity to water stress (Supplementary Material S3 –Calibration Procedure and Results, Fig. S3). The R570, R579, R585 and R586 cane varieties were calibrated using 20, 3, 9 and 9 ratoon crop cycles, respectively. In total, 21 parameters were calibrated. The LAI base temperature of 3 other varieties (R581, R582 and R583) were obtained from literature as used in the web version of the model (https://smartis.re/MOSIWEB). As no experimental data were available to parameterized other planted variety in Reunion Island, we assumed that additional sugarcane varieties were identical to the R570 or R579, as it is historically the most planted varieties in the island. Details on parameter values for the different varieties are given in Table S1.
2.4. Sugarcane yield simulations & observations
Actual fresh sugarcane yield (YA) and the average date of half-campaign for cane harvest were
obtained from sugarcane industries from 1998 to 2018 in the 5 agro-climatic zones presented previously. To match observations, sugarcane growth was simulated using the MOSICAS model in each field from 1998 to 2018. In each agro-climatic zone, all fields were assumed to have the same harvest date, defined as the date of half-campaign. Considering that the harvest campaign last around 6 months in Reunion Island, we considered that a sugarcane field was harvested at five different dates (half-campaign, +/– 1 months and +/- 2 months), and the average yield was used. As an approximation, all sugarcane fields over Reunion Island were assumed to be ratoon crop as no information on new planted cane were available on the whole period. When field were irrigated, irrigation management was assumed to be 12,000 m3 ha-1 year-1 (fixed dose of 25 mm week-1), which represents common practices in Reunion, with an efficiency of 1 for drop irrigation and 0.9 for spray irrigation (i.e. means that 10% of irrigated water is lost outside the field). Five soil layers were defined in the MOSICAS model. Each layer had identical welting point, field capacity and saturation, avoiding thus differences in terms of water drainage. To take into account the difference of soil water holding capacity (Fig. 1c), the soil depth was adjusted to match this value.
Two types of simulations were performed at field scale: sugarcane yield at the thermoradiative potential (YP, not taking into account water stress) and sugarcane yield taking into account water
stress (YW). The MOSICAS model does not take into account fertilizer stress or other biotic stresses
such as weed pressure. All components of cane growth were simulated but only the fresh stalk yield (equivalent to millable stalk) was used in this study and defined as “cane yield”. The average YP and
YW in a given agro-climatic zone was calculated as the average field-scale YP and YW weighted by
the field planted areas. Total Yield Gap (YGT) was defined as the difference between YP and the
actual cane yield (YA), averaged at the agro-climatic zone scale. Water-limited yield gap (YGW) was
defined as the difference between YP and YW. Finally, YG caused by crop management and hazards
(YGM) was defined as the difference between YW and YA.
2.5. Extreme events index
Based on daily climatic data, Extreme Climatic Index (ECI) were defined at the agro-climatic scale: extreme precipitation (ECIPPT), extreme temperature (ECITMAX), extreme drought (ECIDRY) and
extreme wind speed (ECIWIND) index. For precipitation, ECIPPT was defined at the field scale as the
proportion of daily precipitation above a threshold (defining extreme precipitations) between two harvest dates. The precipitation threshold was assessed as the 97.5% quantile of measurements from 1998 to 2018 across space and was equal to 28.2 mm d-1. Using the same method, ECITMAX was
defined as the proportion of extreme daily event with TMAX higher than 31.7°C. Considering ECIDRY,
in each field all drought events between two harvest dates were characterized by their duration in days. A threshold of 12 days for drought duration was defined using the 97.5% quantile across space and time. Finally, ECIDRY was defined as the number of drought event higher than 12 days in each
field between two harvest days. Average ECIPPT, ECITMAX and ECIDRY per agro-climatic zone were
then calculated as the average field scale ECI weighted by the field area. Considering ECIWIND,
interpolated field scale wind speed was not available and only one station per zone was used The ECIWIND index was calculated using the daily maximum wind speed with the same method as previous
ECI with a threshold of 16 m s-1.
2.6. Statistical and data analyses
The whole dataset is accessible via Dataverse (Christina et al., 2020c). All statistical analyses were made using R 3.6 (R Development Core Team 2019). Weather data (Fig 2.) and ECI (Fig 4) were compared among agro-climatic zones using Tukey HSD test (multicomp R package). Differences were considered statistically significant if p < 0.05. To improve data visualisation (Fig. 2, 3 and 5), smooth regression were performed using local polynomial regression fitting with variability bands (loess.sd function from the msir R package with a constant smoothing parameter of 0.5). Principal components analyses (PCA) were used to visually illustrate separately the effects of climate variables (Fig. 3), on one hand, and extreme climate indices (Fig. 5), on the other hand. PCA was performed with FactoMineR and factoextra R packages. Correlation between the first two axes of the PCA and YGT and YGM were tested using a spearman correlation test (cor.test function). Finally, a hierarchical
clustering analysis was performed on the ECIPPT and ECIWIND components to illustrate the effect of
cyclones (HCPC function in FactoMineR package). Based on this analysis, 4 groups were isolated and the difference of YGT, YGM and actual yield loss (i.e. the difference between the maximum YA
and the YA of each year in a given agro-climatic zone) among these groups were tested using a Dunn
multiple test comparison, as the residual normality and homoscedasticity conditions were not satisfied (dunn.test R package). In this Dunn test case, differences were considered statistically significant if p < 0.025.
3. Results
3.1. Sugarcane yield and yield gap variability
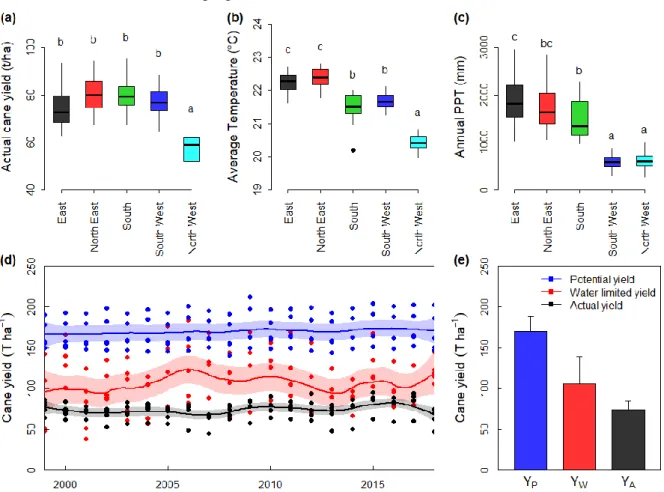
Actual cane yield (YA) was similar among agro-climatic zones (74 t ha-1 in average) except for the
North-West zone (57 t ha-1 in average, Fig 2a). This North-West zone was characterized by a low
average daily temperature (20.4°C, Fig 2b) and low annual precipitation (614 mm y-1, Fig 2c). The
East and North-East zones were the warmest (22.3°C) and wettest areas (1801 mm y-1). Nevertheless, actual sugarcane yield showed an annual variability. The coefficient of variation due to annual variability was similar among agro-climatic zones and varied from 8 % to 11 %. Moreover, for a given zone the difference of yield between the best year and the worst one varied between 20 t ha-1
(North West) and 31 t ha-1 (East).
In average, the simulated potential (YP) and water-limited (YW) yields at the agro-climatic zone scale
were 170 (+/-19) and 106 (+/- 33) t ha-1, leading to a total yield gap (YGT, i.e. difference between YP
and YA) of 96 t ha-1 (Fig 2d). This yield gap resulted from a 64 t ha-1 water limited yield gap (YGW,
difference between YP and YW) and from a 32 t ha-1 yield gap due to management and hazard (YGM,
i.e. difference between YW and YA), in average. While YP showed little annual variation, with a
coefficient of variation ranging from 2 to 3 % depending on the agro-climatic zone, YW presented a
higher variability over years, ranging from 13 % (North East) to 26 % (North West). In comparison, YA had annual variations ranging from 8 to 11 %.
Fig 2. Average actual cane yield (a), daily temperature (b) and annual precipitation (PPT, c) over the 1998-2018 period depending on the agro-climatic zone define in Fig 1d. The annual evolution of cane yield (YA, black), simulated water-limited yield (YW, red) and potential yield (YP, blue) is
presented in (d) and averaged in (e). A polynomial smooth regression over years was added (line) with standard deviation (transparent color).
3.2. Climate variability and yield gap
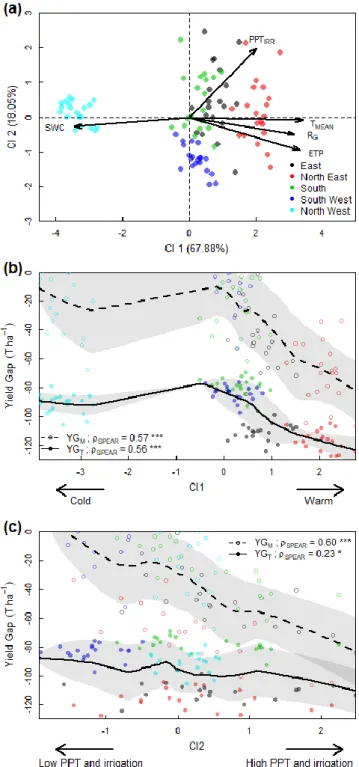
Based on a principal component analysis (PCA) we summarized 5 soil and climatic variables into 2 climatic indexes (CI1 and CI2, Fig 3a). The first component (CI1, 67.9% of the explained variance) was mainly determined via the average daily temperature (TMEAN), global radiation (RG), potential
evapotranpiration (ETP) and soil water holding capacity (SWC). The annual water input (precipitation + irrigation, PPTIRR) contributed to both IC1 and the second component (CI2, 18.1%
of the explained variance).
Total yield gap (YGT) was positively correlated
with CI1 value (ρSPEAR = 0.56, p < 10-6), with
YGT reaching around 120 t ha-1 in warm and
high ETP environments (Fig 3b). In colder environments (i.e. low values of CI1), YGT was
relatively constant (around 90 t ha-1). YGT was
also positively correlated (ρSPEAR = 0.23,
p=0.021) with CI2, but it varied less from 90 t ha-1 in low precipitation environments to 110 t ha-1 in high precipitation ones (Fig 3c).
Following a similar pattern, management yield gap (YGM) was positively correlated with CI1
(ρSPEAR = 0.57, p < 10-6). YGM increased from 0
to 80 t ha-1, with increasing temperature and
ETP. YGM was also strongly correlated with CI2
(ρSPEAR = 0.60, p < 10-6). In low precipitation
environments, YGM was null but reached 80 t ha -1 for the years and zones with the highest
precipitations.
In warmer and higher ETP environment, YGT
increased mainly due the increase in YGM while
YGW (difference between YGT and YGM)
remained relatively constant. In higher precipitation environments, YGT also increased
due to increase in YGM but YGW decreased.
Fig 3. Principal component analysis (PCA) on average soil and climatic variables per agro-climatic zones (a): Average daily temperature (TMEAN), global radiation (RG), potential evapotranspiration (ETP), annual
water input (precipitation + irrigation, PPTIRR) and soil water holding capacity (SWC). The change in total
(YGT) and management (YGM) yield gaps with the two first axis of the PCA (CI1 and CI2) are shown in b and
c. The spearman correlation between the yield gaps and the PCA axis are indicated. A polynomial smooth regression was added (line) with standard deviation (transparent). Arrows were added to help the figure interpretation.
3.3. Extreme climate events and yield gap variability
Extreme events occurrence varied among agro-climatic zones (Fig 4). Extreme rainfall (ECIPPT)
occurred more in the East and South coasts of Reunion Island than in the West Coast (Fig 4a). The North-East and South coasts underwent frequent extreme wind speed events (ECIWIND) than the rest
of the island (Fig 4b). Extreme drought events (ECIDRY) showed the opposite pattern than ECIPPT,
with the East Coast with the lowest values and the West Coast with the highest values (Fig 4c). Finally, considering, extreme daily temperature (ECITMAX), the East Coast was little impacted,
contrary to the South and North West zones, and even more to the South-West agro-climatic zone (Fig 4d).
Fig. 4. Bean plot density of extreme events indices depending on the agro-climatic zones: extreme rain (ECIPPT, a), wind speed (ECIWIND, b), drought (ECIDRY, c) and temperature (ECITMAX, d). A Tukey
test was performed and significant differences (p<0.05) among zones are indicated by different letters a,b,c.
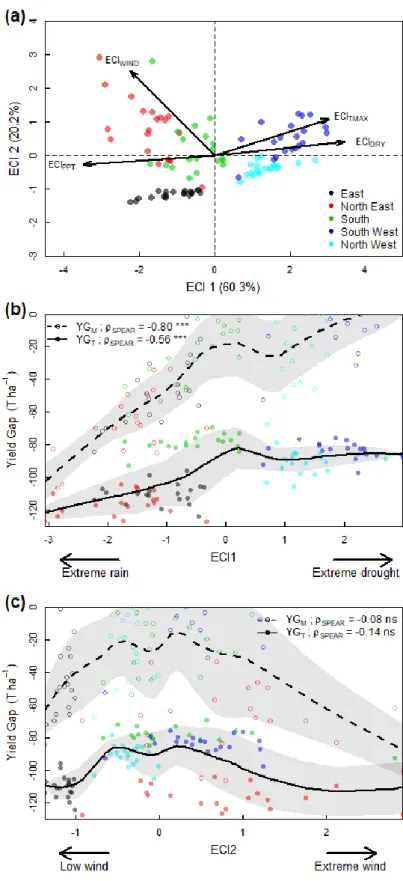
Based on a PCA these for extreme event index were summarized into 2 extreme climatic indexes (ECI1 and ECI2, Fig 5a). The first component (ECI1, 60.3% of the explained variance) was mainly determined via ECIPPT, ECIDRY and ECITMAX. The ECIWIND contributed to both EIC1 and the second
Total yield gap (YGT) was negatively
correlated with ECI1 value (ρSPEAR = -0.56,
p < 10-6), with YGT reaching around 120 t ha -1 in environments with extreme rainfall
events (Fig 5b). In drier environments (i.e. high values of ECI1), YGT was relatively
constant (86 t ha-1). YGT was not monotony
correlated with ECI2 but the lowest YGT
values were found in environments with medium wind speed events (Fig 5c).
Following a similar pattern, management yield gap (YGM) was negatively correlated
with ECI1 (ρSPEAR = -0.8, p < 10-6). YGM
increased from 0 to 100 t ha-1, with
increasing extreme rainfall events. Similarly, to YGT, YGM was not correlated with ECI2
but the lowest values were found to medium wind speed environments.
Fig 5. Principal component analysis (PCA) on extreme climatic index defined in section 2.5 (a): the extreme climatic indices were calculated based on high precipitation (ECIPPT), high wind (ECIWIND),
maximum temperature (ECITMAX) and drought length (ECIDRY). The change in total (YGT) and
management (YGM) yield gaps with the two first axis of the PCA (ECI2) are shown in b and c. The
spearman correlation between the yield gaps and the PCA axis are indicated. A polynomial smooth regression was added (line) with standard deviation (transparent). Arrows were added to help the figure interpretation.
3.4. Yield loss under extreme rainfall and wind speed
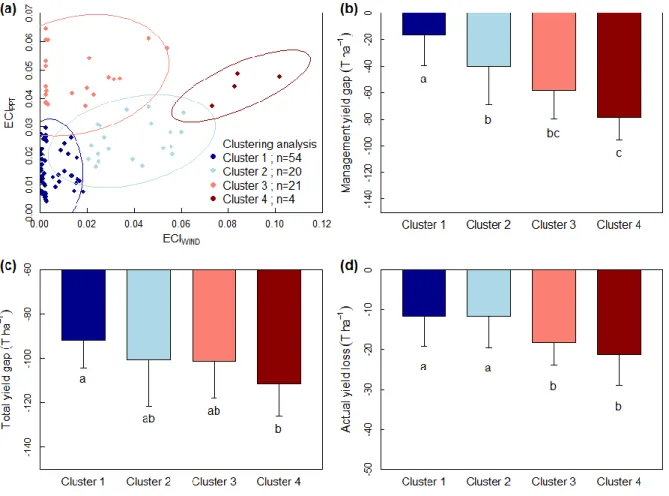
Based on a hierarchical clustering analysis on ECIPPT and ECIWIND variables, four clusters of
year-zone units were defined (Fig 6a). The cluster 1 included environments with low ECIPPT and ECIWIND.
The cluster 2 included environments with higher ECIWIND values but with low ECIPPT. The clusters 3
and 4 both included environments with high ECIPPT, but only the cluster 4 also showed extreme high
wind speed events. Management yield gap (YGM), total yield gap (YGT) and actual yield loss (i.e.
difference between the actual yield of the best year of a given zone with the considered year) all increased from group 1 to 4 (Fig 6). In average, YGT, YGM and actual yield loss were equal to 92, 16
and 12 t ha-1 in cluster 1 with low rainfall and wind extreme events. In environments with high rainfall
and wind extreme events, YGT increased by 11 and 22 %, YGM by 265 and 393%, and actual yield
loss increased by 58 and 85%, in clusters 3 and 4 respectively. In years with high precipitation and wind extreme events (clusters 3 and 4), the loss in actual cane yield was 19 t ha-1 in average, compared to the year with highest yield, and could reach 28 t ha-1.
Fig. 6. Clustering analysis on extreme indices for precipitation (ECIPPT) and wind speed (ECIWIND)
variables (a): four clusters were defined. Mean management yield gap, total yield gap and actual yield loss depending on these clusters are presented in b,c,d. The actual yield loss is defined as the difference between the YA of the best year and the YA of each year in a given agro-climatic zone.
4. Discussion
4.1. Yield gap in Reunion Island
The assessed total yield gap (i.e., the difference between thermoradiative potential cane yield and actual cane yield) over Reunion Island in our study was 96 t ha-1 on average (ranging from 67 to 132.6
t ha-1 depending on the years and zones). In this study, all fields were assumed to be ratoon crop
which could slightly increase the yield gap at the regional scale. Nevertheless, this yield gap was weaker than the yield gap assessed in other countries. As, an example, Dias and Sentelhas (2018) assessed an average yield gap of 134 t ha-1 over Brazil. Similarly, Zu et al. (2018) assessed a regional
average yield gap in China of 156.3 t ha−1, varying from 74.82 t ha−1 to 214.2 t ha−1, depending on climate conditions and crop management practices.
Our results showed that the proportion of the yield gap due to water deficit and crop management was strongly variable. In average, water deficit account for 66% of the total yield gap in Reunion Island, which was similar with has been found in other climates (e.g. 73% in Brazil, Dias and Senthelos). As shown in this study, this proportion differed spatially and annually, with 88% in average in the dry west coast and 50% in the east wet coast (Fig S5). Part of this spatial variability could be explained by irrigation difference between east and west, but YGW was only ~25 t ha-1 higher
in rainfed fields that in irrigated ones in average whatever the precipitation (Fig S6). As a comparison, in the neighbour Mauritius Island, previous studies have shown more than 100 t ha-1 yield differences
between irrigated and rainfed modeled water-limited yield (Cheeroo-Nayamuth et al. 2011). Another part of this variability could be explained by soil water holding capacity (SWC), in particular because irrigation appeared to be inefficient for SWC lower than 75 mm (Fig. S7). Nevertheless, while at the field scale SWC variability strongly influenced YGW (Fig S7), average sugarcane field SWC per
agro-climatic zone was only varying from 85 to 104 mm in our study. Consequently, the remaining factor explaining YGW differences in the agro-climatic zones in Reunion Island could be caused by factors
not taken into account in Mosicas model such as increasing biotic and abiotic pressure on yields link to climate (weed pressure, management practices…).
4.2. Increasing yield gap with source availability
Our study highlighted how yield gap increase with thermoradiative sources (TMEAN, RG, ETP) and
water source (precipitation + irrigation, PPTIRR) availability in Reunion Island. Such observation
means that sugarcane growth cannot reach its full potential even with increasing radiation use potential. This observation suggested than other limiting factors for sugarcane growth occurred, such as fertilization, weed pressure or water losses.
In Reunion Island, limiting fertilization is not likely to be a main factor explaining increasing YG with source availability, because growers received fertilization advice based on subsidized soil analysis in Reunion Islands (Serdaf program, Versini et al., 2018). Nevertheless, this factor has to be considered as inadequate nutrition has been highlighted as a major impact explaining yield gap in other countries such as China (Zu et al., 2018) or South Africa (Van de Berg and Singels, 2013) with similar fertilization rates. Rather than fertilizers amount, a fertilizer use efficiency decreasing with higher rain (due to nitrate lixiviation, volatilization or surface erosion for example) could explain the increasing YG. As an example, Poultney et al. (2019) assessed the fertilizer use efficiency as only 22% during a rainy year in the North-East coast of Reunion.
Increased thermoradiative and water source availability is also likely to increase weeds pressure on sugarcane growth (Patterson et al., 1999; Ibrahim 1984), which is a main constraint in most tropical climate (Oerke 2006, 2004). Temperature and precipitation are the primary variables controlling the
distribution of vegetation (Woodward and Williams, 1987). Weeds share the same trophic level with crops and compete with crops for the resources. Additionally, growth of weeds of warm season is generally very responsive to small increases in temperature (Flint et al., 1984; Flint and Patterson, 1983; Patterson, 1993). Consequently, increase in weed pressure could be a factor explaining the increase in yield gap observed in Reunion Islands under elevated temperature and precipitation. Finally, the water use efficiency under higher precipitation must be considered due to the irregular topography of agricultural basin, particularly in high altitude. The model could underestimate the water loss due to drainage or runoff in these steep reliefs. Nevertheless, we argue that this effect in high altitude on water-limited yield should be limited because the fields in highest altitudes already showed the highest proportion of precipitation loss into drainage in our simulation (Fig S8), probably due to the lower ETP and water consumption by canes in altitude. Consequently, we hypothesize that the increasing yield gap with increasing thermoradiative and water sources would mainly be due to decreasing fertilizer use efficiency and increasing weed pressure.
4.3. Managing sugarcane under extreme events
This study suggests that storms and cyclones are main factors affecting the yield gap and inducing yield loss in Reunion Island. Total yield gap increased by 20 t ha-1 when high extreme precipitation and wind speed events occurred, corresponding to a similar increase in actual yield loss. Issues with storms is not limited to this part of the Indian Ocean, other productive countries such as Philippines with extreme winds (Stromberg et al., 2011) or USA with flood (Deren et al., 1991) are sensitive to these extreme events which can cause considerable economic damage. In Reunion island drought and warm event intensity is relatively low, inducing weak effect on yield gap in this study. Nevertheless, other countries have been shown to be much more sensible to extreme temperature (e.g. India, Mall et al., 2016) or drought (e.g. Australia, Inman-Bamber et al., 2005).
The effect of storms on yield is variable and it could directly influence crop physiology or impact crop yield through other biotic and abiotic pressure. As an example, Gilbert et al. 2008 showed that long-term flooding in Florida causes prolonged anoxia in the root zone leading to reductions of 10– 78% in sugarcane leaf nutrient concentration, as well as leaf area index (LAI) decrease. Additionally, Beuzelin et al. (2009) highlighted how the increase in pest severity after a storm in Louisiana was a crucial factor explaining low yield values. Extreme winds can also directly impact crop losses through stalk growth termination (Moore et al., 1984).
Whatever the cause (cane physiology or breakage), opening the canopy can have drastic consequences when multiple storms can occur, such as in Reunion Island. In particular, these conditions promote soil erosion and weed development. The pouring of the canes allows light to reach the ground which favours the emergence of weeds and the recovery of plants kept under cover, such as vines (climbing weed or vine weed). These infested areas are therefore difficult to weed because they are not easily spotted and are inaccessible due to the mass of vegetation.
Considering that climate change is likely to increase extreme events occurrence (Cai et al., 2015), there is need to adapt cultural practice to reduce sugarcane sensitivity to storm. A first possibility already highlighted in 1940s by Hebert and Arcenaux (1940) is the use of wind-resistant clones. In their study in Louisiana, field survey showed large difference of broken cane (varying from 0.5 to 21% of total cane) depending of cultivars. Secondly, management practices should be promoted to limit soil erosion and weed pressure after storms. For example, the use of cover crops to limit erosions (Perret et al., 1996, Normand 1998) or improve weed control (Christina et al., pre-print) has been investigated in Reunion island and other sugarcane countries, but it could only be used at the
beginning of the sugarcane crop cycle (three months before canopy closure). Another possibility is to promote the conservation of straw mulch in the field. In a review, conservation of straw has been shown to considerably reduce soil erosions and weed pressure, particularly when the amount of straw is superior to 8 t ha-1 (Carvalho et al., 2017). Finally, one could expect a potential increase in fertilizer
leaching and runoff after storms. Not surprisingly, nitrogen loss through runoff or leaching showed high variations depending on location, climate and fertiliser rate (Thornburn et al., 2011) and tend to increase with higher rainfall (Reading et al., 2019). In comparison, the relation between extreme rainfall events and fertilizer loss remained poorly investigated, probably because famers naturally avoid fertilizing during periods of climatic risk.
Increasing extreme weather events worldwide are an immediate threat to global crop production (Meehl et al., 2000; Rosenzweig e tal., 2001; Olesen et al., 2007; Urban et al., 2012; Min et al., 2011; Lobell et al., 2008, 2013). Promoting crop management to make agrosystems more resilient to climatic hazards is a topical issue in the tropics.
5. Conclusion
In average, average total yield gap over Reunion Island was predicted as 96 t ha-1, of which 66% was due to water deficit. This yield gap increased up to 120 t ha-1 with increasing thermoradiative and water source availability, highlighting the influence of others biotic and abiotic limiting factors. The use of extreme climate indices allows us to assess the impact of tropical cyclones and storm on yield gap and yield loss. In average, yield loss was around 19 t ha-1 in the zone and years with the highest precipitation and wind speed events, but this loss could reach 28 t ha-1. Considering the considerable
economic damage implied by yield loss under extreme events, there is a need to adapt cultural practice to frequent storms in tropical areas, particularly in the context of climate change.
Acknowledgements
This study was funded by the FEADER (Fonds européen agricole pour le développement rural) and the FEDER 2014-2020 program (Fonds européen de développement régional). We are thankful to the Direction de l’Alimentation, de l’Agriculture et de la Forêt (DAAF) and the Centre Technique Interprofessionnel de la Canne et du Sucre (CTICS) for sharing the data.
References
Versini Antoine, Bravin Matthieu, Ramos Marion, Albrecht Alain, Todoroff Pierre, Collinet Marion, Thuriès Laurent. 2018. SERDAF, a soil-specific nutrient management expert system for sugarcane fertilization in Reunion Island. In : Proceedings Side Event "Nutrient Management and Decision-Support Systems". INRA, Agrocampus Ouest. Rennes : INRA, 24-25. Side Event of the 20th Nitrogren Workshop: Nutrient Management and Decision-Support Systems, Rennes, France, 27 Juin 2018/27 Juin 2018.
Supplementary Material S1 – Cane management data in Reunion Island
Fig. S1. Planted variety (a) and irrigation management (b) proportions in the 5 agro-climatic zones in Reunion Island.
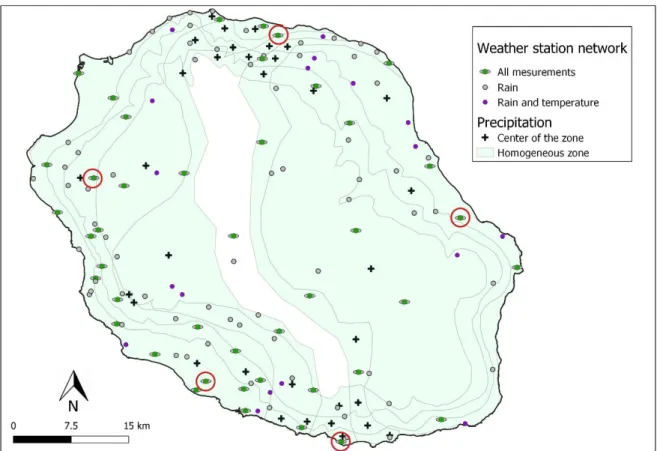
Fig S2. Location of the weather station network used to interpolate daily weather data. The stations with a red circle were used to calculate the extreme wind speed index. The black cross represent the center of each climatic zone, where weather data were interpolated.
Supplementary Material S2 – Calibration Procedures and results
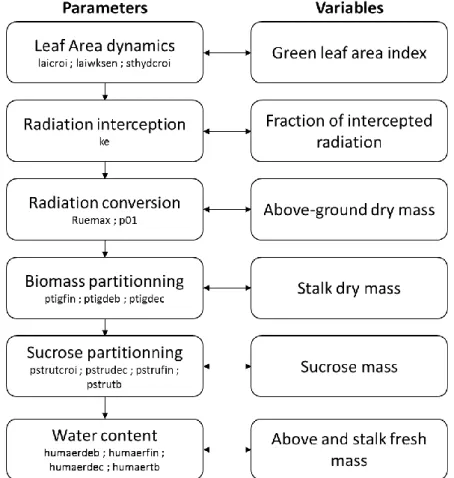
Figure S3. Schematic of calibration procedure. The boxes show the order of decreasing priority in the calibration procedure and the observed variables used of parameter estimation.
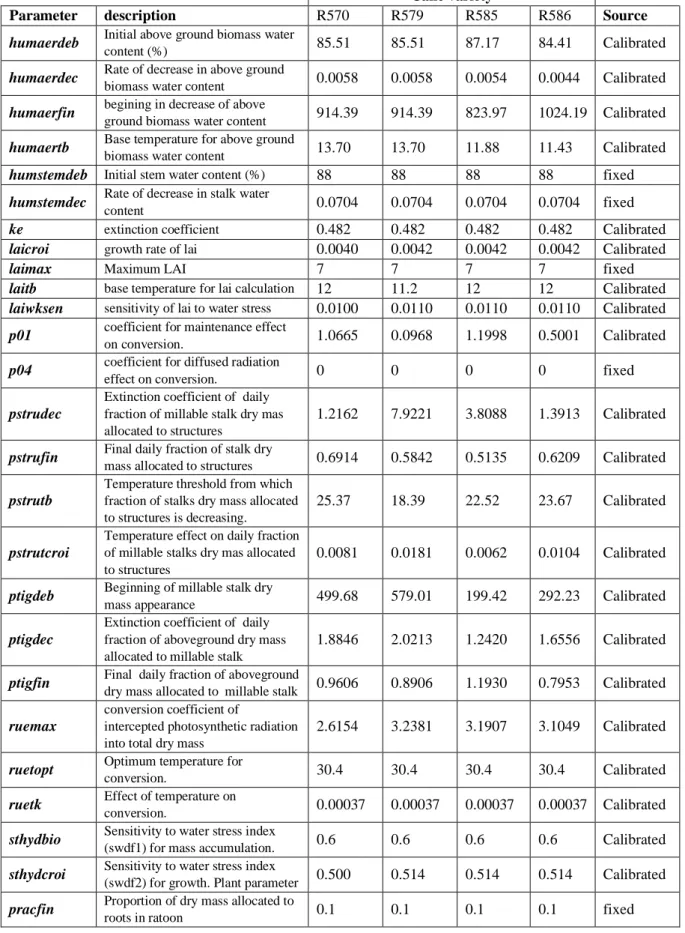
Table S1. Parameter values and description used in the MOSICAS model
Cane variety
Parameter description R570 R579 R585 R586 Source
humaerdeb Initial above ground biomass water
content (%) 85.51 85.51 87.17 84.41 Calibrated
humaerdec Rate of decrease in above ground
biomass water content 0.0058 0.0058 0.0054 0.0044 Calibrated
humaerfin begining in decrease of above
ground biomass water content 914.39 914.39 823.97 1024.19 Calibrated
humaertb Base temperature for above ground biomass water content 13.70 13.70 11.88 11.43 Calibrated
humstemdeb Initial stem water content (%) 88 88 88 88 fixed
humstemdec Rate of decrease in stalk water
content 0.0704 0.0704 0.0704 0.0704 fixed
ke extinction coefficient 0.482 0.482 0.482 0.482 Calibrated
laicroi growth rate of lai 0.0040 0.0042 0.0042 0.0042 Calibrated
laimax Maximum LAI 7 7 7 7 fixed
laitb base temperature for lai calculation 12 11.2 12 12 Calibrated
laiwksen sensitivity of lai to water stress 0.0100 0.0110 0.0110 0.0110 Calibrated
p01 coefficient for maintenance effect
on conversion. 1.0665 0.0968 1.1998 0.5001 Calibrated
p04 coefficient for diffused radiation
effect on conversion. 0 0 0 0 fixed
pstrudec
Extinction coefficient of daily fraction of millable stalk dry mas allocated to structures
1.2162 7.9221 3.8088 1.3913 Calibrated
pstrufin Final daily fraction of stalk dry
mass allocated to structures 0.6914 0.5842 0.5135 0.6209 Calibrated
pstrutb
Temperature threshold from which fraction of stalks dry mass allocated to structures is decreasing.
25.37 18.39 22.52 23.67 Calibrated
pstrutcroi
Temperature effect on daily fraction of millable stalks dry mas allocated to structures
0.0081 0.0181 0.0062 0.0104 Calibrated
ptigdeb Beginning of millable stalk dry
mass appearance 499.68 579.01 199.42 292.23 Calibrated
ptigdec
Extinction coefficient of daily fraction of aboveground dry mass allocated to millable stalk
1.8846 2.0213 1.2420 1.6556 Calibrated
ptigfin Final daily fraction of aboveground
dry mass allocated to millable stalk 0.9606 0.8906 1.1930 0.7953 Calibrated
ruemax
conversion coefficient of
intercepted photosynthetic radiation into total dry mass
2.6154 3.2381 3.1907 3.1049 Calibrated
ruetopt Optimum temperature for
conversion. 30.4 30.4 30.4 30.4 Calibrated
ruetk Effect of temperature on
conversion. 0.00037 0.00037 0.00037 0.00037 Calibrated
sthydbio Sensitivity to water stress index
(swdf1) for mass accumulation. 0.6 0.6 0.6 0.6 Calibrated
sthydcroi Sensitivity to water stress index
(swdf2) for growth. Plant parameter 0.500 0.514 0.514 0.514 Calibrated
pracfin Proportion of dry mass allocated to
Fig. S4. MOSICAS calibration of 4 cane varieties using the ECOFI database. The model was calibrated using leaf area index, sugar yield, aboveground dry and fresh mass, stalk dry and fresh mass and aboveground and stalk water content.
Supplementary Material S3 – Description of cane growth main equations in MOSICAS model
• LAI calculation
In the daily time step mosicas model, the leaf area index (𝐿𝐴𝐼𝑑) for a given day 𝑑 is a variable that
grows as a function of temperature, water stress and intra-specific competition. The daily growth in lai (𝑔𝑙𝑎𝑖) is computed as follow:
𝑔𝑙𝑎𝑖 = 𝑙𝑎𝑖𝑐𝑟𝑜𝑖𝑃∗ 𝐿𝐴𝐼𝑑−1∗ (1 − 𝐿𝐴𝐼𝑑−1
𝑙𝑎𝑖𝑚𝑎𝑥𝑝) ∗ 𝑇𝐿𝐴𝐼 ∗ 𝑠𝑤𝑑𝑓𝐿𝐴𝐼
Where 𝑙𝑎𝑖𝑐𝑟𝑜𝑖𝑝 is a plant parameter, 𝐿𝐴𝐼𝑑−1, the 𝐿𝐴𝐼 of the previous day, 𝑙𝑎𝑖𝑚𝑎𝑥𝑝 the maximum
leaf area and is a plant parameter, 𝑠𝑤𝑑𝑓𝐿𝐴𝐼 the soil water deficit factor for 𝐿𝐴𝐼𝑑. 𝑇𝐿𝐴𝐼 is the accumulated thermal energy during the day and is defined as:
𝑇𝐿𝐴𝐼 = 𝑇𝑚𝑎𝑥𝑑− 𝑇𝑚𝑖𝑛𝑑
2 − 𝑙𝑎𝑖𝑡𝑏𝑝
Where 𝑇𝑚𝑎𝑥𝑑 and 𝑇𝑚𝑖𝑛𝑑 are the maximum and minimum daily temperature, and 𝑙𝑎𝑖𝑡𝑏𝑝 is a plant
parameter and represents the base temperature for growth in 𝐿𝐴𝐼𝑑. The leaf mortality due to water stress (𝑠𝑙𝑎𝑖) is calculated as follows:
𝑠𝑙𝑎𝑖 = 𝑙𝑎𝑖𝑤𝑘𝑠𝑒𝑛𝑝∗ (1 − 𝑠𝑤𝑑𝑓𝐿𝐴𝐼) ∗ 𝐿𝐴𝐼𝑖−1
Where laiwksenp is a plant parameter and represents a sensitivity to water stress.
Finally, 𝐿𝐴𝐼𝑑 is calculated as:
𝐿𝐴𝐼𝑑 = 𝐿𝐴𝐼𝑑−1+ 𝑔𝑙𝑎𝑖 + 𝑠𝑙𝑎𝑖
• Intercepted radiation
The daily photosynthetic active radiation intercepted by the canopy (𝑝𝑎𝑟𝑖) is calculated based on the bear-lamber law:
𝑝𝑎𝑟𝑖 = 0.5 ∗ 𝑅𝑔 ∗ (1 − 𝑒−𝑘𝑒𝑝∗𝐿𝐴𝐼𝑑) ∗ (1 − 𝑝04
𝑝∗ (
𝑅𝑔
𝑅𝑒− 0.75))
Where 𝑅𝑔 is the daily global incident radiation and 𝑘𝑒𝑝, a plant parameter defining the extinction coefficient, 𝑝04𝑝, a plant parameter that takes into account the diffuse radiation effect and 𝑅𝑒, the global extraterrestrial radiation.
• Radiation conversion into dry mass
The total dry mass (𝑑𝑚𝑡𝑑) at a given day 𝑑 is calculated as the sum of the total dry mass of the previous day and the daily growth in dry mass (𝑔𝑑𝑚𝑡). The daily 𝑔𝑑𝑚𝑡 is calculated as:
𝑔𝑑𝑚𝑡 = 𝑟𝑢𝑒𝑚𝑎𝑥𝑝∗ 𝑝𝑎𝑟𝑖 ∗ 𝑠𝑤𝑑𝑓𝑟𝑢𝑒∗ 𝑘𝑎𝑔𝑒∗ 𝑘𝑇 And:
Where 𝑟𝑢𝑒𝑚𝑎𝑥𝑝is the maximum radiation use efficiency, 𝑠𝑤𝑑𝑓𝑟𝑢𝑒, the soil water deficit factor for radiation use, and 𝑘𝑎𝑔𝑒 and 𝑘𝑇 some parameter defining the effect of maintenance respiration and temperature, respectively.
The effect of temperature on radiation conversion is defined as: 𝑘𝑇 = 1 − 𝑟𝑢𝑒𝑡𝑘𝑝∗ √|𝑇𝑑𝑖𝑢 − 𝑟𝑢𝑒𝑜𝑝𝑡𝑝|
Where 𝑟𝑢𝑒𝑜𝑝𝑡𝑝and 𝑟𝑢𝑒𝑡𝑘𝑝 are plant parameters that define the optimal temperature for radiation use efficiency and a parameter used in the response of this efficiency to temperature, respectively. 𝑇𝑑𝑖𝑢 defines the average temperature during daylight:
𝑇𝑑𝑖𝑢 = 0.25 𝑇𝑚𝑖𝑛 + 0.75 𝑇𝑚𝑎𝑥
The effect of maintenance respiration is calculating based on the total dry mass (𝑑𝑚𝑡𝑑)
𝑘𝑎𝑔𝑒 = 1 − (𝑑𝑚𝑡𝑑∗𝑝01𝑝 104 )
3
Where 𝑝01𝑝 is a plant parameter to take into account maintenance respiration
• Dry mass partitioning
The daily total dry mass accumulated (𝑔𝑑𝑚𝑡) is firstly allocated to aerial part vs roots. In case of plant crop, the dry mass allocated to roots (𝑘𝑟𝑎𝑐) decreases with thermal time:
𝑘𝑟𝑎𝑐 = 𝑝𝑟𝑎𝑐𝑑𝑒𝑏𝑝− 𝑝𝑟𝑎𝑐𝑑𝑒𝑐𝑝∗ 𝑠𝑑𝑑 And
𝑘𝑟𝑎𝑐 = min (𝑘𝑟𝑎𝑐, 𝑝𝑟𝑎𝑐𝑓𝑖𝑛𝑝)
Where 𝑝𝑟𝑎𝑐𝑑𝑒𝑏𝑝, 𝑝𝑟𝑎𝑐𝑑𝑒𝑐𝑝 and𝑝𝑟𝑎𝑐𝑓𝑖𝑛𝑝 are plant parameters (Table S1), and 𝑠𝑑𝑑 is the sum of
degree days since planting (base temperature = 0°C).
In case of ratoon crop, the dry mass allocated to roots is assumed constant and equal to 𝑝𝑟𝑎𝑐𝑓𝑖𝑛𝑝. Consequently, the aerial dry mass (𝑑𝑚𝑎𝑒𝑟𝑑) and daily dry mass allocated to aerial parts are equal to:
𝑑𝑚𝑎𝑒𝑟𝑑 = 𝑑𝑚𝑎𝑒𝑟𝑑−1+ 𝑔𝑑𝑚𝑎𝑒𝑟 And
𝑔𝑑𝑚𝑎𝑒𝑟 = 𝑔𝑑𝑚𝑡 ∗ (1 − 𝑘𝑟𝑎𝑐)
The aboveground dry mass is partitioned into millable stalk dry mass (𝑑𝑚𝑠𝑡𝑚𝑑), as follows: 𝑑𝑚𝑠𝑡𝑚𝑑 = 𝑑𝑚𝑠𝑡𝑚𝑑−1+ 𝑔𝑑𝑚𝑠𝑡𝑚
𝑔𝑑𝑚𝑠𝑡𝑚 = 𝑔𝑑𝑚𝑎𝑒𝑟 ∗ 𝑝𝑠𝑡𝑒𝑚𝑓𝑖𝑛𝑝∗ (1 − 𝑒−
𝑝𝑠𝑡𝑒𝑚𝑑𝑒𝑐𝑝
Where 𝑝𝑠𝑡𝑒𝑚𝑓𝑖𝑛𝑝, 𝑝𝑠𝑡𝑒𝑚𝑑𝑒𝑐𝑝and 𝑝𝑠𝑡𝑒𝑚𝑑𝑒𝑏𝑝 are plant parameters (Table S1).
The model also simulated the sucrose accumulation into the stalk as well as aboveground water content but these processes were not used into this study.
• Cane yield: fresh cane mass
Finally, the fresh stalk mass (𝑓𝑚𝑠𝑡𝑚) and the stalk humidity are calculated as follows:
𝑓𝑚𝑠𝑡𝑚 = 𝑑𝑚𝑠𝑡𝑚
100 − ℎ𝑢𝑚𝑠𝑡𝑚
ℎ𝑢𝑚𝑠𝑡𝑚 = ℎ𝑢𝑚𝑠𝑡𝑒𝑚𝑑𝑒𝑏𝑝− ℎ𝑢𝑚𝑠𝑡𝑒𝑚𝑑𝑒𝑐𝑝∗ 𝑑𝑎𝑠
Where 𝑑𝑎𝑠 is the number of day since stalk appearance, and ℎ𝑢𝑚𝑠𝑡𝑒𝑚𝑑𝑒𝑏𝑝 and ℎ𝑢𝑚𝑠𝑡𝑒𝑚𝑑𝑒𝑐𝑝 are plant parameters (Table S1).
The stalk appearance is defined as the day when the aboveground dry mass reached a value higher than 𝑝𝑠𝑡𝑒𝑚𝑑𝑒𝑏𝑝.
• Water stress index
Simulation of the soil water balance relies on a CERES type water module, including soil evaporation, soil drainage, plant evaporation and rainfall infiltration. The detailed of these equations can be found in the source code of MOSICAS (https://github.com/ChristinaMathias/MOSICAS). Two soil water deficit factors are calculated for 𝐿𝐴𝐼𝑑 growth (𝑠𝑤𝑑𝑓𝐿𝐴𝐼) and radiation conversion into dry mass
(𝑠𝑤𝑑𝑓𝐷𝑀): 𝑠𝑤𝑑𝑓𝐿𝐴𝐼 = ( 𝑠𝑤𝑑 0.94 − 0.25 ∗𝑝𝑠𝑖𝑙𝑏𝑡𝑚𝑝 ) sthydbio𝑝 𝑠𝑤𝑑𝑓𝐷𝑀 = ( 𝑠𝑤𝑑 1.25 (0.94 − 0.25 ∗𝑝𝑠𝑖𝑙𝑏𝑡𝑚𝑝 ) ) sthydcroi𝑝
Where 𝑝𝑠𝑖𝑙𝑏 is a pression parameter defined as 8 according to Brisson 1992 and Slabber 1982, 𝑡𝑚𝑝 the maximum transpiration of the day according to actual canopy, sthydbiop and sthydcroip are plant
parameters defining the sensitivity to water stress. 𝑠𝑤𝑑 is the soil water deficit and calculated as follows:
𝑠𝑤𝑑 = 𝑆𝑊𝐶
𝐹𝐶 − 𝑊𝑃
And 𝑡𝑚𝑝 the maximum transpiration of the day is calculated as follows:
𝑡𝑚𝑝 = 𝐸𝑇𝑃 ∗ Kmaxp∗ √min (1,𝐿𝐴𝐼𝑑 3 )
Where 𝐸𝑃𝑇 is the daily potential evapotranspiration (mm) and Kmaxp the maximum crop coefficient
Supplementary Material S4 – Complementary results
Fig S5. Average total yield gap (YGT) and yield gap due to water-deficit (YGW) per agro-climatic
zone in Reunion Island from 1998 to 2018.
Fig S6. Field scale yield gap due to water deficit (YGW) in irrigated and rainfed fields depending on
Fig S7. Field scale yield gap due to water deficit (YGW) in irrigated and rainfed fields depending on
soil water holding capacity.
Fig S8. Change in proportion of precipitation loss (drainage / precipitation) at the field scale depending on altitude (black point). A polynomial smooth regression over altitude was added (line) with standard deviation (transparent blue).