3D molecular MR imaging of liver fibrosis and response
to rapamycin therapy in a bile duct ligation rat model
The MIT Faculty has made this article openly available.
Please share
how this access benefits you. Your story matters.
Citation
Farrar, Christian T., DePeralta, Danielle K.; Day, Helen; et al. “3D
Molecular MR Imaging of Liver Fibrosis and Response to Rapamycin
Therapy in a Bile Duct Ligation Rat Model.” Journal of Hepatology
63, no. 3 (September 2015): 689–696. © 2015 European Association
for the Study of the Liver.
As Published
http://dx.doi.org/10.1016/j.jhep.2015.04.029
Publisher
Elsevier
Version
Author's final manuscript
Citable link
http://hdl.handle.net/1721.1/108004
Terms of Use
Creative Commons Attribution-NonCommercial-NoDerivs License
3D molecular MR imaging of liver fibrosis and response to
rapamycin therapy in a bile duct ligation rat model
Christian T. Farrar1,†, Danielle K. DePeralta2,†, Helen Day1, Tyson A. Rietz1, Lan Wei2,
Gregory Y. Lauwers3, Boris Keil1, Arun Subramaniam4, Anthony J. Sinskey5, Kenneth K.
Tanabe2, Bryan C. Fuchs2,*, and Peter Caravan1,*
1Athinoula A. Martinos Center for Biomedical Imaging, Department of Radiology, Massachusetts General Hospital and Harvard Medical School, 149 Thirteenth St., Suite 2301, Charlestown, MA 02129, United States
2Surgical Oncology, Massachusetts General Hospital Cancer Center and Harvard Medical School, WRN 401, 55 Fruit St., Boston, MA 02114, United States
3Pathology, Massachusetts General Hospital and Harvard Medical School, WRN 2, 55 Fruit St., Boston, MA 02114, United States
4Sanofi Genzyme, 49 New York Ave, Framingham, MA 01701, United States
5Department of Biology, Massachusetts Institute of Technology, 77 Massachusetts Ave., Cambridge, MA 02139, United States
Abstract
Background & Aims—Liver biopsy, the gold standard for assessing liver fibrosis, suffers from limitations due to sampling error and invasiveness. There is therefore a critical need for methods to non-invasively quantify fibrosis throughout the entire liver. The goal of this study was to use molecular Magnetic Resonance Imaging (MRI) of Type I collagen to non-invasively image liver fibrosis and assess response to rapamycin therapy.
Methods—Liver fibrosis was induced in rats by bile duct ligation (BDL). MRI was performed 4, 10, or 18 days following BDL. Some BDL rats were treated daily with rapamcyin starting on day 4 and imaged on day 18. A three-dimensional (3D) inversion recovery MRI sequence was used to
* Corresponding authors: Tel: + 1 617 643 0193; fax: + 1 617 726 2422. caravan@nmr.mgh.harvard.edu (P. Caravan) or Tel: + 1 617
726 4174; fax: 617-726-4442. bfuchs@mgh.harvard.edu (B.C. Fuchs).. †These authors contributed equally to this work.
Publisher's Disclaimer: This is a PDF file of an unedited manuscript that has been accepted for publication. As a service to our
customers we are providing this early version of the manuscript. The manuscript will undergo copyediting, typesetting, and review of the resulting proof before it is published in its final citable form. Please note that during the production process errors may be discovered which could affect the content, and all legal disclaimers that apply to the journal pertain.
Conflict of Interest: P.C. has >5% equity in Collagen Medical, LLC, a company working to commercialize the MRI probe used in
this study. B.C.F. is a paid consultant for Collagen Medical, LLC. A.S. is an employee of Sanofi. All other authors have no conflicts of interest.
Author’s contributions: Study concept and design: C.T.F., D.K.D, A.S., B.C.F., P.C.; Acquisition of data: C.T.F., D.K.D., H.D.,
T.A.R., L.W., G.Y.L.. B.C.F., P.C.; analysis and interpretation of data: C.T.F., D.K.D., G.Y.L., K.K.T., B.C.F., P.C.; drafting of the manuscript: C.T.F., D.K.D., K.K.T., B.C.F., P.CP.; critical revision of the manuscript for important intellectual content: C.T.F.,
HHS Public Access
Author manuscript
J Hepatol. Author manuscript; available in PMC 2016 September 01. Published in final edited form as:
J Hepatol. 2015 September ; 63(3): 689–696. doi:10.1016/j.jhep.2015.04.029.
Author Manuscript
Author Manuscript
Author Manuscript
quantify the change in liver longitudinal relaxation rate (ΔR1) induced by the collagen-targeted probe EP-3533. Liver tissue was subjected to pathologic scoring of fibrosis and analyzed for Sirius Red staining and hydroxyproline content.
Results—ΔR1 increased significantly with time following BDL compared to controls in agreement with ex vivo measures of increasing fibrosis. Receiver operating characteristic curve analysis demonstrated the ability of ΔR1 to detect liver fibrosis and distinguish intermediate and late stages of fibrosis. EP-3533 MRI correctly characterized the response to rapamycin in 11 out of 12 treated rats compared to the standard of collagen proportional area (CPA). 3D MRI enabled characterization of disease heterogeneity throughout the whole liver.
Conclusions—EP-3533 allowed for staging of liver fibrosis, assessment of response to rapamycin therapy, and demonstrated the ability to detect heterogeneity in liver fibrosis.
Keywords
Liver fibrosis; Type I collagen; Molecular imaging; Non-invasive; MRI; EP-3533; Bile duct ligation (BDL)
Introduction
Chronic liver disease is a major cause of morbidity and mortality worldwide, and unlike other major causes of mortality, rates of chronic liver disease are increasing rather than declining [1]. Chronic liver disease results from a wide range of etiological factors including viral hepatitis, metabolic dysfunction, alcohol abuse and autoimmune disease. Liver fibrosis is the common result of virtually all chronic liver injuries [2]. During fibrosis, the ongoing cycles of injury and repair lead to accumulation of extracellular matrix (ECM) components rich in fibrillar collagen, and eventually disruption of normal tissue architecture and function [3]. If the underlying cause of disease is suppressed or removed early enough, liver fibrosis has the potential to regress to a lesser stage or even reverse to a normal architecture [4, 5]. However, if left unchecked, fibrosis will progress to cirrhosis, an advanced stage of the disease estimated to affect 1-2% of the world’s population [6, 7]. Accurate assessment of fibrosis stage and early detection of cirrhosis are therefore vital for determining prognosis and guiding management, since doing so identifies those patients at greatest risk of developing complications of cirrhosis for which longitudinal survey is essential.
Biopsy is an imperfect gold standard in assessing liver fibrosis as it suffers from intra/inter-observer variability and is associated with several complications including hospitalization in 1-5% cases and mortality in 0.01-0.1% of cases [8, 9]. In addition, sampling error is a major issue as the 1-2 pieces of 1 cm long liver biopsies only assess 1/50,000 of the liver volume [10]. Importantly, repeated biopsies to evaluate disease progression or response to treatment are impractical due to the increased risk of complications and poor patient compliance. For all of these reasons, non-invasive strategies that can repeatedly assess liver fibrosis throughout the entire organ are urgently needed to assess disease stage, monitor treatment response and determine prognosis.
Type I collagen is an attractive target for molecular imaging of fibrosis since collagen deposition is a common outcome regardless of fibrosis cause. Moreover, the collagen
Author Manuscript
Author Manuscript
Author Manuscript
concentration increases as fibrosis progresses and its extracellular location makes it readily accessible by the probe. We have previously reported data with a peptide-based Type I collagen-specific MR probe, termed EP-3533, for detection and quantification of fibrosis, and demonstrated its utility in cardiac, pulmonary and hepatic models of fibrosis [11-15]. In the liver, molecular imaging of collagen with EP-3533 was much more sensitive to the presence of fibrosis than other MRI measures such as water diffusion and could accurately stage liver fibrosis [14]. EP-3533 was calculated to have a blood half-life of 19±2 min in both fibrotic and control mice consistent with its extracellular distribution and primary renal clearance [14]. By 24 h, the probe was largely eliminated from the body. When tested at 10 μM in a “lead side-effect panel” of 33 different in vitro assays, EP-3533 had no measurable effect in terms of inhibiting receptor binding [14]. These pharmacokinetics, biodistribution, and in vitro pharmacology studies suggest the potential of this probe for translation to human studies.
Here, we expand upon these studies and demonstrate that EP-3533 can accurately stage biliary fibrosis in bile duct ligated (BDL) rats. While our initial studies were performed on high field small animal scanners, we now show efficacy using a 1.5-tesla clinical MRI scanner in order to further clinical translation. In addition, our previous studies quantified changes in the contrast-to-noise ratio (ΔCNR) between liver and adjacent skeletal muscle after injection of EP-3533 and were typically performed on a just a few liver image slices [11-14]. In the current work we have made fibrosis quantification more extensive by introducing a respiratory-gated three dimensional (3D) inversion recovery imaging sequence that allows us to measure the change in longitudinal relaxation rate (ΔR1) induced by EP-3533 on a pixel-wise basis throughout the entire liver. Since ΔR1 is linearly proportional to the Gadolinium concentration, it has the potential to provide a more quantitative and robust metric than ΔCNR for the assessment of fibrosis, and to measure disease heterogeneity within the liver. In order to test this, we measured fibrosis in rapamycin treated BDL rats where considerable variability was observed previously in liver fibrosis response to rapamycin [16, 17]. The rapamycin experiments therefore provided a rigorous test of the ability of EP-3533 to detect differences in disease progression and response to therapy.
Materials and Methods
Animal ModelLiver fibrosis was induced in male CD rats (n=39) by ligation of the common bile duct (Charles River Labs, Wilmington, MA). Control animals (n=8) underwent a control procedure. BDL rats were imaged 4 (n=9), 10 (n=10), or 18 (n=8) days following ligation. Rapamycin treated rats (n=12) were administered 3 mg/kg/day by oral gavage starting on day 4 and were imaged on day 18. EP-3533 was prepared as reported previously [11]. All experiments and procedures were performed in accordance with the NIH Guide for the Care and Use of Laboratory Animals and were approved by the Massachusetts General Hospital Institutional Animal Care and Use Committee.
Author Manuscript
Author Manuscript
Author Manuscript
Magnetic Resonance Imaging
Rats were imaged on a 1.5-tesla clinical MRI scanner (Siemens Healthcare, Malvern, PA) using a home-built, transmit-receive solenoid coil (Supplementary Fig. 1). Animals were anesthetized with 1-2% isoflurane and respiration rate was monitored with a small animal physiological monitoring system (SA Instruments, Inc., Stony Brook, NY).
Respiratorygated, 3D Inversion Recovery (IR) Fast Low Angle Shot (FLASH) images were acquired prior to and 1 hour following intravenous administration of 10 μmol/kg EP-3533. A non-selective inversion pulse was used and images were acquired with inversion recovery times of 50, 100, 200, 250, 300, 400 and 1000 ms. Image acquisition parameters consisted of an echo time of TE = 2.44 ms, field-of-view FOV = 120×93 mm, matrix = 192×150 (0.625 mm inplane resolution), slice thickness = 0.6 mm, and 36 image slices. A segmented k-space acquisition method consisting of 51 segments was used to reduce the acquisition time. The effective repetition time was dictated by the respiration rate. Anesthesia was adjusted to maintain a respiration rate of 60±5 breaths per minute for an effective repetition time of TReff = 1000±90 ms. Following imaging, animals were sacrificed and liver tissue was
subjected to pathologic scoring of fibrosis and analyzed for hydroxyproline content. Longitudinal relaxation rate (R1) maps were generated from the images using a custom written MATLAB (Mathworks, Natick, MA) program for voxel wise fitting of the inversion recovery signal intensities as a function of the inversion recovery time.
Ex Vivo Tissue Analysis
Formalin-fixed samples were embedded in paraffin, cut into 5 μm-thick sections and stained with Sirius Red according to standard procedures. Sirius Red stained sections were analyzed by a pathologist, who was blinded to the study, to score the amount of liver disease
according to the method of Ishak [18]. In addition, the Collagen Proportional Area (CPA), as determined by the % area stained with Sirius Red, was quantified from the histology images using ImageJ as per our standard procedures [11-14]. Hydroxyproline in tissue was
quantified by high-performance liquid chromatography (HPLC) analysis of tissue acid digests as previously described [19]. Hydroxyproline is expressed as amount per wet weight of tissue.
Statistical Analysis
Data are displayed as box plots with the dark band inside the box representing the mean, the bottom and top of the box the first and third quartiles, and the whiskers the minimum and maximum values. Data are reported as the mean ± standard error. Statistical analyses (Analysis of Variance (ANOVA) and Receiver Operating Characteristic (ROC) analysis) were performed using Prism 6 (GraphPad Software, Inc, La Jolla, CA) with p<0.05 considered as significant. Differences among groups were tested with one-way ANOVA followed by the Tukey post-hoc test where appropriate.
Results
A respiratory-gated, three-dimensional (3D) inversion recovery (IR) Fast Low Angle Shot (FLASH) MRI sequence was used to generate quantitative R1 maps of the entire liver. Representative R1 maps generated from data acquired pre and 1-hour post-EP3533 are
Author Manuscript
Author Manuscript
Author Manuscript
shown in Fig. 1 for an 18 day BDL rat and a control, sham rat. A dramatic increase in R1 is observed following contrast agent injection for the BDL rat, but not the sham rat. As demonstrated by the R1 histogram plot (Fig. 1C), the fibrosis is relatively homogenous in this particular BDL rat with a standard deviation in R1 throughout the liver of only ±4% (R1 = 3.16±0.14 s−1). The use of a 3D imaging sequence allowed for the generation of 3D R1 maps of the entire liver, see for example the movie of the 3D Maximum Intensity Projection (MIP) R1 map shown in Supplementary Fig. 2.
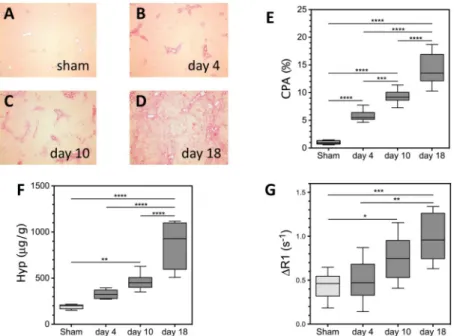
Liver fibrosis and disease progression in the BDL rat model was characterized by the Collagen Proportional Area (CPA) of histological tissue sections (Fig. 2A-D) and HPLC analysis of hydroxyproline content. CPA increased progressively at each time point from 0.98±0.11% for sham rats, 5.83±0.32% for day 4 BDL rats, 9.33±0.19% for day 10 BDL rats, to 14.02±1.02% for day 18 BDL rats (Fig. 2E). Statistically significant differences in CPA were observed between sham and day 4, 10 and 18 BDL animals (p<0.0001 all time points). Statistically significant differences were also observed between day 4 and day 10 BDL animals (p=0.0002), between day 4 and day 18 BDL animals (p<0.0001), and between day 10 and day 18 BDL animals (p<0.0001). Hydroxyproline content also increased progressively with time from 191±9 μg/g for sham rats, 327±16 μg/g for day 4 BDL rats, 462±35 μg/g for day 10 rats, to 869±89 μg/g for day 18 rats (Fig. 2F). Statistically
significant differences in hydroxyproline content were observed between sham and day 10 BDL animals (p=0.001), between sham and day 18 BDL animals (p<0.0001), between day 4 and day 10 BDL animals (p<0.0001), and between day 10 and day 18 BDL animals
(p<0.0001). Similarly, the average liver ΔR1 increased progressively with time from 0.44±0.05 s−1 for sham rats, 0.51±0.08 s−1 for day 4 BDL rats, 0.75±0.09 s−1 for day 10 rats, to 0.98±0.10 s−1 for day 18 rats (Fig. 2G). Statistically significant differences in ΔR1 were observed between sham and day 10 BDL animals (p=0.048), between sham and day 18 BDL animals (p=0.0003), and between day 4 and day 18 BDL animals (p=0.0013).
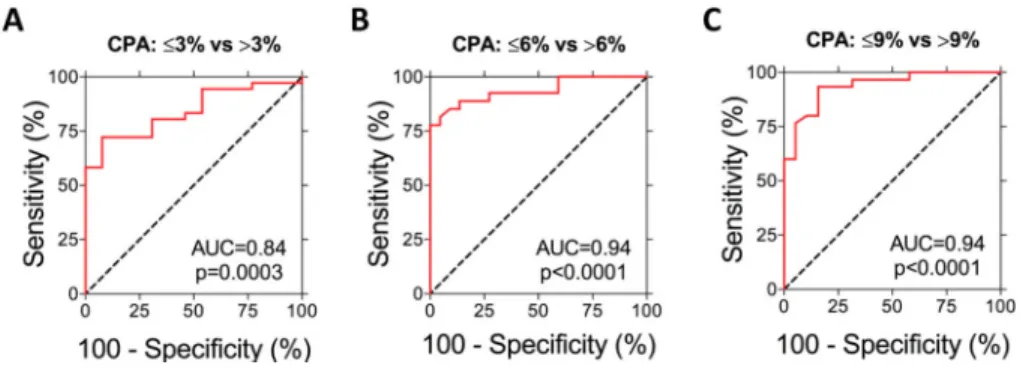
To assess the ability of ΔR1 to stage liver fibrosis, a receiver-operating characteristic (ROC) analysis was performed comparing ΔR1 of rats with different CPA (Fig. 3). Previous work has indicated that a CPA cutoff value of 9% was optimal for distinguishing significant from severe fibrosis and a cutoff value of 6% was optimal for distinguishing early from
significant fibrosis [20]. This is in good agreement with our studies where the CPA in rats with Ishak ≤1 ranged from 0.5-3%, Ishak ≤3 ranged from 0.5-6%, and Ishak ≤4 ranged from 0.5-9%. The area under the ROC curve for detecting fibrosis (CPA ≤ 3% versus CPA >3%) was 0.84±0.06 (95% CI 0.73-0.95, p=0.0003). The area under the ROC curve for
distinguishing early (CPA ≤6%) from significant fibrosis (CPA >6%) was 0.94±0.03 (95% CI 0.87-1.00, p<0.0001). Finally, the ability of ΔR1 to distinguish significant (CPA ≤9%) from severe (CPA >9%) fibrosis stages was analyzed and the area under the ROC curve was 0.94±0.03 (95% CI 0.87-1.00, p<0.0001). Similar results were obtained for the ROC analysis performed comparing ΔR1 of rats with different Ishak scores (Supplementary Fig. 3), however, in agreement with other studies [20], CPA classification provided higher sensitivity and specificity than the Ishak classification.
To assess whether the MRI readout ΔR1 would be sensitive to reporting changes in disease in response to therapy, we next investigated the response of BDL rats to rapamycin therapy.
Author Manuscript
Author Manuscript
Author Manuscript
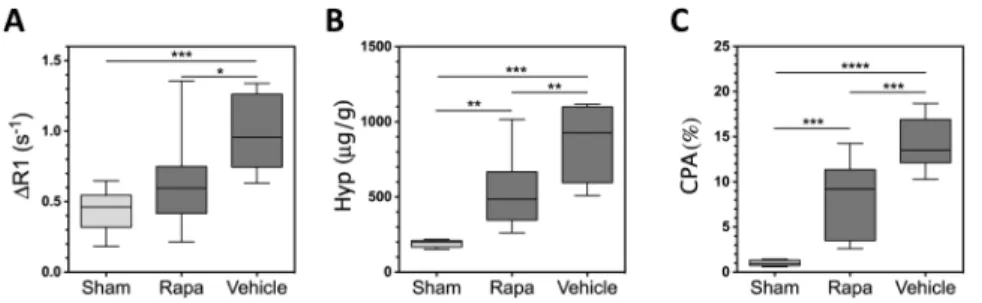
While there are no FDA-approved therapies for hepatic fibrosis, previous studies have demonstrated that rapamycin is effective in reducing fibrosis in BDL rat models of liver fibrosis [16, 17, 21, 22], however, significant variability in response has been observed [16, 17]. As responses should also vary in upcoming clinical trials of anti-fibrotic therapies, we reasoned that this should be an excellent model to determine whether EP-3533 could accurately assess diminished fibrosis in response to treatment. Rapamycin treated rats were dosed once per day with rapamycin starting on day 4 and imaged on day 18. As shown in Fig. 4, a significantly (p=0.0185) decreased ΔR1 was observed for rapamycin treated rats (0.64±0.09 s−1) relative to untreated BDL rats (0.98±0.10 s−1). Similarly, significantly (p=0.0013) decreased hydroxyproline content (519±59 μg/g, p=0.0013) and significantly (p=0.0007) decreased CPA (7.84±1.17%, p=0.0007) were observed relative to untreated BDL animals (869±89 μg/g and 14.02±1.02%, respectively).
As expected, there were relatively large standard deviations for the various fibrosis biomarkers indicating that there was in fact substantial variability among these outbred rats in their response to rapamycin therapy. This was born out by pathological analysis where the Ishak scores for the rapamycin treated rats ranged from 1 to 6 and the CPA ranged from 2.6-14.3%. At day 18, all untreated BDL rats had CPA > 9% (range of 10.3-18.7%). Therefore, we defined rats that responded to rapamycin treatment as CPA ≤9% (N=6) and non-responders as CPA >9% (N=6). ΔR1 maps and Sirius Red images are shown in Fig. 5 for representative rapamycin responder and non-responder rats. Box plots of CPA demonstrated good separation between responder (3.87±0.55%) and non-responder (11.58±0.86%) groups with statistically significant differences between untreated animals (14.02±1.02%) and rapamycin responders (p<0.0001) and between rapamycin responders and non-responders (p<0.0001). Similarly, box plots of ΔR1 (Fig. 5G) showed a significant difference (p=0.03) between rapamycin responder (0.44±0.06 s−1) and non-responder (0.83±0.11 s−1) groups and between untreated animals (0.98±0.10 s−1) and rapamycin responders (p=0.0009). No statistically significant difference, however, was observed between rapamycin non-responder and untreated animals (p=0.61). Finally, as shown in Fig. 5H, a statistically significant difference (p=0.0005) was observed in the hydroxyproline content between rapamycin responder (398±44 μg/g) and untreated animals (869±89 μg/g). Using the disease progression ROC analysis data from Fig. 3, we set a sensitivity of 90% to define the cutoff ΔR1 value (0.71 s−1) to distinguish rats with CPA >9% from CPA ≤9%, that is to distinguish non-responders from responders. Using this criterion, we found that the ΔR1 value correctly predicted rapamycin response in 11 out of 12 rats compared to the CPA standard. The MRI analysis produced only one false negative.
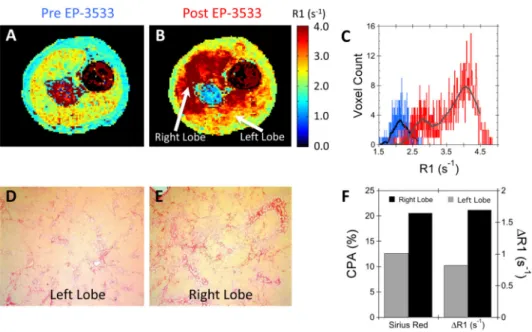
While most rats demonstrated relatively homogeneous R1 throughout the liver (see Fig. 1), one of the rapamycin non-responder rats displayed marked heterogeneity in liver fibrosis. Representative R1 maps acquired pre- and post EP-3533 are shown in Fig. 6 along with the associated R1 histogram plot showing pixelwise R1 values throughout the entire liver. While the baseline liver R1 map is relatively homogeneous, the post EP-3533 R1 map shows high uptake of probe in the right liver lobe, but a much lower uptake in the left lobe. This is readily apparent in the R1 histogram, which shows a bimodal distribution of R1 values (Fig. 6C). In particular, an elevated ΔR1 is observed in the right liver lobe (ΔR1 = 1.69 s−1)
Author Manuscript
Author Manuscript
Author Manuscript
compared to the left liver lobe (ΔR1 = 0.80 s−1), Fig. 6F. This fibrosis heterogeneity was confirmed by histology where an elevated CPA was observed for the right liver lobe (20.6%) compared to the left liver lobe (12.6%), Fig. 6F. The heterogeneity in the liver fibrosis can be appreciated in the 2D orthogonal multi-planar reconstruction of the post-EP-3533 R1 map shown in Fig. 7.
Discussion
Biopsy is an imperfect gold standard in assessing liver fibrosis as it suffers from limitations including intra/inter-observer variability and sampling error as well as complications including morbidity and mortality. The clinical need for accurate, non-invasive alternatives to liver biopsy is further driven by the growing burden of chronic liver disease worldwide. Unfortunately, conventional imaging is also not able to detect fibrosis at a mild or moderate stage [10]. However, transient elastography (Fibroscan), which measures liver stiffness, has shown promise for the noninvasive staging of fibrosis [23, 24], but still only measures 1/500 of the liver volume [10].
While great strides in molecular imaging have been made for oncology, neurology and cardiovascular disease [25], efforts in the liver and for organ fibrosis have been lacking. Here, we take a rationally designed, molecular imaging approach to detect, quantify and monitor both disease progression and response to therapy non-invasively and throughout the entire liver using MRI and the Type I collagen specific contrast agent EP-3533. Our results demonstrate that the change in longitudinal relaxation rate (ΔR1) induced by EP-3533 was sensitive to changes in fibrosis during disease progression and can be used to distinguish early, intermediate and late stages of fibrosis. AUROC analysis indicated that EP-3533 was very effective in distinguishing early and significant fibrosis (CPA≤9%) from severe disease (CPA >9%) in this model and comparable to what we observed previously in a mouse CCL4
model of fibrosis (AUROC = 0.94 vs. 0.94, respectively). On the other hand, distinguishing early fibrosis (CPA ≤3% vs. CPA >3%) was less effective in this model compared to the CCL4 model (AUROC = 0.84 vs. 0.93, respectively). These differences could be attributed
to several factors. First, it is possible that EP-3533 is more sensitive to the parenchymal fibrosis induced by CCl4-injury as opposed to the biliary fibrosis in response to BDL.
Second, along those same lines, the CPA scoring used here for comparison should itself be more accurate in assessing parenchymal fibrosis as opposed to biliary fibrosis. Alternately, the higher resolution achievable on the small animal scanner used for the CCL4 study may
result in improved sensitivity. Regardless, we could accurately stage biliary fibrosis in this study, especially more severe disease, and expect that our results will be even better when imaging patients on a clinical scanner.
There are preclinical and clinical trials of a number of anti-fibrotic therapies that interrupt several steps in the fibrotic pathway [26-30], but a major obstacle to their drug development has been a slow progression of the disease in humans, coupled with a lack of sensitive and non-invasive means to assess fibrosis or active fibrogenesis [10]. Together, these factors create an enormous cost risk for anti-fibrotic drug development, since clinical trials require large patient populations treated for long periods of time to reach a clinically significant endpoint. Thus, a biomarker of liver fibrosis that could accurately assess fibrogenesis early
Author Manuscript
Author Manuscript
Author Manuscript
in treatment would not only be extraordinarily useful in enabling the evaluation of much larger pools of candidate therapies in clinical trials, but also might provide the early evidence of efficacy needed to incentivize investigators and pharmaceutical sponsors to support long-term trials [31].
Here, we show that molecular imaging of collagen with EP-3533 can successfully identify decreased disease progression in BDL rats treated with rapamycin. A significantly decreased ΔR1 was observed for rapamycin treated animals compared to untreated controls (p=0.02), in good agreement with the decreased hydroxyproline content and CPA observed for rapamycin treated animals (Fig. 4). Importantly, however, we observed that response to rapamycin varied in this outbred strain of rats. Using CPA to classify responders and responders we found 6 rapamycin responder rats (CPA ≤9%) and 6 rapamycin non-responder rats (CPA >9%). Classification of non-responders and non-non-responders was also performed using the ΔR1, with ΔR1 correctly identifying response in 11 out of 12 rats (one false negative). The one discrepancy observed between ΔR1 and CPA score for assessing treatment response points to the difficulty in assessing response with biopsy where error rates as high as 33% have been reported [32]. Some of the discrepancies between ΔR1 and CPA assessments may be due to heterogeneity in liver fibrosis. Interestingly, we could detect heterogeneity within the liver of a rat that received rapamycin (Fig. 6), which not only highlights the sensitivity of our technique, but also further demonstrates the need for entire liver coverage in order to eliminate the sampling error associated with biopsy.
Recent advanced MRI methods such as magnetic resonance elastography (MRE) and MRI relaxation measurements have also demonstrated the benefit of whole liver imaging. For example, MRE has observed heterogeneous elastogram values in the liver of patients with chronic liver disease [23, 33, 34]. A recent prospective MRE study of non-alcoholic fatty liver disease subjects demonstrated similar diagnostic accuracy (AUROC) to our results [35]. However, MRE measurements may be compromised in situations where inflammation, edema, steatosis and iron-overload are present [36-39]. Similarly, the longitudinal relaxation time T1 has recently been reported to be able to stage liver fibrosis [40]. In our study, we found that while the pre-contrast T1 did increase with fibrosis (403±9 ms at day 4, 462±12 ms at day 10, and 508±26 ms at day 18), statistically significant differences in T1 were only observed between sham (T1 = 444±11 ms) and day 18 fibrotic rats (p=0.03). We obtained a more sensitive measure of fibrosis with EP-3533 molecular imaging as reflected in the greater statistical significance between the ΔR1 of sham and fibrotic animals at day 10 (p=0.048) and day 18 (p=0.0003) time points. This is consistent with our previous study in which only a relatively weak correlation (r=0.3, p=0.07) was observed between
hydroxyproline content and T1 in a CCl4 mouse model of liver fibrosis [14]. Combining the
various MRI fibrosis biomarkers should, however, provide increased diagnostic accuracy. For example, our MRI probes can be combined in the same exam with techniques currently used in liver MRI to assess pre-contrast T1 [40], fat content [41] and/or stiffness [42] and therefore provide a more comprehensive assessment of liver architecture.
In conclusion, end-stage liver disease currently accounts for one out of every forty deaths worldwide and its prognosis remains dismal even as the number of cases continues to rise. Strategies that could identify patients at high-risk for progression to cirrhosis and
Author Manuscript
Author Manuscript
Author Manuscript
hepatocellular carcinoma (HCC) and/or monitor early responses to anti-fibrotic therapy will certainly be crucial going forward not only for successful individualized management of disease activity in patients, but also to decrease the mortality associated with this disease. Molecular imaging of collagen with EP-3533 should be a useful tool in this regard and warrants further investigation in human trials.
Supplementary Material
Refer to Web version on PubMed Central for supplementary material.
Acknowledgements
This work was supported by grants from the National Cancer Institute (CA140861 (B.C.F.)), the National Institute of Biomedical Imaging and Bioengineering (EB009062 (P.C.)), and an Innovation Award from Sanofi (A.J.S and P.C.).
The National Institutes of Health (NIH) funded the underlying research reported in the study.
Financial Support: This work was supported by grants from the National Cancer Institute (CA140861 (B.C.F.)),
the National Institute of Biomedical Imaging and Bioengineering (EB009062 (P.C.)), and an Innovation Award from Sanofi (A.J.S and P.C.).
List of abbreviations
MRI magnetic resonance imaging
MRE magnetic resonance elastography
R1 longitudinal relaxation rate
T1 longitudinal relaxation time
TE echo time
TR repetition time
FLASH fast low angle shot
IR inversion recovery
MIP maximum intensity projection
MPR multi-planar reconstruction
FOV field of view
BDL bile duct ligation
ECM extra-cellular matrix
HCC hepatocellular carcinoma
ROC receiver operating characteristic
AUROC area under the receiver operating characteristic curve
3D three-dimensional CNR contrast-to-noise ratio
Author Manuscript
Author Manuscript
Author Manuscript
Author Manuscript
HPLC high performance liquid chromatography
ANOVA analysis of variance
CCl4 carbon tetrachloride
CPA collagen proportional area
References
[1]. Williams R. Global challenges in liver disease. Hepatology. 2006; 44:521–526. [PubMed: 16941687]
[2]. Friedman SL. Mechanisms of hepatic fibrogenesis. Gastroenterology. 2008; 134:1655–1669. [PubMed: 18471545]
[3]. Iredale JP. Models of liver fibrosis: exploring the dynamic nature of inflammation and repair in a solid organ. J Clin Invest. 2007; 117:539–548. [PubMed: 17332881]
[4]. Friedman SL, Bansal MB. Reversal of hepatic fibrosis -- fact or fantasy? Hepatology. 2006; 43:S82–88. [PubMed: 16447275]
[5]. Fallowfield JA, Kendall TJ, Iredale JP. Reversal of fibrosis: no longer a pipe dream? Clin Liver Dis. 2006; 10:481–497. viii. [PubMed: 17162224]
[6]. Schuppan D, Afdhal NH. Liver cirrhosis. Lancet. 2008; 371:838–851. [PubMed: 18328931] [7]. Friedman SL. Evolving challenges in hepatic fibrosis. Nat Rev Gastroenterol Hepatol. 2010;
7:425–436. [PubMed: 20585339]
[8]. Myers RP, Fong A, Shaheen AA. Utilization rates, complications and costs of percutaneous liver biopsy: a population-based study including 4275 biopsies. Liver Int. 2008; 28:705–712. [PubMed: 18433397]
[9]. Terjung B, Lemnitzer I, Dumoulin FL, Effenberger W, Brackmann HH, Sauerbruch T, et al. Bleeding complications after percutaneous liver biopsy. An analysis of risk factors. Digestion. 2003; 67:138–145. [PubMed: 12853725]
[10]. Popov Y, Schuppan D. Targeting liver fibrosis: strategies for development and validation of antifibrotic therapies. Hepatology. 2009; 50:1294–1306. [PubMed: 19711424]
[11]. Caravan P, Das B, Dumas S, Epstein FH, Helm PA, Jacques V, et al. Collagen-targeted MRI contrast agent for molecular imaging of fibrosis. Angew Chem Int Ed Engl. 2007; 46:8171–8173. [PubMed: 17893943]
[12]. Polasek M, Fuchs BC, Uppal R, Schuhle DT, Alford JK, Loving GS, et al. Molecular MR imaging of liver fibrosis: a feasibility study using rat and mouse models. J Hepatol. 2012; 57:549–555. [PubMed: 22634342]
[13]. Caravan P, Yang Y, Zachariah R, Schmitt A, Mino-Kenudson M, Chen HH, et al. Molecular magnetic resonance imaging of pulmonary fibrosis in mice. Am J Respir Cell Mol Biol. 2013; 49:1120–1126. [PubMed: 23927643]
[14]. Fuchs BC, Wang H, Yang Y, Wei L, Polasek M, Schuhle DT, et al. Molecular MRI of collagen to diagnose and stage liver fibrosis. J Hepatol. 2013; 59:992–998. [PubMed: 23838178] [15]. Helm PA, Caravan P, French BA, Jacques V, Shen L, Xu Y, et al. Postinfarction myocardial
scarring in mice: molecular MR imaging with use of a collagen-targeting contrast agent. Radiology. 2008; 247:788–796. [PubMed: 18403626]
[16]. Patsenker E, Schneider V, Ledermann M, Saegesser H, Dorn C, Hellerbrand C, et al. Potent antifibrotic activity of mTOR inhibitors sirolimus and everolimus but not of cyclosporine A and tacrolimus in experimental liver fibrosis. J Hepatol. 2011; 55:388–398. [PubMed: 21168455] [17]. Neef M, Ledermann M, Saegesser H, Schneider V, Reichen J. Low-dose oral rapamycin
treatment reduces fibrogenesis, improves liver function, and prolongs survival in rats with established liver cirrhosis. J Hepatol. 2006; 45:786–796. [PubMed: 17050028]
[18]. Ishak K, Baptista A, Bianchi L, Callea F, De Groote J, Gudat F, et al. Histological grading and staging of chronic hepatitis. J Hepatol. 1995; 22:696–699. [PubMed: 7560864]
Author Manuscript
Author Manuscript
Author Manuscript
[19]. Hutson PR, Crawford ME, Sorkness RL. Liquid chromatographic determination of hydroxyproline in tissue samples. J Chromatogr B Analyt Technol Biomed Life Sci. 2003; 791:427–430.
[20]. Calvaruso V, Burroughs AK, Standish R, Manousou P, Grillo F, Leandro G, et al. Computer-assisted image analysis of liver collagen: relationship to Ishak scoring and hepatic venous pressure gradient. Hepatology. 2009; 49:1236–1244. [PubMed: 19133646]
[21]. Bridle KR, Popa C, Morgan ML, Sobbe AL, Clouston AD, Fletcher LM, et al. Rapamycin inhibits hepatic fibrosis in rats by attenuating multiple profibrogenic pathways. Liver Transpl. 2009; 15:1315–1324. [PubMed: 19790156]
[22]. Biecker E, De Gottardi A, Neef M, Unternahrer M, Schneider V, Ledermann M, et al. Long-term treatment of bile duct-ligated rats with rapamycin (sirolimus) significantly attenuates liver fibrosis: analysis of the underlying mechanisms. Journal of Pharmacology and Experimental Therapeutics. 2005; 313:952–961. [PubMed: 15769867]
[23]. Yin M, Talwalkar JA, Glaser KJ, Manduca A, Grimm RC, Rossman PJ, et al. Assessment of hepatic fibrosis with magnetic resonance elastography. Clin Gastroenterol Hepatol. 2007; 5:1207–1213. e1202. [PubMed: 17916548]
[24]. Sandrin L, Fourquet B, Hasquenoph JM, Yon S, Fournier C, Mal F, et al. Transient elastography: a new noninvasive method for assessment of hepatic fibrosis. Ultrasound Med Biol. 2003; 29:1705–1713. [PubMed: 14698338]
[25]. Osborn EA, Jaffer FA. The year in molecular imaging. JACC Cardiovasc Imaging. 2012; 5:317– 328. [PubMed: 22421179]
[26]. Inagaki Y, Higashiyama R, Higashi K. Novel anti-fibrotic modalities for liver fibrosis: molecular targeting and regenerative medicine in fibrosis therapy. Journal of Gastroenterology and Hepatology. 2012; 27(Suppl 2):85–88. [PubMed: 22320923]
[27]. Kisseleva T, Brenner DA. Anti-fibrogenic strategies and the regression of fibrosis. Best Pract Res Clin Gastroenterol. 2011; 25:305–317. [PubMed: 21497747]
[28]. Rockey DC. Current and future anti-fibrotic therapies for chronic liver disease. Clin Liver Dis. 2008; 12:939–962. xi. [PubMed: 18984475]
[29]. Schuppan D, Pinzani M. Anti-fibrotic therapy: lost in translation? J Hepatol. 2012; 56(Suppl 1):S66–74. [PubMed: 22300467]
[30]. Friedman SL, Sheppard D, Duffield JS, Violette S. Therapy for fibrotic diseases: nearing the starting line. Sci Transl Med. 2013; 5:167sr161.
[31]. Friedman SL. Focus. J Hepatol. 2012; 57:481–483. [PubMed: 22691572]
[32]. Regev A, Berho M, Jeffers LJ, Milikowski C, Molina EG, Pyrsopoulos NT, et al. Sampling error and intraobserver variation in liver biopsy in patients with chronic HCV infection. American Journal of Gastroenterology. 2002; 97:2614–2618. [PubMed: 12385448]
[33]. Rouviere O, Yin M, Dresner MA, Rossman PJ, Burgart LJ, Fidler JL, et al. MR elastography of the liver: preliminary results. Radiology. 2006; 240:440–448. [PubMed: 16864671]
[34]. Huwart L, Sempoux C, Salameh N, Jamart J, Annet L, Sinkus R, et al. Liver fibrosis:
noninvasive assessment with MR elastography versus aspartate aminotransferase-to-platelet ratio index. Radiology. 2007; 245:458–466. [PubMed: 17940304]
[35]. Loomba R, Wolfson T, Ang B, Hooker J, Behling C, Peterson M, et al. Magnetic resonance elastography predicts advanced fibrosis in patients with nonalcoholic fatty liver disease: A prospective study. Hepatology. 2014; 60:1920–1928. [PubMed: 25103310]
[36]. Arena U, Vizzutti F, Corti G, Ambu S, Stasi C, Bresci S, et al. Acute viral hepatitis increases liver stiffness values measured by transient elastography. Hepatology. 2008; 47:380–384. [PubMed: 18095306]
[37]. Chen J, Talwalkar JA, Yin M, Glaser KJ, Sanderson SO, Ehman RL. Early detection of nonalcoholic steatohepatitis in patients with nonalcoholic fatty liver disease by using MR elastography. Radiology. 2011; 259:749–756. [PubMed: 21460032]
[38]. Taouli B, Ehman RL, Reeder SB. Advanced MRI methods for assessment of chronic liver disease. AJR Am J Roentgenol. 2009; 193:14–27. [PubMed: 19542391]
Author Manuscript
Author Manuscript
Author Manuscript
[39]. Venkatesh SK, Yin M, Ehman RL. Magnetic resonance elastography of liver: technique, analysis, and clinical applications. J Magn Reson Imaging. 2013; 37:544–555. [PubMed: 23423795]
[40]. Banerjee R, Pavlides M, Tunnicliffe EM, Piechnik SK, Sarania N, Philips R, et al.
Multiparametric magnetic resonance for the non-invasive diagnosis of liver disease. J Hepatol. 2014; 60:69–77. [PubMed: 24036007]
[41]. Reeder SB, Cruite I, Hamilton G, Sirlin CB. Quantitative assessment of liver fat with magnetic resonance imaging and spectroscopy. J Magn Reson Imaging. 2011; 34:729–749. [PubMed: 21928307]
[42]. Talwalkar JA, Yin M, Fidler JL, Sanderson SO, Kamath PS, Ehman RL. Magnetic resonance imaging of hepatic fibrosis: emerging clinical applications. Hepatology. 2008; 47:332–342. [PubMed: 18161879]
Author Manuscript
Author Manuscript
Author Manuscript
Fig. 1. Liver longitudinal relaxation rate (R1) maps
R1 maps acquired (A) pre and (B) 1-hour post EP-3533 of a representative 18-day BDL rat and (C) the associated histogram of the liver R1 values pre- (blue) and post EP-3533 (red). R1 maps acquired (D) pre and (E) 1-hour post EP-3533 of a representative sham rat and (F) the associated histogram of the liver R1 values pre- (blue) and post EP-3533 (red). Much greater R1 values were observed post EP-3533 in the liver of the 18-day BDL rat compared to the sham rat.
Author Manuscript
Author Manuscript
Author Manuscript
Fig. 2. Characterization of the Bile Duct Ligation (BDL) rat model of liver fibrosis
Representative Sirius Red histology liver images of (A) sham and BDL rats (B) 4, (C) 10, and (D) 18 days after bile duct ligation. (E) Liver fibrosis as assessed by the CPA increased progressively with time, with a significant increase relative to sham animals observed at days 4, 10 and 18 (****p<0.0001 all time points). (F) Total collagen as assessed by hydroxyproline analysis increased progressively with time, with a significant increase relative to sham animals observed at days 10 (**p=0.001), and 18 (****p<0.0001). (G) The change in longitudinal relaxation rate (ΔR1) induced by EP-3533 increased progressively with time, with a significant increase relative to sham animals observed at days 10 (*p=0.048) and 18 (***p=0.0003).
Author Manuscript
Author Manuscript
Author Manuscript
Fig. 3. Staging of liver fibrosis by ΔR1
Receiver Operating Characteristic (ROC) analysis demonstrated that ΔR1 could (A) detect fibrosis and distinguish CPA ≤3% BDL rats from CPA >3% BDL rats (AUROC=0.84, p=0.0003), (B) distinguish early fibrosis (CPA ≤6% ) from significant (CPA >6%) fibrosis (AUROC=0.94, p<0.0001), and (C) distinguish significant (CPA ≤9%) from severe (CPA >9%) fibrosis (AUROC=0.94, p<0.0001).
Author Manuscript
Author Manuscript
Author Manuscript
Fig. 4. Response to Rapamycin Therapy
A significant decrease in (A) ΔR1 (*p=0.0185), (B) hydroxyproline content (**p=0.0013), and (C) CPA (***p=0.0007) were observed with rapamycin therapy (Rapa) relative to untreated BDL animals.
Author Manuscript
Author Manuscript
Author Manuscript
Fig. 5. Variability in Rapamycin Response
Representative R1 maps from a rapamycin responder (Rapa-R) rat acquired (A) pre and (B) post EP-3533 and (C) the associated Sirius Red histology image. Representative R1 maps from a rapamycin non-responder (Rapa-NR) rat acquired (D) pre and (E) post EP-3533 and (F) the associated Sirius Red histology image. Box plots of the (G) ΔR1, (H)
hydroxyproline, and (I) CPA responses to rapamycin therapy for responder and non-responder BDL rats. Significant decreases in ΔR1 (***p=0.0009), hydroxyproline
(***p=0.0005), and CPA (****p<0.0001) were observed for responder BDL rats compared to untreated control rats.
Author Manuscript
Author Manuscript
Author Manuscript
Fig. 6. Detection of intra-hepatic fibrosis heterogeneity
R1 maps of a non-responder rapamycin rat acquired (A) pre and (B) post EP-3533 demonstrated striking heterogeneity in liver fibrosis with greater R1 in the right liver lobe compared to the left liver lobe. (C) While the pre EP-3533 histogram (blue) of liver R1 values was homogeneous the post EP-3533 R1 histogram (red) demonstrated a bimodal R1 distribution. Representative Sirius Red images from the (D) left and (E) right liver lobes confirmed the fibrosis heterogeneity with (F) increased CPA for the right liver lobe (20.6%) relative to the left liver lobe (12.6%).
Author Manuscript
Author Manuscript
Author Manuscript
Fig. 7. Three-dimensional assessment of liver fibrosis
Two-dimensional multi-planar reconstruction (MPR) of the three-dimensional post EP-3533 R1 map demonstrated heterogeneity in liver fibrosis for a rapamycin non-responder rat with elevated R1 in the right lobe (rl) and medial lobe (ml) relative to the left lobe (ll). The spine (sp), stomach (st) and enlarged bile duct (bd) are also clearly visible.