HAL Id: hal-01899068
https://hal.archives-ouvertes.fr/hal-01899068
Submitted on 19 Oct 2018
HAL is a multi-disciplinary open access
archive for the deposit and dissemination of
sci-entific research documents, whether they are
pub-lished or not. The documents may come from
teaching and research institutions in France or
abroad, or from public or private research centers.
L’archive ouverte pluridisciplinaire HAL, est
destinée au dépôt et à la diffusion de documents
scientifiques de niveau recherche, publiés ou non,
émanant des établissements d’enseignement et de
recherche français ou étrangers, des laboratoires
publics ou privés.
Landsat 8, and field plots data
L. Viet Nguyen, R. Tateishi, A. Kondoh, R.C. Sharma, H. Thanh Nguyen, T.
Trong To, D. Ho Tong Minh
To cite this version:
L. Viet Nguyen, R. Tateishi, A. Kondoh, R.C. Sharma, H. Thanh Nguyen, et al.. Mapping tropical
forest biomass by combining ALOS-2, Landsat 8, and field plots data. Land, MDPI, 2016, 5 (4), 15
p. �10.3390/land5040031�. �hal-01899068�
land
ArticleMapping Tropical Forest Biomass by Combining
ALOS-2, Landsat 8, and Field Plots Data
Luong Viet Nguyen1,2,*, Ryutaro Tateishi1, Akihiko Kondoh1, Ram C. Sharma1, Hoan Thanh Nguyen3, Tu Trong To2and Dinh Ho Tong Minh4
1 Center for Environmental Remote Sensing, Chiba University, 1–33 Yayoi-cho, Inage-ku, Chiba 263-8522,
Japan; tateishi@faculty.chiba-u.jp (R.T.); kondoh@faculty.chiba-u.jp (A.K.); sharma-rmc@chiba-u.jp (R.C.S.)
2 Space Technology Institute, Vietnam Academy of Science and Technology, 18 Hoang Quoc Viet str.,
Cau Giay dist., Hanoi 100000, Vietnam; tttu@sti.vast.vn
3 Institute of Geography, Vietnam Academy of Science and Technology, 18 Hoang Quoc Viet str.,
Cau Giay dist., Hanoi 100000, Vietnam; hoan_ig@yahoo.com
4 Institut national de Recherche en Sciences et Technologies pour l’Environnement et l’Agriculture (IRSTEA),
UMR TETIS, Maison de la Teledetection, 500 Rue Jean Francois Breton, Montpellier 34000, France; Dinh.Ho-Tong-Minh@Irstea.fr
* Correspondence: nvluong@sti.vast.vn; Tel.: +84-437-562-985
Academic Editor: Chuanrong Zhang
Received: 2 August 2016; Accepted: 21 September 2016; Published: 27 September 2016
Abstract: This research was carried out in a dense tropical forest region with the objective of improving the biomass estimates by a combination of ALOS-2 SAR, Landsat 8 optical, and field plots data. Using forest inventory based biomass data, the performance of different parameters from the two sensors was evaluated. The regression analysis with the biomass data showed that the backscatter from forest object (σ◦forest) obtained from the SAR data was more sensitive to the biomass than HV polarization, SAR textures, and maximum NDVI parameters. However, the combination of the maximum NDVI from optical data, SAR textures from HV polarization, and σ◦forestimproved estimates of the biomass. The best model derived by the combination of multiple parameters from ALOS-2 SAR and Landsat 8 data was validated with inventory data. Then, the best validated model was used to produce an up-to-date biomass map for 2015 in Yok Don National Park, which is an important conservation area in Vietnam. The validation results showed that 74% of the variation of in biomass could be explained by our model.
Keywords: forest biomass; SAR; L-band ALOS-2; backscatter; texture; Landsat 8; NDVI; accuracy; Vietnam
1. Introduction
The role of forests in mitigating global climate change was again recognized in the Paris Agreement, with “key components of landmark climate deal agreed as well as an instrument to contribute to reducing emissions and enhancing carbon sinks” (COP 21, 2015). According to the latest FAO report on global forest resource assessment, forest area reduced by 3% from 4128 M ha (1990) to 3999 M ha (2015) globally [1]. The rate of forest loss is higher in the tropics, whereas the temperate forest area has increased. The forest loss is higher in low income countries [2], and deforestation is a serious issue in many places in the world [3]. Information on forest biomass is essential for increasing our understanding of the terrestrial carbon cycle and promoting conservation and sustainable management of the forest resources. In recent years, remote sensing has become a major source of data to estimate biomass, carbon storage, and CO2sequestration [4–6].
Satellite data from optical sensor have been used widely for the estimation of forest structural characteristics [7–11]. However, the application of optical data to estimate forest biomass in the
tropical regions is very challenging while dense and multi-storied canopies are present in the tropics, and the optical data are usually contaminated by frequent cloud cover present in the tropics [4,12–14]. However, radar pulses as long-wavelength microwaves with the capability of working both night and day in any atmospheric conditions can penetrate through the structure of trees (e.g., trunks and branches) [13,15–17]. Nevertheless, the radar backscattering obtained from forests is complex because of the different types of scattering such as double bounce scattering from the ground, surface scattering from the soil surface, volume scattering from canopy, helix scattering from the tree stem structure, and wire scattering from the sharp edges of the canopy layer [18–21]. Previous studies have reported that the scattering is affected by different factors such as terrain [22–26], temperature [27,28], dielectric constant and moisture contents [29–32], and characteristics of the vegetation structure, coverage, and species [23,33,34].
Though a large number of studies have used SAR data for the estimation of biomass [16,26,27,35–45], other studies have found promising results from a combination of SAR data with optical data [46–50]. Most recent studies have concluded that HV polarization provides better correlation with the biomass than HH polarization [16,39,40,51]. Moreover, the dry season HV backscattering intensity was highly sensitive to the biomass compared to the rainy season backscattering intensity [51]. Studies have also used texture values from the SAR images to estimate forest structure and biomass [41,52,53]. Recently, the P-band BIOMASS mission was proposed by the European Space Agency (ESA) to be launched in 2020; it aims to measure global forest biomass by both intensity and tomography techniques [54,55].
The main objective of this research is to improve estimates of biomass by combining ALOS-2 SAR, Landsat 8, and field plots data in a tropical forest with high biomass values. First, we evaluate the ability of each sensor separately, and then we develop a model by combining the parameters from both sensors for the estimation of biomass. The best model is further validated with the field plots data, and an up-to-date biomass map is produced based on the validated best model. This research was conducted in Vietnam which has more than 40% forest cover; it is also one of the nine countries chosen for the United Nations’ program on Reducing Emissions from Deforestation and forest Degradation (REDD+).
2. Study Area and Dataset 2.1. Study Area
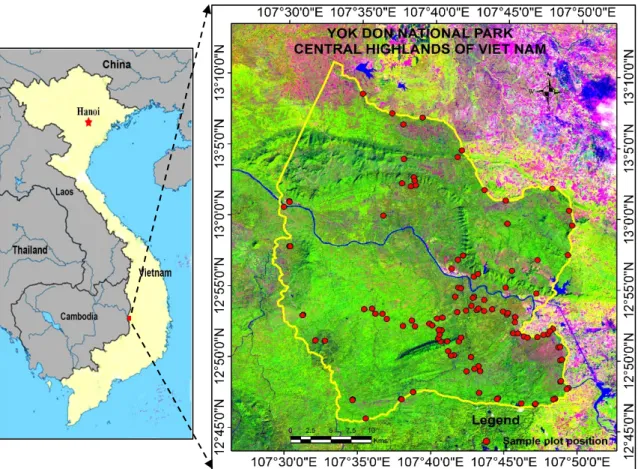
The research was conducted in Yok Don National Park in the Central Highlands of Vietnam. This park was chosen for this study because it is located in the tropical forest. The forest of Yok Don National Park is classified into two major types [56–58]: (a) dry, deciduous broadleaf forest, and (b) evergreen broadleaf forest. The dominant species of the dry deciduous broadleaf forest are Dipterocarpus tuberculatus, Dipterocarpus obtusifolius, Dipterocarpus intricatus, Terminalia tomentosa, Shorea siamensis, and Shorea obtuse; the dominant species of the evergreen broadleaf forest are Michelia mediocris, Cinamomum iners, Syzygium zeylanicum, Garruga pierrei, Gonocaryum lobbianum, Schima superba, Lithocarpus fenestratus, and Syzygium wightianum. The main soil types in Yok Don National Park are black, brown, and red-yellow [59,60]. The topography contains relatively plain topography with an average slope of about 10◦ and an altitude of 200–300 m above mean sea level [59,61]. The location map of the study is shown in Figure1.
The climate of this region is tropical monsoon, which has a well-defined dry season between October and April. The mean annual rainfall is 1530 mm, the average annual evaporation is 1470 mm, and the mean monthly temperature is around 25◦C. The rainy season, which is between May and November, is when more than 93% of the annual rainfall occurs.
Land 2016, 5, 31 3 of 15
Land 2016, 5, 31 3 of 15
Figure 1. Location map of the study area with sample plot positions. The RGB color composite (right figure) is based on ALOS-2 SAR data, and the boundary of Yok Don National Park is shown in the yellow polygon.
The climate of this region is tropical monsoon, which has a well-defined dry season between
October and April. The mean annual rainfall is 1530 mm, the average annual evaporation is 1470 mm,
and the mean monthly temperature is around 25 °C. The rainy season, which is between May and
November, is when more than 93% of the annual rainfall occurs.
2.2. Satellite Dataset
In this study, we used the Advanced Land Observing Satellite-2 Synthetic Aperture Radar
(ALOS-2 SAR), provided by Japan Aerospace Exploration Agency (JAXA), a Japanese satellite
launched in 2014, which operates in L-band radar and collects very high spatial resolution data.
ALOS-2 SAR data with version 2.1, which has 6.25 m pixel resolution, was selected from February
2015 (dry season) to reduce the effects of moisture on the signal of radar data [51]. A cloud-free
Landsat 8 scene of October 2015 (rainy season) was selected. The details on the ALOS-2 SAR and
Landsat 8 data used in the research are shown in Tables 1 and 2, respectively.
Figure 1. Location map of the study area with sample plot positions. The RGB color composite (right figure) is based on Landsat 8 OLI data, and the boundary of Yok Don National Park is shown in the yellow polygon.
2.2. Satellite Dataset
In this study, we used the Advanced Land Observing Satellite-2 Synthetic Aperture Radar (ALOS-2 SAR), provided by Japan Aerospace Exploration Agency (JAXA), a Japanese satellite launched in 2014, which operates in L-band radar and collects very high spatial resolution data. ALOS-2 SAR data with version 2.1, which has 6.25 m pixel resolution, was selected from February 2015 (dry season) to reduce the effects of moisture on the signal of radar data [51]. A cloud-free Landsat 8 scene of October 2015 (rainy season) was selected. The details on the ALOS-2 SAR and Landsat 8 data used in the research are shown in Tables1and2, respectively.
Table 1.ALOS-2 SAR data used in this research.
No. Scene ID Observation Date Observation Angle Polarizations Season
1 ALOS2040600240-150222-FBDR2.1GUA 22 February 2015 32.9◦ HH, HV Dry
2 ALOS2040600250-150222-FBDR2.1GUA 22 February 2015 32.9◦ HH, HV Dry
Table 2.Landsat 8 data used in this research.
No ID Observation Date Path/ Row Bands Used Season
1 LC81240512015289LGN00 16 October 2015 124/051 B6, B5, B4, B8 Rainy
Precipitation data on the day and seven days prior to the acquisition of SAR and optical data are shown in Table3(MONRE, 2015) [62].
Table 3.Precipitation data on the day and seven days prior to the acquisition of SAR and optical data.
Month/Year Daily Rainfall (mm) Total Rainfall (mm)
February 2015 Days 15 16 17 18 19 20 21 22 0.0
Rainfall (mm) 0.0 0.0 0.0 0.0 0.0 0.0 0.0 0.0
October 2015 Days 9 10 11 12 13 14 15 16 40.5
Rainfall (mm) 0.0 0.0 12.0 27.7 0.8 0.0 0.0 0.0
3. Methodology
3.1. Field Biomass Estimation
Field surveys are important for collecting in situ data for accuracy analysis of the satellite-based estimates. We organized an intensive field campaign during April 2015 to collect the ground truth data. In total, 110 sample plots were established in the study area. The size of a sample plot is 1 ha (100
×
100 m). We measured the diameter at breast height (D1.3 m) and tree height (H).We used allometric equations for calculating above ground biomass (AGB). The allometric equations were developed by the UN-REDD Vietnam program for the Central Highlands region of Vietnam [63]. It provides separate equations for calculating the AGB of deciduous forest type (Equation (1)) and evergreen forest type (Equation (2)). The individual tree diameter data at breast height 1.3 m (D) and tree height (H) were used to calculate the above ground biomass.
AGB = 0.14
×
D2.31 (1)AGB = 0.098
×
exp (2.08×
ln(D) + 0.71×
ln(H) + 1.12×
ln(WD)) (2)In Equations (1) and (2), AGB is the aboveground biomass of a tree in kilograms (kg), D is the diameter at breast height (1.3 m) in meters (m), H is the total tree height in meters (m), and WD is the wood density (tons dry matter/m3fresh volume) (IPCC, 2003) [64].
The summary of the inventory data is described in Tables4and5for the training and validation plots, respectively. The distribution of the sample plot positions is shown in Figure1.
Table 4.Forest inventory parameters for the training data.
Parameter
Deciduous Forest Evergreen Forest
Minimum Maximum Mean Standard
Deviation Minimum Maximum Mean
Standard Deviation Diameter (m) 8.14 38.52 18.29 6.73 16.87 48.74 19.39 13.33 Height (m) 6.33 38.52 10.97 2.93 10.01 18.23 12.18 3.14 Biomass (Mg·ha−1) 42.46 350.18 134.82 73.10 167.49 347.98 309.59 73.84
Table 5.Forest inventory parameters for the validation data.
Parameter
Deciduous Forest Evergreen Forest
Minimum Maximum Mean Standard
Deviation Minimum Maximum Mean
Standard Deviation Diameter (m) 9.89 39.41 16.74 6.17 12.51 44.82 20 15.11 Height (m) 6.06 17.67 10.635 2.73 6.17 17.67 12.95 4.57 Biomass (Mg·ha−1) 63.45 324.75 137.99 69.8 56.19 347.21 308.34 135.07
3.2. Processing of Satellite Data
The digital number (DN) values of the ALOS-2 SAR images in both the HH and HV polarizations were calibrated by calculating the backscattering intensity using Equation (3) [65]:
Land 2016, 5, 31 5 of 15
σ◦ = 10
×
log10 (DN2) + C (3)In Equation (3), σ◦is the sigma naught backscattering intensity and CF is the calibration factor, which is currently set as
−
83 (JAXA, 2014) [65].A three-component scattering model was used to decompose polarimetric SAR images. The covariance matrix approach is used to deal with the non-reflection symmetric scattering case, which describes double bounce (σ◦tree), and surface (σ◦ground) and volume scattering (σ◦vegetation) [66,67].
The scattering matrix for the double-bounce scattering is given in Equation (4).
σ◦tree
=
|
α|
2 α 0 α∗ 1 0 0 0 1 (4) where α=
SHH−SVV SHH+SVV and[
α] <
1The scattering matrix for the surface scattering is given in Equation (5).
σ◦ground
=
1 β∗ 0 β|
β|
2 0 0 0 0 (5) where β=Rh−RvRh+Rv gives the Fresnel reflection coefficients for horizontal and vertical polarizations. The scattering matrix for the volume scattering is given in Equation (6).
σ◦vegetation
=
1 4 1 0 0 0 1 0 0 0 1 (6)The backscattering from vegetation and ground surface is shown in Equation (7) based on Poolla [22]:
σ◦forest = σ◦vegetation + σ◦groundTtree (7)
In Equation (7), σ◦forestis backscatter from forest objects, σ◦vegetationis backscatter from vegetation objects, σ◦groundis backscatter from the ground surface, and Ttreeis tree transmissivity. Equation (7) can be rewritten as shown in Equation (8) for the ALOS-2 SAR data used in this study:
σ◦forest
=
σ◦HV+
σ◦HH∗
σ◦ HH
σ◦HV (8)
In Equation (8), σ◦HV is the backscattering value from HV polarization and σ◦HH is the backscattering value from HH polarization.
The Gray-Level Co-Occurrence Matrix was used to calculate the texture values, which is a function of both the angular relationship and distance between two neighboring pixels [68]. We used a window size of 5
×
5, and took the average of four directions: horizontal, vertical, and two diagonals. In this study, we used eight texture values from ALOS-2 SAR image including, Contrast, Correlation, Dissimilarity, Entropy, Homogeneity, Mean, Second Moment, and Variance [68,69]. The formulas for the texture measurements used in this study are shown in Equations (9)–(16):Contrast
=
Ng−1∑
n=0 n2 Ng∑
i=
1|
i−
j| =
n j Ng∑
j=1 p(
i, j)
(9) Correlation=
∑ij∑j(
i, j)
p(
i, j) −
µxµy σxσy (10)Dissimilarity
=
Ng−1∑
n=0 n Ng∑
i=
1|
i−
j| =
n j Ng∑
j=1 p(
i, j)
2 (11) Entropy=
∑
i j∑
j p(
i, j)
log(
p(
i, j))
(12) Homogeneity=
∑
i∑
j 1 1+ (
i−
j)
2p(
i, j)
(13) Mean=
n−1∑
i,j=0 i pi,j (14) SecondMoment=
∑
i j∑
j{
p(
i, j)}
2 (15) Variance=
∑
i j∑
j(
i−
u)
2(
p(
i, j))
(16)In Equations (9)–(16), p (i,j) is the normalized co-occurrence matrix such that sum (i,j = 0, n
−
1, p(i,j)) = 1 and µx, µy, σx, σyare the means and standard deviations of px, py.From the Landsat 8 image, Normalized Difference Vegetation Index (NDVI) was calculated [70]. Previous studies have shown that the NDVI value has good correlation with the biomass [50,71–73]. In this forest site, plants start sprouting from April, reach their peak in October, and start to fall in November. So the NDVI value of October is taken as the maximum NDVI. The NDVI (Equation (17)) was calculated using the surface reflectance value of the near infrared (RN) and red (RR) bands:
NDVI
=
RN−
RRRN
+
RR(17) 3.3. Accuracy Analysis
For each plot, the mean backscattering intensity of HV polarization from ALOS-2 SAR data, mean NDVI values from Landsat 8 data, and mean texture values from SAR and NDVI data were calculated. Out of 110 plots, 55 plots were randomly chosen as the training plots and another 55 plots as the validation plots. The sensitivity of the different parameters to the biomass was statistically analyzed by using simple linear regression and multiple linear regression analysis. The coefficient of determination (R2) in Equation (18) and root mean square error (RMSE) in Equation (19) were used as the metrics for evaluating the relationships. In addition, RMSE% was also calculated by dividing the RMSE value by the mean of the observed biomass values and multiplying by 100.
R2
=
1−
Explained Sum of SquaresTotal Sum of Squares (18)
RMSE
=
v u u t 1 n n∑
j=1(
Predicted biomass−
Observed biomass)
2 (19)In Equations (18) and (19), predicted biomass is the biomass value obtained from the model, observed biomass is the biomass value from the inventory data, and N is the number of sample plots used.
Land 2016, 5, 31 7 of 15
Land 2016, 5, 31 7 of 15
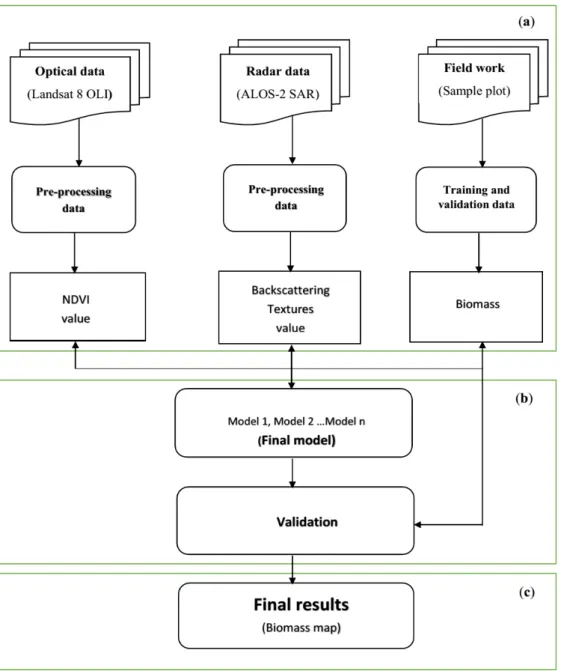
Figure 2. Flowchart describing the methodology of this study: (a) pre-processing, (b) modeling, and (c) mapping.
4. Results and Discussion
4.1. Estimates Using Single Sensor
The relationships between the field-estimated biomass and Landsat 8-based NDVI-maximum
and ALOS-2 SAR-based σ°forest values are shown in Figure 3a,b, respectively. The σ°forest could estimate
64% of the variability in the biomass (R2 = 0.64, RMSE = 48.04 Mg ha−1) better than NDVI-maximum
(R2 = 0.43, RMSE = 60.45 Mg ha−1). The multiple linear regression analysis between the SAR textures
(eight types) and biomass could explain 36% of the variability in the biomass (R2 = 0.36, RMSE = 64.06
Mg ha−1). We also analyzed multiple linear regression between the biomass and two independent
variables of the SAR data (HV and HH polarization data); the result was R2 = 0.57, RMSE = 52.51 Mg
ha−1.
Figure 2. Flowchart describing the methodology of this study: (a) pre-processing; (b) modeling; and (c) mapping.
4. Results and Discussion 4.1. Estimates Using Single Sensor
The relationships between the field-estimated biomass and Landsat 8-based NDVI-maximum and ALOS-2 SAR-based σ◦forestvalues are shown in Figure3a,b, respectively. The σ◦forestcould estimate 64% of the variability in the biomass (R2= 0.64, RMSE = 48.04 Mg
·
ha−1) better than NDVI-maximum (R2 = 0.43, RMSE = 60.45 Mg·
ha−1). The multiple linear regression analysis between the SAR textures (eight types) and biomass could explain 36% of the variability in the biomass (R2= 0.36, RMSE = 64.06 Mg·
ha−1). We also analyzed multiple linear regression between the biomass and two independent variables of the SAR data (HV and HH polarization data); the result was R2= 0.57, RMSE = 52.51 Mg·
ha−1.1
(a) (b)
Figure 3. (a) The relationship between biomass and max NDVI value; (b) the relationship between biomass and σ°forest value.
R² = 0.43 n = 55 y = 588.73x ‐ 247.71 0 50 100 150 200 250 300 350 400 0.4 0.5 0.6 0.7 0.8 0.9 Biomass (Mg ha ‐1) MaxNDVI R² = 0.6459 y = 33.689x + 917.54 0 50 100 150 200 250 300 350 400 ‐35 ‐33 ‐31 ‐29 ‐27 ‐25 ‐23 ‐21 ‐19 ‐17 ‐15 ‐13 ‐11 Biomass (Mg ha ‐1) σo forest
Figure 3. (a) The relationship between biomass and max NDVI value; (b) the relationship between
biomass and σ◦forestvalue.
In our previous study [51], the dry season HV backscattering intensity was found to be highly sensitive (R2= 0.57) to the biomass compared to the rainy season backscattering intensity (R2= 0.34). The SAR data acquired in the rainy season with humid and wet canopies were not very sensitive to the in situ biomass data. Therefore, we only used the dry season SAR data in this research.
The performance of the single-sensor-based parameters for the estimation of biomass is shown in Table6.
Table 6. Summary of the single-sensor-based estimates of the biomass in terms of coefficient of
determination (R2) and root mean square error (RMSE).
Model Parameter used R2 RMSE
Model 1 Max NDVI 0.43 60.45
Model 2 σ◦forest 0.64 48.04
Model 3 SAR textures * 0.36 64.06
Model 4 HV, HH 0.57 52.51
* Eight textures of HV: Contrast, correlation, dissimilarity, entropy, homogeneity, mean, second moment, and variance.
4.2. Estimates Using Both Sensors
We used multiple linear regression to improve the biomass estimates by combining multiple parameters from ALOS-2 and Landsat 8 data. The performance of the different combinations of parameters using the training and validation data is shown in Table7.
Table 7. The training and validation results using coefficient of determination (R2) and root mean square error (RMSE)
Model Parameter Used Training Model Validation Model Significance F
R2 RMSE R2 RMSE
Model 5 Max NDVI and SAR textures * 0.62 49.36 0.60 55.13 3×10⁻⁷
Model 6 HV and SAR textures * 0.66 46.69 0.63 44.64 3×10⁻⁸
Model 7 Max NDVI, HV and SAR textures * 0.73 41.60 0.70 39.10 7×10⁻¹
Model 8 Max NDVI, σ◦forest, and SAR textures * 0.75 35.18 0.74 35.88 3×10⁻¹
* Eight textures of HV: Contrast, correlation, dissimilarity, entropy, homogeneity, mean, second moment, and variance.
Land 2016, 5, 31 9 of 15
In Model 5 (Table7), the combination of eight textures of SAR and maximum NDVI provided better performance (R2= 0.62, RMSE = 49.36 Mg
·
ha−1) than the maximum NDVI alone (Model 1, Table6). Though the SAR data only (HV and SAR textures in Model 6 in Table7) could explain 66% of the variation in the biomass (R2 = 0.66, RMSE = 46.69 Mg·
ha−1), further addition of the maximum NDVI improved the estimates in Model 7 (R2= 0.73, RMSE = 41 60 Mg·
ha−1). Ultimately, the replacement of the HV by the σ◦forestin Model 8 provided the highest performance (R2= 0.75, RMSE = 35.88 Mg·
ha−1), as given by Model 8 in Table7. Models 5–8 in Table7are statistically significant as the F values are less than 0.05.4.3. Validation of Biomass Models
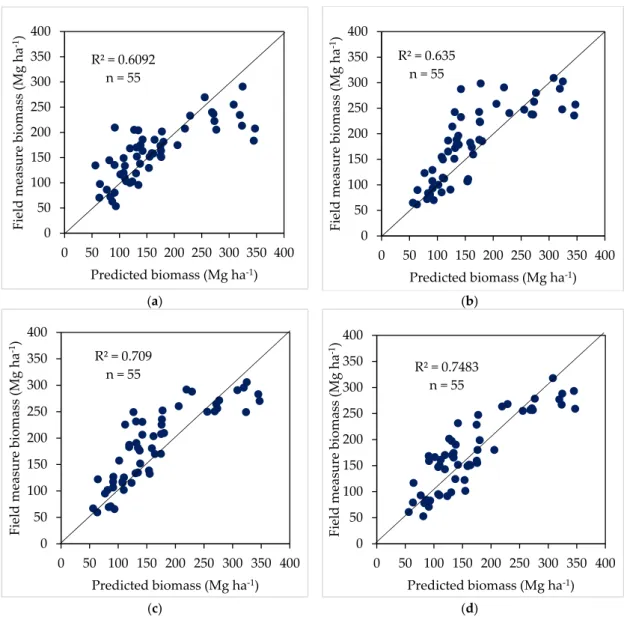
We used 55 randomly selected sample plots for the validation of Models 5–8 that were not used for deriving the models. The R2(RMSE) values for the Model 5, Model 6, Model 7, and Model 8 were 0.60 (55.13), 0.63(44.64), 0.70(39.10), and 0.74(35.88) respectively. The validation results showed that Model 8 performed best (R2= 0.74, RMSE = 35.88 Mg
·
ha−1), followed by Model 7 (R2= 0.70, RMSE = 39.10 Mg·
ha−1).The validation results are shown in Figure4, and summarized in Table7.
Land 2016, 5, 31 9 of 15
6). Though the SAR data only (HV and SAR textures in Model 6 in Table 7) could explain 66% of the
variation in the biomass (R2 = 0.66, RMSE = 46.69 Mg ha−1), further addition of the maximum NDVI
improved the estimates in Model 7 (R2 = 0.73, RMSE = 41 60 Mg ha−1). Ultimately, the replacement of
the HV by the σ°forest in Model 8 provided the highest performance (R2 = 0.75, RMSE = 35.88 Mg ha−1),
as given by Model 8 in Table 7. Models 5–8 in Table 7 are statistically significant as the F values are less than 0.05.
4.3. Validation of Biomass Models
We used 55 randomly selected sample plots for the validation of Models 5–8 that were not used
for deriving the models. The R2 (RMSE) values for the Model 5, Model 6, Model 7, and Model 8 were
0.60 (55.13), 0.63(44.64), 0.70(39.10), and 0.74(35.88) respectively. The validation results showed that
Model 8 performed best (R2 = 0.74, RMSE = 35.88 Mg ha−1), followed by Model 7 (R2 = 0.70, RMSE =
39.10 Mg ha−1).
The validation results are shown in Figure 4, and summarized in Table 7.
(a) (b)
(c) (d)
Figure 4. The validation results for different models: (a) Model 5, (b) Model 6, (c) Model 7, and (d) Model 8. The 1:1 cross plots between the predicted and ground data are shown.
0 50 100 150 200 250 300 350 400 0 50 100 150 200 250 300 350 400
Field measure biomass (Mg
ha -1) Predicted biomass (Mg ha-1) R² = 0.6092 n = 55 0 50 100 150 200 250 300 350 400 0 50 100 150 200 250 300 350 400
Field measure biomass (Mg
ha -1) Predicted biomass (Mg ha-1) R² = 0.635 n = 55 0 50 100 150 200 250 300 350 400 0 50 100 150 200 250 300 350 400
Field measure biomass (Mg
ha -1) Predicted biomass (Mg ha-1) R² = 0.709 n = 55 0 50 100 150 200 250 300 350 400 0 50 100 150 200 250 300 350 400
Field measure biomass (Mg
ha
-1)
Predicted biomass (Mg ha-1)
R² = 0.7483 n = 55
Figure 4. The validation results for different models: (a) Model 5; (b) Model 6; (c) Model 7; and (d) Model 8. The 1:1 cross plots between the predicted and ground data are shown.
In our study, saturation was found at around 300 Mg
·
ha−1, which represents a significant improvement over the previous study. However, saturation of the SAR backscattering data may still have existed due to limited height information obtained from the backscattering data. Therefore, more direct measurement (e.g., from LiDAR) of tree height is expected to overcome the saturation problem.Only 43% of the variability (R2 = 0.43 and RMSE = 60.45 Mg
·
ha−1) in the biomass could be explained by the optical best parameter, Max NDVI, and the ALOS-2 SAR data showed that 64% of the variability (R2= 0.64 and RMSE = 48.04 Mg·
ha−1) in the biomass could be explained by the best single parameter, σ◦forest. However, a combination of both optical and SAR parameters explained up to 74% of the variation in the biomass.4.4. Mapping of Aboveground Biomass
The model derived by the best combination of the ALOS-2 SAR and Landsat 8 data (Model 8) and validated independently with the field-based biomass data was used to produce the aboveground biomass map in Yok Don National Park with RMSE% = 21.70%. Model 8, used for producing this map, is shown below:
AGB (Mg·ha−1) = 516.85 − 44.27Constract + 183.67Correlation + 569.15Dissimilarity − 128.45Entropy − 140.82Homogeneity − 42.06Mean + 52.26SecondMoment
− 37.94Variance + 22.53σ◦
forest + 301.28MaxNDVI.
(20)
An up-to-date biomass map of 2015 produced during the research is shown in Figure5.
Land 2016, 5, 31 10 of 15
In our study, saturation was found at around 300 Mg ha−1, which represents a significant
improvement over the previous study. However, saturation of the SAR backscattering data may still have existed due to limited height information obtained from the backscattering data. Therefore, more direct measurement (e.g., from LiDAR) of tree height is expected to overcome the saturation problem.
Only 43% of the variability (R2 = 0.43 and RMSE = 60.45 Mg ha−1) in the biomass could be
explained by the optical best parameter, Max NDVI, and the ALOS-2 SAR data showed that 64% of
the variability (R2 = 0.64 and RMSE = 48.04 Mg ha−1) in the biomass could be explained by the best
single parameter, σ°forest. However, a combination of both optical and SAR parameters explained up
to 74% of the variation in the biomass.
4.4. Mapping of Aboveground Biomass
The model derived by the best combination of the ALOS-2 SAR and Landsat 8 data (Model 8) and validated independently with the field-based biomass data was used to produce the aboveground biomass map in Yok Don National Park with RMSE% = 21.70%. Model 8, used for producing this map, is shown below:
AGB (Mg ha−1) = 516.85 − 44.27Constract + 183.67Correlation + 569.15Dissimilarity -
128.45Entropy − 140.82Homogeneity − 42.06Mean + 52.26SecondMoment - 37.94Variance + 22.53σ̊forest + 301.28MaxNDVI.
(20) An up-to-date biomass map of 2015 produced during the research is shown in Figure 5.
Figure 5. Biomass distribution map of Yok Don National Park, Central Highlands of Vietnam.
Land 2016, 5, 31 11 of 15
In response to an urgent request from developing countries, the building of biomass carbon maps is a requirement for the implementation of policies to cope with climate change under the REDD program [74]. In line with this, our map provides accurate information about the biomass at high spatial resolution (15 m).
The spectral characteristics of forest stands vary according to the horizontal and vertical structure of the forest. Similarly, the backscattering intensity of the SAR data is also sensitive to the horizontal and vertical structure of the stand. The spectral and back-scattering values measured from the optical and SAR sensor, respectively, are sensitive not only to the leaves or upper canopy of a forest stand, but also to the scattering of light and microwaves below the forest canopy, which determine the measured spectral reflectance and back-scattering intensity values. In sparse forests, NDVI is also sensitive to the forest structure due to the high penetrability of the near-infrared channel through the forest canopy. However, NDVI values saturate in dense canopies because the near-infrared channel can no longer penetrate into the canopy, and most of the red channel is absorbed by leaves. To overcome this problem, L-band SAR data, which can also penetrate through the leaves and boles of a canopy, is expected to be highly useful in retrieving forest structures. Moreover, the textural characteristics obtained from the optical and SAR data provide an additional measure of the canopy structure. Therefore, the combination of spectral, backscattering, and textural parameters provided improved estimates of the aboveground biomass—a combination of horizontal and vertical structures—of a forest.
5. Conclusions
The performance of the biomass estimates using a single parameter from ALOS-2 SAR and Landsat 8 optical data showed that 64% of the variability (R2= 0.64 and RMSE = 48.04 Mg
·
ha−1) in the biomass could be explained by the best single parameter, σ◦forest. However, the combination of the σ◦forestwith SAR textures and maximum NDVI could explain 74% of the variation in the biomass (R2= 0.74, RMSE = 35.32 Mg·
ha−1). Therefore, in our study we confirmed that the combination of ALOS-2 SAR and Landsat 8 optical data is important for improving biomass estimates. Although we did not find much difference between the HV polarization-based model (Model 7) and the σ◦forest-based model (Model 8), because our study area is located in a relatively flat area, the σ◦forest-based model is expected to improve biomass estimates in complex mountainous terrain. We derived the best performing model based on a combination of SAR and optical data. The validated model was used to produce an up-to-date biomass map of Yok Don National Park, which is an important conservation area in Vietnam.Acknowledgments:The authors are grateful to project No. VAST01. 03/15-16 from the Vietnam Academy of Science and Technology (VAST) and the Japan Society for the Promotion of Science (JSPS) for financial support of this research. We would like to thank JAXA for providing ALOS-2 SAR data for this study in the framework of ALOS Research program, PI No. 1172.
Author Contributions:Luong Viet Nguyen conducted the research and prepared the manuscript. Ryutaro Tateishi and Akihiko Kondoh supervised the research. Dinh Ho Tong Minh, Ram C. Sharma, and Hoan Thanh Nguyen revised the manuscript. Tu Trong To assisted in field data processing. All authors contributed and approved the final manuscript before submission.
Conflicts of Interest: The authors declare that there is no conflict of interests regarding the publication of this paper.
References
1. FAO. Global Forest Resources Assessment 2015: How Are The World’s Forests Changing?; FAO: Rome, Italy, 2015.
2. Keenan, R.J.; Reams, G.A.; Achard, F.; de Freitas, J.V.; Grainger, A.; Lindquist, E. Dynamics of global forest
area: Results from the FAO global forest resources assessment 2015. For. Ecol. Manag. 2015, 352, 9–20. [CrossRef]
3. Busch, J.; Engelmann, J. The Future of Forests: Emissions from Tropical Deforestation with and without a Carbon
4. Lu, D. The potential and challenge of remote sensing-based biomass estimation. Int. J. Remote Sens. 2006, 27,
1297–1328. [CrossRef]
5. Bombelli, A.; Avitabile, V.; Balzter, H.; Marchesini, L.B.; Bernoux, M.; Brady, M. Biomass—Assessment of the
Status of the Development of the Standards for the Terrestrial Essential Climate Variables; Food and Agriculture Organization-Global Terrestrial Observation System: Rome, Italy, 2009.
6. Ridder, R.M. Options and Recommendations for a Global Remote Sensing Survey of Forests: Global Forest
Resources Assessment 2010. Available online: http://www.citeulike.org/group/7954/article/3997800 (accessed on 1 August 2015).
7. Foody, G.M.; Boyd, D.S.; Cutler, M.E. Predictive relations of tropical forest biomass from Landsat TM data
and their transferability between regions. Remote Sens. Environ. 2003, 85, 463–474. [CrossRef]
8. Hall, R.J.; Skakun, R.S.; Arsenault, E.J.; Case, B.S. Modeling forest stand structure attributes using Landsat
ETM+ data: Application to mapping of aboveground biomass and stand volume. For. Ecol. Manag. 2006,
225, 378–390. [CrossRef]
9. Meng, Q.; Cieszewski, C.J.; Madden, M.; Borders, B. A linear mixed-effects model of biomass and volume of
trees using Landsat ETM+ images. For. Ecol. Manag. 2007, 244, 93–101. [CrossRef]
10. Powell, S.L.; Cohen, W.B.; Healey, S.P.; Kennedy, R.E.; Moisen, G.G.; Pierce, K.B.; Ohmann, J.L.
Quantification of live aboveground forest biomass dynamics with Landsat time-series and field inventory data: A comparison of empirical modeling approaches. Remote Sens. Environ. 2010, 114, 1053–1068. [CrossRef]
11. Sharma, R.C.; Kajiwara, K.; Honda, Y. Automated extraction of canopy shadow fraction using unmanned
helicopter-based color vegetation indices. Trees 2013. [CrossRef]
12. Mutanga, O.; Skidmore, A.K. Narrow band vegetation indices overcome the saturation problem in biomass
estimation. Int. J. Remote Sens. 2004, 25, 3999–4014. [CrossRef]
13. Sinha, S.; Jeganathan, C.; Sharma, L.K.; Nathawat, M.S. A review of radar remote sensing for biomass
estimation. Int. J. Environ. Sci. Technol. 2015, 12, 1779–1792. [CrossRef]
14. Kumar, L.; Sinha, P.; Taylor, S.; Alqurashi, A.F. Review of the use of remote sensing for biomass estimation to
support renewable energy generation. J. Appl. Remote Sens. 2015. [CrossRef]
15. Ulaby, F.T.; Moore, R.K.; Fung, A.K. Microwave Remote Sensing: Active and Passive; Addison-Wesley: Reading,
MA, USA, 1981.
16. Le Toan, T.; Beaudoin, A.; Riom, J.; Guyon, D. Relating forest biomass to SAR data. IEEE Trans. Geosci.
Remote Sens. 1992, 30, 403–411. [CrossRef]
17. Jensen, J.R. Remote Sensing of the Environment: An Earth Resource Perspective; Pearson Education India: Delhi,
India, 2000.
18. Richards, J.; Sun, G.Q.; Simonett, D.S. L-band radar backscatter modeling of forest stands. IEEE Trans. Geosci.
Remote Sens. 1987, 25, 487–498. [CrossRef]
19. Freeman, A.; Durden, S.L. A three-component scattering model for polarimetric SAR data. IEEE Trans. Geosci.
Remote Sens. 1998, 36, 963–973. [CrossRef]
20. Ordonez, F.Y.; Ruiz, S.J.; Leblon, B. Forest Inventory Using Optical and Radar Remote Sensing; INTECH: Rijeka,
Yugoslavia, 2008.
21. Poolla, S.B. Polarimetric Scattering Model for Biophysical Characterization of Multilayer Vegetation Using
Space Borne Polsar Data. Master’s Thesis, University of Twente, Enschede, The Netherlands, 2013.
22. Kim, C. Quantitative analysis of relationship between ALOS PALSAR backscatter and forest stand volume.
J. Mar. Sci. Technl. 2012, 20, 624–628.
23. Park, S.E.; Kim, J.S.; Moon, W.M.; Boerner, W.M. Inversion of Surface Parameters from NASA/JPL AIRSAR
Polarimetric SAR Data. In Proceedings of the 3rd International Workshop on Science and Applications of SAR Polarimetry and Polarimetric Interferometry, Frascati, Italy, 22–26 January 2007.
24. Park, S.E.; Moon, W.M.; Pottier, E. Assessment of scattering mechanism of polarimetric SAR signal from
mountainous forest areas. IEEE Trans. Geosci. Remote Sens. 2012, 50, 4711–4719. [CrossRef]
25. Panciera, R.; Tanase, M.; Lowell, K.; Walker, J.P. Evaluation of IEM, Dubois, and Oh radar backscatter models
using airborne L-Band SAR. IEEE Trans. Geosci. Remote Sens. 2014, 52, 4966–4979. [CrossRef]
26. Mermoz, S.; Réjou-Méchain, M.; Villard, L.; Le Toan, T.; Rossi, V.; Gourlet-Fleury, S. Decrease of L-band SAR
Land 2016, 5, 31 13 of 15
27. Ranson, K.J.; Sun, G. Mapping biomass of a northern forest using multifrequency SAR data. IEEE Trans.
Geosci. Remote Sens. 1994, 32, 388–396. [CrossRef]
28. Ranson, K.J.; Sun, G. Effect of environmental temperatures on SAR forest biomass estimates. In Proceedings
of the 1997 IEEE International Geoscience and Remote Sensing, IGARSS ’97. Remote Sensing—A Scientific Vision for Sustainable Development, Greenbelt, MD, USA, 3–8 August 1997; pp. 1722–1724.
29. Shi, J.; Wang, J.; Hsu, A.Y.; O’Neill, P.E.; Engman, E.T. Estimation of bare surface soil moisture and surface
roughness parameter using L-band SAR image data. IEEE Trans. Geosci. Remote Sens. 1997, 35, 1254–1266.
30. Bindlish, R.; Barros, A.P. Parameterization of vegetation backscatter in radar-based, soil moisture estimation.
Remote Sens. Environ. 2001, 76, 130–137. [CrossRef]
31. Kasischke, E.S.; Bourgeau-Chavez, L.L.; Rober, A.R.; Wyatt, K.H.; Waddington, J.M.; Turetsky, M.R. Effects of
soil moisture and water depth on ERS SAR back scatter measurements from an Alaskan wetland complex.
Remote Sens. Environ. 2009, 113, 1868–1873. [CrossRef]
32. Huang, W.; Sun, G.; Zhang, Z.; Ni, W. Sensitivity of multi-source SAR backscatter to changes of forest
aboveground biomass. Remote Sens. 2015, 7, 9587–9609. [CrossRef]
33. Le Toan, T.; Mermoz, S.; Bouvet, A.; Villard, L.K.C. Forest Cover Change and Biomass Mapping; K&C Initiative
Report on an International Science Collaboration Led by JAXA: Tokyo, Japan, 2013.
34. Iizuka, K.; Tateishi, R. Estimation of CO2sequestration by the forests in Japan by discriminating precise tree
age category using remote sensing techniques. Remote Sens. 2015, 7, 15082–15113. [CrossRef]
35. Luckman, A.; Baker, J.; Kuplich, M.T.; Yanasse, F.C.C.; Frery, C.A. A study of the relationship between radar
backscatter and regenerating tropical forest biomass for spaceborne SAR instruments. Remote Sens. Environ.
1997, 60, 1–13. [CrossRef]
36. Kurvonen, L.; Pulliainen, J.; Hallikainen, M. Retrieval of biomass in boreal forests from multitemporal ERS-1
and JERS-1 SAR images. IEEE Trans. Geosci. Remote Sens. 1999, 37, 198–205. [CrossRef]
37. Hajnsek, I.; Kugler, F.; Lee, S.K.; Papathanassiou, K.P. Tropical-forest-parameter estimation by means of
Pol-InSAR: The INDREX-II campaign. IEEE Trans. Geosci. Remote Sens. 2009, 47, 481–493. [CrossRef]
38. Mika, K.; Ulla, P.; Karila, K.; Juha, H. Forest biomass estimation using ALOS PALSAR images in challenging
natural forest area in Finland. In Proceedings of the ALOS PI 2008 Symposium, ESA Special Publication. Island of Rhodes, Greece, 3–7 November 2008.
39. Lucas, R.; Armston, J.; Fairfax, R.; Fensham, R.; Accad, A.; Carreiras, J.; Metcalfe, D. An evaluation of the
ALOS PALSAR L-band backscatter—Above ground biomass relationship Queensland, Australia: Impacts of surface moisture condition and vegetation structure. IEEE J. Sel. Top. Appl. Earth Obs. Remote Sens. 2010, 3,
576–593. [CrossRef]
40. Morel, A.C.; Saatchi, S.S.; Malhi, Y.; Berry, N.J.; Banin, L.; Burslem, D.; Ong, R.C. Estimating aboveground
biomass in forest and oil palm plantation in Sabah, Malaysian Borneo using ALOS PALSAR data.
For. Ecol. Manag. 2011, 262, 1786–1798. [CrossRef]
41. Englhart, S.; Keuck, V.; Siegert, F. Aboveground biomass retrieval in tropical forests–The potential of
combined X- and L-band SAR data use. Remote Sens. Environ. 2011, 115, 1260–1271. [CrossRef]
42. Hame, T.; Rauste, Y.; Antropov, O.; Ahola, H.A.; Kilpi, J. Improved mapping of tropical forests with optical
and SAR imagery, Part II: Above ground biomass estimation. IEEE J. Sel. Top. Appl. Earth Obs. Remote Sens.
2013, 6, 92–101. [CrossRef]
43. Carreiras, J.M.B.; Melo, J.B.; Vasconcelos, M.J. Estimating the above-ground biomass in Miombo Savanna
woodlands (Mozambique, East Africa) using L-band synthetic aperture radar data. Remote Sens. 2013, 5,
1524–1548. [CrossRef]
44. Peregon, A.; Yamagata, Y. The use of ALOS/PALSAR backscatter to estimate above-ground forest biomass:
A case study in Western Siberia. Remote Sens. Environ. 2013, 137, 139–146. [CrossRef]
45. Rahman, M.M.; Tetuko Sri Sumantyo, J. Retrieval of tropical forest biomass information from ALOS PALSAR
data. Geocarto Int. 2013, 28, 382–403. [CrossRef]
46. Nezry, E.; Mougin, E.; Lopes, A.; Gastellu-Etchegorry, J.P.; Laumonier, Y. Tropical vegetation mapping with
combined visible and SAR spaceborne data. Remote Sens. 1993, 14, 2165–2184. [CrossRef]
47. Andersen, H.E.; Strunk, J.; Temesgen, H.; Atwood, D.; Winterberger, K. Using multilevel remote sensing and
ground data to estimate forest biomass resources in remote regions: A case study in the boreal forests of
48. Cutler, M.E.J.; Boyd, D.S.; Foody, G.M.; Vetrivel, A. Estimating tropical forest biomass with a combination of SAR image texture and Landsat TM data: An assessment of predictions between regions. ISPRS J.
Photogramm. Remote Sens. 2012, 70, 66–77. [CrossRef]
49. Goh, J.; Miettinen, J.; Chia, A.S.; Chew, P.T.; Liew, S.C. Biomass estimation in humid tropical forest using
a combination of ALOS PALSAR and SPOT 5 satellite imagery. Asian J. Geoinform. 2014, 13, 59–72.
50. Hamdan, O.; Hasmadi, I.M.; Aziz, H.K. Combination of SPOT-5 and ALOS PALSAR images in estimating
aboveground biomass of lowland Dipterocarpus forest. IOP Conf. Ser. Earth Environ. Sci. 2014. [CrossRef]
51. Luong, N.V.; Tateishi, R.; Thanh Nguyen, H.C.; Sharma, R.; Trong To, T.; Mai Le, S. Estimation of Tropical
Forest Structural Characteristics Using ALOS-2 SAR Data. Adv. Remote Sens. 2016, 5, 131–144.
52. Champion, I.; Dubois-Fernandez, P.; Guyon, D.; Cottrel, D. Radar SAR images texture as a function of forest
stand age. Int. J. Remote Sens. 2008, 29, 1795–1800. [CrossRef]
53. Thapa, R.B.; Watanabe, M.; Shimada, M.; Motohka, T. Examining high-resolution PiSAR-L2 textures for
estimating tropical forest carbon stocks. IEEE J. Sel. Top. Appl. Earth Obs. Remote Sens. 2016, 9, 3202–3209. [CrossRef]
54. Le Toan, T.; Quegan, S.; Davidson, M.W.J.; Balzter, H.; Paillou, P.; Papathanassiou, K.; Ulander, L.
The BIOMASS mission: Mapping global forest biomass to better understand the terrestrial carbon cycle.
Remote Sens. Environ. 2011, 115, 2850–2860. [CrossRef]
55. Minh, D.H.T.; Tebaldini, S.; Rocca, F.; Le Toan, T.; Villard, L.; Dubois-Fernandez, P.C. Capabilities of BIOMASS
tomography for investigating tropical forests. IEEE Trans. Geosci. Remote Sens. 2015, 53, 965–975. [CrossRef]
56. Trung, T.V. Chapter IV. In The Tropical Forest Ecosystem in Vietnam; Science and Technics Publishing House:
Hanoi, Vietnam, 1998.
57. Lan, P.N.; Hong, P.N.; Hung, T.V.; Thin, N.N.; Chan, L.T. Natural Forest Ecosystems Viet Nam; Ministry of
Agriculture and Rural Development of Vietnam: Hanoi, Vietnam, 2006.
58. Thin, N.N.; Anh Nguyen, D.; Tai, V.A.; Thanh, N.T.K.; Thi Nguyen, D. Update Information of
Flora and Plant’s Resources of Yok Don National Park, Daclak Province in 2008. Available online: http://www.botanyvn.com/cnt.asp?param=news&newsid=46&lg=en (accessed on 9 June 2008).
59. Nguyen, T.T. Modelling Growth and Yield of Dipterocarpa Forests in Central Highlands of Vietnam.
Ph.D. Thesis, Technische Universität München, München, Germany, 2009.
60. MARD. Soil Map in Highlands’s Region in 2010; Scale 1:250.000; National Institute for Agricultural
Planning–Remote Sensing Center, Ministry of Agriculture and Rural Development of Vietnam: Hanoi, Vietnam, 2010.
61. Canh, N.X.; Quynh, H.Q.; Anh, L.T.; Luong, N.V. Report on Conservation Planning and Sustainable Development
of Yok Don National Park in 2010–2020; Ministry of Agriculture and Rural Development of Vietnam: Hanoi, Vietnam, 2009.
62. MONRE. Survey Data Base of Hydrometeorology Sector, Has Been Archived at Center of National
Hydro-Meteorological Service; Ministry of Natural Resources and Environment: Hanoi, Vietnam, 2015.
63. Phuong, V.T.; Xuan, N.V.; Trieu, D.T.; Trung, P.D.; Giap, N.X.; Thanh, P.N. Tree Allometric Equations in Evergreen
Broadleaf, Deciduous, and Bamboo Forest in Central Highland Region, Vietnam; UN-REDD Vietnam Programme: Hanoi, Vietnam, 2013.
64. IPCC. Good Practice Guidance for Land Use, Land-Use Change and Forestry; IPCC National Greenhouse Gas
Inventories Programme Technical Support Unit: Hayama, Japan, 2003.
65. JAXA. ALOS-2/Calibration Result of JAXA Standard Products; Japan Aerospace Exploration Agency,
Earth Observation Research Center: Tsukuba, Japan, 2014.
66. Attema, E.P.W.; Ulaby, F.T. Vegetation modeled as a water cloud. Radio Sci. 1978, 13, 357–364. [CrossRef]
67. Yamaguchi, Y.; Yajima, Y.; Yamada, H. A four-component decomposition of POLSAR images based on the
coherency matrix. IEEE Geosci. Remote Sens. Lett. 2006, 3, 292–296. [CrossRef]
68. Haralick, R.M.; Shanmugam, K.; Dinstein, I.H. Textural features for image classification. IEEE Trans. Syst.
Man Cybern. 1973, 6, 610–621. [CrossRef]
69. Anys, H.; Bannari, A.; He, D.C.; Morin, D. Texture analysis for the mapping of urban areas using airborne
MEIS-II images. In Proceedings of the First International Airborne Remote Sensing Conference and Exhibition, Strasbourg, France, 12–15 September 1994; pp. 231–245.
70. Rouse, J., Jr.; Haas, R.H.; Schell, J.A.; Deering, D.W. Monitoring vegetation systems in the Great Plains with
Land 2016, 5, 31 15 of 15
71. Anderson, G.L.; Hanson, J.D.; Haas, R.H. Evaluating Landsat Thematic Mapper derived vegetation indices
for estimating above-ground biomass on semiarid rangelands. Remote Sens. Environ. 1993, 45, 165–175. [CrossRef]
72. Hunt, E.R., Jr. Relationship between woody biomass and PAR conversion efficiency for estimating net
primary production from NDVI. Int. J. Remote Sens. 1994, 15, 1725–1729. [CrossRef]
73. Dong, J.; Kaufmann, R.K.; Myneni, R.B.; Tucker, C.J.; Kauppi, P.E.; Liski, J.; Hughes, M.K. Remote
sensing estimates of boreal and temperate forest woody biomass: carbon pools, sources, and sinks.
Remote Sens. Environ. 2003, 84, 393–410. [CrossRef]
74. Saatchi, S.S.; Harris, N.L.; Brown, S.; Lefsky, M.; Mitchard, E.T.; Salas, W.; Petrova, S. Benchmark map
of forest carbon stocks in tropical regions across three continents. Proc. Natl. Acad. Sci. USA 2011, 108,
9899–9904. [CrossRef] [PubMed]
© 2016 by the authors; licensee MDPI, Basel, Switzerland. This article is an open access article distributed under the terms and conditions of the Creative Commons Attribution (CC-BY) license (http://creativecommons.org/licenses/by/4.0/).