HAL Id: hal-02606857
https://hal.inrae.fr/hal-02606857
Submitted on 5 Nov 2020
HAL is a multi-disciplinary open access
archive for the deposit and dissemination of
sci-entific research documents, whether they are
pub-lished or not. The documents may come from
teaching and research institutions in France or
abroad, or from public or private research centers.
L’archive ouverte pluridisciplinaire HAL, est
destinée au dépôt et à la diffusion de documents
scientifiques de niveau recherche, publiés ou non,
émanant des établissements d’enseignement et de
recherche français ou étrangers, des laboratoires
publics ou privés.
L-band UAVSAR tomographic imaging in dense forest:
AfriSAR results
Ibrahim El Moussawi, Dinh Ho Tong Minh, Nicolas Baghdadi, Chadi
Abdallah, Jalal Jomaah, Olivier Strauss
To cite this version:
Ibrahim El Moussawi, Dinh Ho Tong Minh, Nicolas Baghdadi, Chadi Abdallah, Jalal Jomaah, et
al.. L-band UAVSAR tomographic imaging in dense forest: AfriSAR results. IEEE International
Geoscience and Remote Sensing Symposium (IGARSS), Jul 2018, Valencia, Spain. pp.6723-6726,
�10.1109/IGARSS.2018.8519192�. �hal-02606857�
L-BAND UAVSAR TOMOGRAPHIC IMAGING IN DENSE FOREST: AFRISAR RESULTS
Ibrahim Moussawi
1,2, Dinh Ho Tong Minh
1, Nicolas Baghdadi
1, Chadi Abdallah
2,
Jalal Jomaah
3, Olivier Strauss
41
UMR TETIS, IRSTEA, University of Montpellier, Montpellier, France
2CNRS-L, the National Council for Scientific Research, Lebanon
3
Lebanese University, Lebanon
4LIRMM, University of Montpellier, France
ABSTRACT
This paper presents tomographic analysis using L-band NASA/JPL UAVSAR from AfriSAR data conducted over the Gabon Lope Park on February 2016. Prior to tomo-graphic imaging, a phase residual correction methodology based on Sum Kronecker Product have been implemented. The estimated vertical structure of the forest extracted from the correct tomographic data is validated with small footprint light detection collected during the AfriSAR campaign on July 2015. The result demonstrates that L-band tomographic imaging can now be carried out even in the dense tropical forest.
Index Terms— AfriSAR campaign, TomoSAR, Phase Calibration, Lidar, Tropical forest
1. INTRODUCTION
Tropical forests have major impacts on earth’s ecosystem in terms of carbon storage, regulating water and weather. Above Ground Biomass (AGB) is the most important param-eter that is related directly to the amount of the carbon in the global ecosystem cycle [1]. Uncertainty in balancing the global carbon budget arises from a deficiency in AGB den-sity estimation and carbon stocks in tropical forests. NASA , ESA, AGEOS and DLR have developed united efforts in the implementation of AfriSAR campaign on the Gabon forests. AfriSAR campaign aims to gather airborne and field data that support the establishing of vertical structure of forests and biomass missions. The airborne data provided by the AfriSAR campaign consist of Synthetic Aperture Radar (SAR) data and Light Detection And Ranging (Lidar) data .
Tomography SAR technique is widely used in character-izing the vertical structure of the forests and to estimate the canopy height of the trees. The potential of TomoSAR is in identifying the forests top height which is an essential param-eter for the AGB estimation [2, 3, 4]. Prior to TomoSAR anal-ysis, there is need to compensate the phase residuals that in-fluence the focusing of the vertical structure of forest in the 3D space. These phase disturbances come from atmospheric
propagation delays or an error in allocating the platform posi-tion [5]. In order to eliminate these residuals, iterative phase calibration algorithm which is capable of estimating the phase screens and correct the data stack can be applied.
This study presents tomographic imaging on the Gabon Lope Park using L-band NASA/JPL UAVSAR data collected by AfriSAR campaign 2016 after it was adopted to Tebal-dini approach [6] to eliminate phase distortion from the tomo-graphic data. The obtained vertical profiles were validated us-ing Land, Vegetation, and Ice Sensor (LVIS) and Small Foot Print Lidar (SFL) data set as a reference.
The paper is organized as follows: Section 2 describes study area and presents the data set used in the tomographic imaging. Section 3 is dedicated to explain the tomography processing. The validation of the results is illustrated and in-terpreted in section 4. Section 5 concludes the paper and state the future works.
2. STUDY AREA AND DATA SET
The tomographic study was conducted on the Gabon National Lope Park. Lope National Park is one of the largest national parks in central Gabon covering an area of 4913 km2. Al-though the terrain is mostly rain forest, the scene in the north part is composed of the last remnants of grass savanna cre-ated in central Africa during the ice age 15000 years ago. The park was the first protected area in the Gabon. It is frequently tracked by the National Park Agency of Gabon which makes it well cited as a perfect scientific research site.
Different data sets have been acquired over the Lope dur-ing the AfriSAR campaign. The NASA AfriSAR campaign involved two data sets, UAVSAR data and Lidar data (LVIS and SFL data).
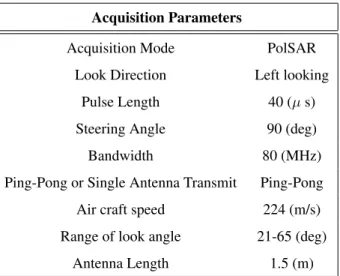
The L-band UAVSAR acquisition parameters and the baseline configuration of each track with respect to master track is shown in Table. 1 and Table. 2 respectively.
LVIS is Large Footprint Lidar with full-waveform ca-pability. The SFL data set was collected by the Sassan Saactchi’s team JPL in July 2015, with foot print
diame-Table 1. L-band UAVSAR acquisition parameters. Acquisition Parameters
Acquisition Mode PolSAR Look Direction Left looking
Pulse Length 40 (µ s) Steering Angle 90 (deg) Bandwidth 80 (MHz) Ping-Pong or Single Antenna Transmit Ping-Pong Air craft speed 224 (m/s) Range of look angle 21-65 (deg)
Antenna Length 1.5 (m)
ter of 10 cm. It provides a uniform information for vegetation characterization such as: Canopy Height Model (CHM) and Digital Terrain Model (DTM).
Fig. 1. HH and HV. Capon spectrum after phase calibration of the data and eliminating the phase disturbances. The black line and white line corresponding to DTM and CHM from SFL respectively.
Table 2. Baseline configuration of Multi-baseline acquisition. Track Relative baseline
1 master 2 20m 3 40m 4 60m 5 80m 6 100m 7 120m 3. TOMOGRAPHY PROCESSING
Multi-baseline SAR data were acquired over forests from slightly different altitude and incidence angles providing use-ful information in the vertical direction [2]. The L-band UAVSAR airborne system provides fully polarimetric mode in the NASA AfriSAR campaign. TomoSAR is a signal pro-cessing algorithm used in treating the SAR data to focus the illuminated scatterers in the 3D space. Tomographic tech-niques composed of power estimation methods applied on the multi-baseline data to get the vertical profile of the forests [2, 3]. In this paper, Capon beam forming power estimator is applied to represent the vertical profile of vegetated areas. A fundamental issue have been taken into account before carrying on tomographic analysis is the phase calibration of the data. Various techniques were proposed to correct the tomographic data. Some techniques are based on the Per-manent Scatterers (PS) in which the calibration performance could be defective by the nature of the scatterers having im-portant limitations when applied on the tropical forests due to decorrelation that is caused by dense vegetation [7]. Another approaches proposed a phase calibration of mutli-baseline SAR data based on minimum entropy criterion [8]. One more technique is based on the separation of the ground contribu-tion and volume contribucontribu-tion in order to isolate the ground phase using Sum Kronecker Product (SKP) structure in pre-senting the data covariance matrix [6]. Tebaldini et al [5] proposed recent strategy for calibrating the tomographic data based on the double localization of target position and sensor position errors responsible for the phase disturbances in the data stack. In our tomographic analysis over the Lope, we adopted phase calibration proposed in Tebaldini [6].
3.1. TomoSAR calibration
The TomoSAR data phase calibration is done by eliminating the ground phase contributions from the tomographic Single Look Complex (SLC) data. The exploitation of MultiPolari-metric and MultiBaseline (MPMB) data allows the identifi-cation of different Scatterer Mechanisms (SM) [6]. The sep-aration of the ground contribution and the vegetation from
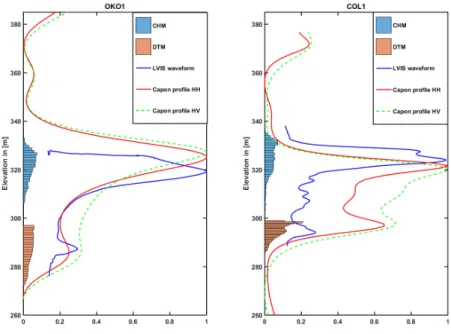
Fig. 2. Regions of interest named OKO1 and COL1 in the Gabon Lope Park. HH (in red), HV (in green) Capon profiles after phase screen correction. Capon power and LVIS waveform power are normalized between 0 and 1. The histograms of SFL canopy and ground elevations are presented respectively in blue and in brown. The blue curve corresponding to LVIS waveform..
MPMB data is performed by presenting the data covariance matrix through SKP [6]. The structure model of the data co-variance matrix, where each scatterer mechanism is presented by Kronecker Product (KP) of two matrices, is addressed as follows:
W = E[Y YH]
= Cg⊗ Rg+ Cν⊗ Rν
(1)
Where Y is the MPMB data vector, H is the Hermitian conjugate, W denotes the data covariance matrix, K is the to-tal number of SMs that contribute to SAR signal, Cg,v and
Rg,vare the polarimetric signature and structure matrix
corre-sponding to the ground and volume contribution, respectively. After the estimation of the ground covariance matrix, Phase linking algorithm is applied to estimate ground phases. After that, the calibration is carried out by removing ground phases from the original SLC data. Finally, Capon beam forming power estimation is applied to get the tomographic profiles.
4. TOMOGRAPHIC RESULTS OVER LOPE FOR L-BAND ACQUISITIONS
In this part we present the estimation of L-band tomographic profiles over a section from the lope in the range direction.
The experiment has been formed based on N=7 L-band fully polarimetric SAR images. The baseline spacing is 20 m, re-sulting a total baseline of 120 m.
Capon beam forming power estimation have been applied on sliding window of 50x50 (pixels) for each position in the azimuth direction. The tomogram at different polarimetric channels has been validated by small foot print Lidar (SFL).
The backscatter SLC image where we had chosen the studied section at slant range equal to 500 is illustrated in the top of Fig.1. The tomographic profiles from the capon beam forming power estimator is normalized between 0 and 1. It was presented at different polarization channels: HH and HV. The results in Fig.1 demonstrate that after the isolation and compensation of the ground contribution from the data stack, the tomographic profiles achieved a good correla-tion with the CHM and DTM from SFL data and clearly the canopy layer and ground level are detected at the two channels. A slight difference was observed between the two channels tomograms, at azimuth range between 2000 and 3000 (pixels), the HV volume scattering seems to be stronger than HH.
Qualitative comparison between the UAVSAR Capon profile (HH and HV) and LVIS waveform is illustrated in Fig.2. The LVIS level1B has been used to plot the vege-tation profiles. The difference between the shapes of LVIS and Capon profiles may be originated from the difference in penetration capabilities or a difference of profile resolution
between the two platforms (UAVSAR and LVIS). When ob-serving the Capon profiles, it is worth noticing the correlation between the width of the lobes (vegetation and ground ) and the distribution of the SFL data, this enables the estimation of the forest top height at the Lope. By comparing the HV Capon profile with HH, it can be shown clearly that the ground con-tribution is stronger regarding the volume concon-tribution of HH channel than for the HV channel concerning the analyzed Region of Interest COL1, while at OKO1 the HH and HV profiles are unexpectedly similar. After observing The pene-tration of L-band into the vegetation in Fig.1 and Fig.2 , we can generalize a conclusion that L-band tomography can be feasible in dense forests.
5. CONCLUSION
In this paper, the TomoSAR analysis have been applied for estimation of the forest canopy height and terrain using L-band UAVSAR AfriSAR data collected over the Gabon Lope Park. We have shown the importance of eliminating the phase screens residuals from the data stack in order to improve the performance of TomoSAR analysis in illuminating correctly the scatterers in complex dense forests. The tomographic capon profiles at different sections in the forest are validated in a well correlation with SFL Lidar data after the calibration. Our perspectives for this work is to report for the status of us-ing double localization method and SKP method to perform phase calibration of the tomographic data.
6. ACKNOWLEDGMENT
This research was supported by IRSTEA (National Research Institute of Science and Technology for Environment and Agriculture), the National Council for Scientific Research Lebanon (CNRS-L), University of Montpelier and L’Agence universitaire de la Francophonie.
7. REFERENCES
[1] M. E. Hajj, N. Baghdadi, and I. Fayad, “Interest of inte-grating spaceborne lidar data to improve the estimation of biomass in high biomass forested areas,” Remote Sensing, vol. 9, pp. 213, 2017.
[2] D.H.T. Minh, T. Le Toan, F. Rocca, S. Tebaldini, L. Vil-lard, M. Rjou-Mchain, and J. Chave, “Sar tomography for the retrieval of forest biomass and height: Cross-validation at two tropical forest sites in french guiana,” Remote Sensing of Environment, vol. 175, pp. 138–147, 2017.
[3] D. H. T. Minh, T. Le Toan, F. Rocca, S. Tebaldini, M. M. d’Alessandro, and L. Villard, “Relating p-band synthetic aperture radar tomography to tropical forest biomass,”
IEEE Transactions on Geoscience and Remote Sensing, vol. 52, no. 2, pp. 967–979, 2014.
[4] A. Reigber and A. Moreira, “First demonstration of air-borne sar tomography using multibaseline l-band data,” IEEE Transactions on Geoscience and Remote Sensing, vol. 38, no. 5, pp. 2142–2152, 2000.
[5] S. Tebaldini, F. Rocca, M. M. d’Alessandro, and L. Ferro-Famil, “Phase calibration of airborne tomographic sar data via phase center double localization,” IEEE Trans-actions on Geoscience and Remote Sensing, vol. 54, no. 3, pp. 1775–1792, 2016.
[6] S Tebaldini, “Algebraic synthesis of forest scenarios from multibaseline polinsar data,” IEEE Transactions on Geo-science and Remote Sensing, vol. 47, no. 12, pp. 4132– 4142, 2009.
[7] S. Tebaldini and A. M. Guarnieri, “On the role of phase stability in sar multibaseline applications,” IEEE Trans-actions on Geoscience and Remote Sensing, vol. 48, no. 7, pp. 2953–2966, 2010.
[8] M. Pardini, K. Papathanassiou, V. Bianco, and A. Iodice, “Phase calibration of multibaseline sar data based on a minimum entropy criterion,” Geoscience and Remote Sensing Symposium (IGARSS), 2012 IEEE International, pp. 5198–5201, 2012.
View publication stats View publication stats