An Early Conceptual Design and Feasibility Analysis of a Nuclear-Powered Cargo Vessel
By
John L. Beaver III B.S., Mechanical Engineering University of South Carolina, 1998 Masters of Engineering Management
Old Dominion University, 2003
MASSACHUSETrS INS'TE
OF TECHNOLOGY
LIBRARIUN
16 2ES09
LIBRARIES
SUBMITTED TO THE DEPARTMENT OF MECHANICAL ENGINEERING AND THE DEPARTMENT OF NUCLEAR SCIENCE AND ENGINEERING IN PARTIAL
FULFILLMENT OF THE REQUIREMENTS FOR THE DEGREES OF NAVAL ENGINEER AND
MASTER OF SCIENCE IN NUCLEAR SCIENCE AND ENGINEERING AT THE
MASSACHUSETTS INSTITUTE OF TECHNOLOGY JUNE 2009
© 2009 Massachusetts Institute of Technology. All rights reserved. Signature of Author
Certified by
Certified by
Accepted by
ARCHIvE
Department of Mechanical Engineering Department of Nuclear Science and Engineering May 8, 2009
-q ' He ryS .arcus 7-j esiuSupervisor
/1
i/ Y~rofesso/ofMla~ h4e Systems/Rikhard
K. Cster-Thesis Reader Professor of Nuclear Sience and EngineeringDirector; Ind Pforma Center
/ -
/
Jacquelyn C. Yanch Chair, Department Committee on Graduate Studies Department of Nepr Science and Engineering Accepted byv-
D E. Hardt
Chair, Department Committee on Graduate Students Department of Mechanical Engineering
An Early Conceptual Design and Feasibility Analysis of a
Nuclear-Powered Cargo Vessel
by
John L. Beaver III
Submitted to the Department of Mechanical Engineering and the Department of Nuclear Science and Engineering on March 9, 2009 in Partial Fulfillment of the Requirements for
the Degrees of Naval Engineer and Master of Science in Nuclear Science and Engineering
ABSTRACT
Economic globalization has resulted in the tremendous growth of worldwide trade. Much of this trade is carried out via the various waterways of the world. The bulk of these trade goods are transported by merchant ships that burn diesel fuel to propel them through the water. With the cost of crude oil rising to record highs, the cost of operating these ships has been skyrocketing as well, indicating the need for the development of alternative sources of propulsion power.
This thesis focuses on the development of an early stage conceptual design for a nuclear-powered commercial cargo ship and the subsequent economic analysis of that ship in comparison with its conventionally-powered predecessor ship. In addition, this thesis will also analyze and propose solutions to the various non-technical issues that currently stand in the way of building and operating a nuclear-powered cargo vessel. The end result of this research shows that a nuclear-powered commercial cargo ship, while being technically feasible, is still economically inferior to a conventionally-powered cargo ship.
Thesis Supervisor: Henry S. Marcus Title: Professor of Marine Systems Thesis Reader: Richard K. Lester
Title: Professor of Nuclear Science and Engineering Director, Industrial Performance Center
Acknowledgements
I would like to thank my thesis advisor, Professor Henry Marcus, for his patience, guidance, advice, and support. I would also like to thank my thesis reader, Professor Richard Lester, for his willingness to help me achieve my academic goals.
I would like to thank my family for their unwavering support. I would like to thank my three sons, Reilly, Colby, and Avery, who never fail to remind me of what is important in life, and never fail to raise my spirits with his smiles and hugs. And finally my deepest thanks are for my wife, Michelle. Her steadfast devotion, support, understanding, and love through this three-year journey was amazing.
And, as with all things, this successful endeavor was only possible by the grace of God. Without His blessing, none of this would have been possible.
Table of Contents
1. INTRODUCTION ... 7
1.1 MOTIVATION FOR RESEARCH... ... 7
1.2 PREVIOUS APPLICATIONS OF NUCLEAR POWER FOR SHIP PROPULSION ... 10
1.2.1 Military Applications ... 10
1.2.2 Merchant Cargo Ships ... ... ... ... 12
1.2.3 Russian Nuclear-Powered Ice Breakers ...15
1.3 THESIS OUTLINE ... .. ... ... 16
2. PRELIMINARY DESIGN CONSIDERATIONS AND ASSUMPTIONS ...17
2.1 OVERALL DESIGN PHILOSOPHY ... ... 17
2.2 THE PROPOSED SHIP ... .. ... 18
2.3 OTHER ASSUMPTIONS ... ... ... 21
3. DETAILED ANALYSIS ... ... 22
3.1 DETERMINATION OF BASIC REQUIREMENTS ...22
3.2 REACTOR DESIGN ... 27
3.2.1 Choosing the Type of Reactor...27
3.2.2 Core D esign ... . 36
3.2.3 Basic Concept of Reactor Operations...42
3.2.4 Refueling ... 42
3.3 PROPULSION PLANT SELECTION ... 44
3.4 REACTOR AND ENGINEROOM LOCATION ...50
3.5 LICENSING ... ... ... 54
3.5.1 Licensing via the NRC.... ... ... 55
3.5.2 Ship Classification via the ABS... ... 62
4. ECONOMICS AND LOGISTICS... 65
4.1 GENERAL DISCUSSION ... 65 4.2 LOGISTICAL ASSUMPTIONS ... ... 66 4.3 ECONOMIC ANALYSIS ... 67 4.3.1 Acquisition Costs ... ... 70 4.3.2 M arine Insurance... 72 4.3.3 Manning ... 73
4.3.4 Other Lifecycle Costs ... ... 74
4.3.5 Operational Costs ... ... 74
4.4 FINAL COST ANALYSIS ... 74
4.4.1 Base-case Analysis... 74
4.5.2 Sensitivity Analysis... ... ... 76
5. CONCLUSION AND RECOMMENDATIONS ... 80
5.1 CONCLUSION. ... 80
5.2 RECOMMENDATIONS FOR FUTURE RESEARCH ...82
6. REFERENCES ... ... 85
APPENDIX A: CASMO-4 ROUTINE... ... 87
APPENDIX B: CASMO-4 END OF CORE LIFE OUTPUT (10% ENRICHMENT) ...88
APPENDIX C: NUCLEAR SHIP PV ANALYSIS 4BASE-CASE... ... ...93
APPENDIX D: CONVENTIONAL SHIP PV ANALYSIS -BASE-CASE ... 95
APPENDIX E: NUCLEAR SHIP PV DATA FOR INCREASING FUEL COSTS ... 97
APPENDIX F: CONVENTIONAL SHIP PV DATA FOR INCREASING FUEL COSTS ...98
List of Figures
FIGURE 1: TOTAL U.S. CONTAINER TRAFFIC... ... ... 7
FIGURE 2: AVERAGE COST OF A BARREL OF CRUDE OIL FROM 1988 TO PRESENT ... 8
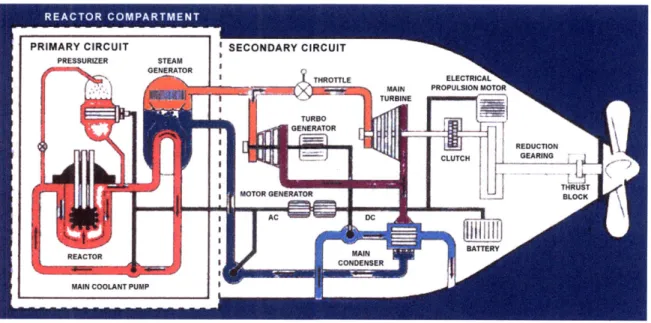
FIGURE 3: SIMPLIFIED SUBMARINE REACTOR PLANT ... ... 11
FIGURE 4: NS SAVANNAH ... 12
FIGURE 5: NS OTTO HAHN ... ... .. ... 13
FIGURE 6: NS M UTSU... ... ...14
FIGURE 7: RUSSIAN NUCLEAR-POWERED ICE BREAKER ... ... 16
FIGURE 8: T HE EM M A M AERSK ... 19
FIGURE 9: EMMA MAERSK'S PROPULSION DIESEL ENGINE... ... 20
FIGURE 10: ESTIMATED CARGO CAPACITY OF THE EMMA MAERSK...21
FIGURE 11: SPEED VS. POWER CURVE FOR THE EMMA MAERSK ... 23
FIGURE 12: DAILY FUEL CONSUMPTION OF VARIOUS CONTAINER SHIPS AT VARIOUS SERVICE SPEEDS...24
FIGURE 13: M OTIONS OF A SHIP ... ... 28
FIGURE 14: TYPICAL BOILING WATER REACTOR PLANT... ... 29
FIGURE 15: SODIUM-COOLED REACTOR ARRANGEMENT ... ... 30
FIGURE 16: MGCR CONCEPT CYCLE DIAGRAM... ... 32
FIGURE 17: CROSS-SECTION OF A STANDARD 17X17 FUEL ASSEMBLY ... ... 37
FIGURE 18: STANDARD 17X17 FUEL ASSEMBLY ... ... 38
FIGURE 19: PROPOSED CONCEPT OF CORE DESIGN ... 39
FIGURE 20: GRAPH OF THE INFINITE MULTIPLICATION FACTOR VS. U-235 PERCENT ENRICHMENT...42
FIGURE 21: STANDARD PROPULSION TRAIN ... 45
FIGURE 22: SIMPLIFIED ELECTRIC PROPULSION SYSTEM... ... 46
FIGURE 23: AMERICAN SUPERCONDUCTOR'S HTS PROPULSION MOTOR ... 48
FIGURE 24: PROPOSED ELECTRICAL DISTRIBUTION SYSTEM ... 49
FIGURE 25: OVERHEAD VIEW OF THE REACTOR COMPARTMENT ... 50
FIGURE 26: TYPICAL CONTAINMENT VESSEL OF A LAND-BASED REACTOR AND SHIP-BASED REACTOR ... 51
FIGURE 27: ESTIMATED ENGINEROOM VOLUME ... ... 52
FIGURE 28: LOCATION OF CONTAINMENT AND MACHINERY SPACE ON THE NS SAVANNAH...54
FIGURE 29: TYPICAL NRC APPROVAL STEPS AND TIMELINE ... 56
FIGURE 30: EXAMPLE OF A LEARNING CURVE ... ... 71
FIGURE 31: NET PRESENT VALUE LIFECYCLE COST COMPARISON...75
FIGURE 32: PV LIFECYCLE COST COMPARISON ASSUMING A 5% INCREASE IN FUEL COSTS ... 77
FIGURE 33: PV OF LIFECYCLE COSTS ASSUMING A GOVERNMENT SUBSIDY ... 78
FIGURE 34: PV OF LIFECYCLE COSTS ASSUMING A GOVERNMENT LOAN SUBSIDY ... 79
FIGURE 35: PV OF LIFECYCLE COSTS ASSUMING A SUBSIDY AND INCREASING FUEL COSTS ... 80
FIGURE 36: COST OF FUEL WITH A Low SULFUR CONTENT AT THE PORT OF Los ANGELES ... 81
List of Tables
TABLE 1: PERTINENT NAVAL ARCHITECTURAL DATA FOR NS SAVANNAH... ...13TABLE 2: PERTINENT NAVAL ARCHITECTURAL DATA FOR NS OTTO HAHN ... 14
TABLE 3: PERTINENT NAVAL ARCHITECTURAL DATA FOR NS MUTSU ... ... 15
TABLE 4: PERTINENT NAVAL ARCHITECTURAL DATA DATA FOR NS SEVMORPUT ... 15
TABLE 5: PERTINENT NAVAL ARCHITECTURAL DATA FOR RUSSIAN ICE BREAKERS ... 16
TABLE 6: PERTINENT NAVAL ARCHITECTURAL DATA FOR EMMA MAERSK... 19
TABLE 7: REACTOR POWER BASIS BREAKDOWN... ... 25
TABLE 8: EXAMPLE PUGH METHOD MATRIX ... ...34
TABLE 9: REACTOR SELECTION MATRIX... 35
TABLE 10: ELECTRICAL DISTRIBUTION SYSTEM SPECIFICS ... ... 49
TABLE 11: COSTING DATA ... ... ... 70
1.
INTRODUCTION
1.1 Motivation for Research
Economic globalization has resulted in the tremendous growth of worldwide trade. It is estimated that almost 90% of the goods that are produced in the world reach their destination via the waterways of the world (1). The United States is a major importer and exporter of the aforementioned goods. The total container traffic within the United States for the six year period from 2000 to 2005 can be seen below in Figure One(l). One can see that the trans-oceanic container traffic increased by approximately 50% during this time frame, growing from about 28.5 million Twenty-foot Equivalent Units (TEU) to 40 million TEU. Worldwide container shipping is also growing at the same rate. Total movements are also expected to more than double in the next ten years.
Total U.S. Container Traffic
25,000 W 20,000 S15,000 - N Pacific Atlantic 0 10,000 - - - -N Gulf I-5,000 2000 2001 2002 2003 2004 2005 YearFigure 1: Total U.S. Container Traffic
The bulk of these goods are transported by merchant ships that bum diesel fuel to propel them through the water. With the cost of crude oil rising to record highs, the costs
associated with operating these ships has been skyrocketing as well. A plot of the cost of a barrel of gasoline from 1988 up to the present is shown below in Figure 2(2).
140 130 -20 oilnergy.com, 2009 110 -100 -90 80 -70 --70 50 40 -30 20 10 88 89 90 91 92 93 94 95 96 97 98 99 00 01 02 03 04 05 06 07 08 09 10
Figure 2: Average Cost of a Barrel of Crude Oil from 1988 to Present
Figure 2 shows that the cost of crude oil tripled from 2002 to 2006, skyrocketed to record highs during the summer of 2008, and then dropped back to pre-2006 prices as the year 2008 came to an end. The rising cost of diesel fuel, which is the refined product of crude oil, has resulted in shipping companies either operating their fleet of ships at lower speeds to keep costs down or making fewer transoceanic transits. Both of these choices have the obvious effect of decreasing the speed at which goods ultimately make it to the consumer.
It is important to note that shipping also releases pollutants into the atmosphere as the ships burn the fuels needed for their propulsion. It has been estimated that shipping is responsible for approximately 14 percent of the emissions of nitrogen (NOx) from fossil fuels and 16 percent of the emissions of sulfur (SOx) from petroleum uses into the atmosphere worldwide(3). It is therefore not surprising that countries are passing legislation that will require ships to reduce their emissions. The cost of reducing these
emissions is being paid by the shipowners, meaning that the costs to shipowners to operate their fleet of containerships could rise even further. Other restrictions are also set to go into effect at some of the major shipping ports in an effort to clean up the air around these ports. For example, in 2008, the ports of Long Beach and Los Angeles mandated that the top speed of advance for all shipping either coming into or out of the ports should be no more than 12 knots whenever the vessel is within 40 nautical miles of the port. Furthermore, these same ports require all ships to burn cleaner fuels when within the same land limits, namely 0.2% sulfur marine gas oil. The previous land limit was only 20 nautical miles from land. Taken together, these issues make the search for a cleaner means of ship propulsion very important.
One such solution to these problems is to design, build, and operate a nuclear-powered merchant vessel or a fleet of such merchant vessels between worldwide shipping ports. Nuclear energy is considered by some to be a "green" solution to air pollution. The objective of this thesis is to evaluate the various aspects of such an undertaking. This thesis will identify the type of merchant ship and the powering requirements for this ship, and will propose a preliminary reactor concept design for this ship. The thesis will also analyze and propose solutions to various non-technical issues that currently stand in the way of building and operating a nuclear-powered cargo vessel. Finally, this thesis will assess whether or not a nuclear-powered commercial ship operating alone or within the context of a fleet of ships can be economically profitable. The analysis will consider not only the direct economic costs associated with the construction, operation, and maintenance of these ships, but will also consider the impact of the costs associated with
making the current fleet of non-nuclear commercial ships comply with the various clean air acts that currently exist, or are likely to be introduced in the future.
The fundamental objective of this conceptual design is to show through simplified engineering analysis that a nuclear reactor can be used to propel a modem day cargo vessel without significantly affecting the cargo carrying capacity of the vessel and also to investigate the economic validity of nuclear propulsion for merchant vessels. Once the specific powering requirements have been determined, the reactor core will be validated via CASMO-4 with an eye towards maximizing core life within the confines of required classification survey timeframes. This thesis will also discuss the licensing process, both in regards to the nuclear reactor via the United States Nuclear Regulatory Commission and the ship itself via the American Bureau of Shipping classification society.
1.2 Previous Applications of Nuclear Power for Ship Propulsion
1.2.1 Military Applications
The United States Navy has been using nuclear power to propel its submarines and aircraft carriers since the USS Nautilus first signaled "underway on nuclear power" in 1955. Since that time, the United States Navy has used nuclear power for propulsion on submarines, aircraft carriers, and cruisers. A total of 215 nuclear-powered military vessels have been built and operated. These ships have accumulated almost 6,000 reactor-years of total operational time while steaming over 136 million miles without any significant reactor safety issues. The United States Navy's nuclear propulsion program currently operates 103 nuclear reactors. A simplified submarine reactor plant can be seen below in Figure 3(4). United States Naval Reactors use highly enriched uranium in their reactors. The enrichment level typically exceeds 90%. The reactor thermal power output
varies between the different ship types, but the range is between 70 MW for a submarine and 550 MW for an aircraft carrier.
Figure 3: Simplified Submarine Reactor Plant
In addition to the United States, four other countries currently operate nuclear-powered warships and submarines: Great Britain, France, Russia, and China. Additionally, it is estimated that India will have a nuclear-powered submarine by 2009. Specific details about the nuclear-powered ships from these foreign countries are difficult to obtain and the open source information that is available is generally inaccurate. Therefore, no further discussion about foreign military nuclear combatants will be conducted.
1.2.2 Merchant Cargo Ships
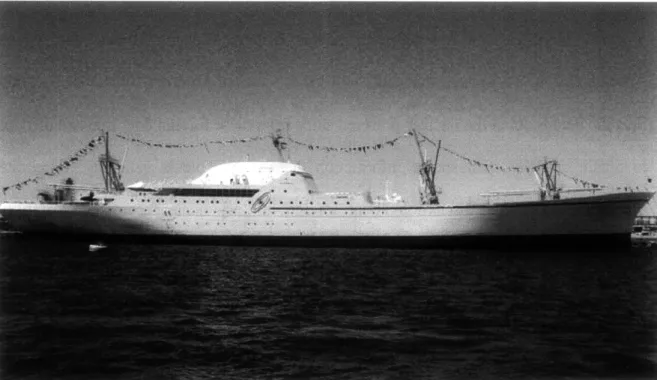
If we look at the commercial merchant marine ships operated in the United States, only one nuclear-powered ship has ever been designed, built, and operated. This ship, the NS Savannah, was authorized by the Congress of the United States in July of 1956. The ship was to be the first of several nuclear-powered merchant vessels under President Dwight D. Eisenhower's Atoms for Peace initiative. The NS Savannah was to be a joint venture between the Maritime Administration (MARAD) and the Atomic Energy Commission (AEC). The keel of the ship was laid on May 22, 1958 and the ship was christened on July 21, 1959. The ship was acquired on May 1, 1962 and finally embarked on her maiden voyage on August 20, 1962(5). Since extensive information is readily available for NS Savannah, it served as a model for much of this project.
Figure 4: NS Savannah1
http://www.globalsecurity.org/military/systems/ship/savannah-pics.htm
LOA 595.5 feet
Beam 78 feet
Draft 29.5 feet
Displacement 21,800 LT
Cargo Capacity 10,000 tons
Passengers 60
Crew ~ 110
Cruising Speed 21 Knots
Reactor Thermal Power 74 MW
Reactor Type PWR
Table 1: Pertinent Naval Architectural Data for NS Savannah
The world's second civilian nuclear-powered merchant ship was built in
Germany. The NS Otto Hahn was a 15,000 long ton displacement cargo and research vessel, powered by a 38 MWth reactor, and was operated for the ten-year period from 1969 to 1979, steaming 650,000 nautical miles. But, as in the case of NS Savannah, the NS Otto Hahn proved to be economically unviable to continue operations and the vessel was ultimately converted to a diesel-propelled vessel and was renamed.
Figure 5: NS Otto Hahn2
2 http://www.histarmar.com.ar/InfGral/B arcos-Nucleares/Fotos/NSOttoHahnorecarrier.jpg
LOA 172.05 meters
Beam 23.4 meters
Freeboard 5.3 meters
Displacement 25,790 LT
Cargo Capacity 14,000 tons
Research Personnel 35
Crew ~ 60
Cruising Speed 17 Knots
Reactor Thermal Power 38 MW
Reactor Type PWR
Table 2: Pertinent Naval Architectural Data for NS Otto Hahn
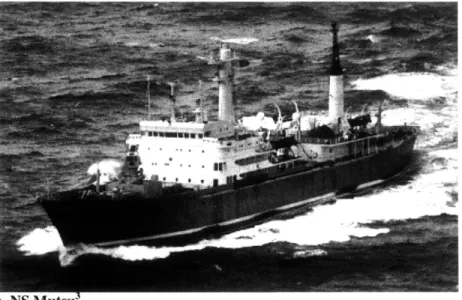
The third civilian merchant ship was built in Japan. Similar to the NS Otto Hahn, the NS Mutsu was to be a research vessel as well as a cargo vessel. However, the NS Mutsu was plagued with problems beginning in the construction phase. Commissioning of the vessel was schedule to occur in 1972, but as a result of problems with the ship's primary radiation shielding and several other nuclear related issues, the ship was not actually commissioned until 1990. The vessel did complete four short research voyages from 1990 to 1992, but never carried cargo. The ship ceased operations and was finally decommissioned in 1995.
Figure 6: NS Mutsu
3 http://img401.imageshack.us/img401/7608/nsmutsuoy1.gif
LOA 130 meters
Beam 19 meters
Draft 7 meters
Displacement 25,790 LT
Cargo Capacity 8,242 tons
Cruising Speed 17 Knots
Reactor Thermal Power 38 MW
Reactor Type PWR
Table 3: Pertinent Naval Architectural Data for NS Mutsu
The fourth civilian merchant ship was built in Russia and was commissioned in
1988. NS Sevmorput is a lash-carrier cargo ship that is also equipped with an ice breaking bow. It has been refueled once in 2003, and is currently still in service.
LOA 260 meters
Beam 32 meters Freeboard 12 meters Displacement 61,880 LT Cargo Capacity 33,980 tons Cruising Speed 20 Knots
Reactor Thermal Power 135 MW Reactor Type PWR
Table 4: Pertinent Naval Architectural Data Data for NS Sevmorput
1.2.3
Russian Nuclear-Powered Ice Breakers
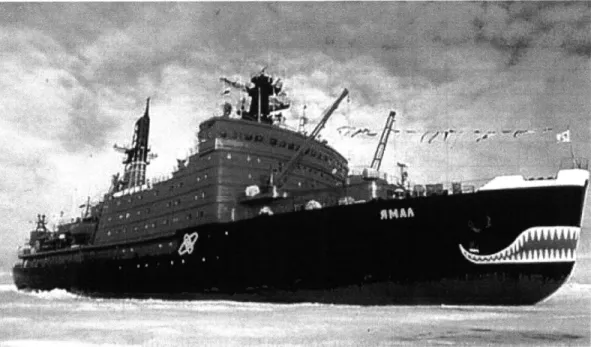
Russia also operates a fleet of nuclear-powered ice breakers. These ice breakers began operation in 1959 with the ship NS Lenin. Since NS Lenin, eight other nuclear-powered ice breakers have been built and operated by Russia. Of these eight ships, six are still in operation today, with the most recent one, the NS 50 Let Pobedy, beginning operations in 2007.
Figure 7: Russian Nuclear-powered Ice Breaker4
LOA 148 to 159 meters
Beam 30 meters
Draft 11 meters
Displacement ~ 24,000 LT
Maximum Speed 22 Knots
Number of Reactors 2
Reactor Thermal Power 171 MW per Reactor
Reactor Type PWR
Table 5: Pertinent Naval Architectural Data for Russian Ice Breakers
1.3 Thesis Outline
This thesis is organized into five chapters. Chapter 2 discusses the specific ship that was identified for the study, as well as stating the basic assumptions that were made during the study. Chapter 3 is the heart of the thesis. In this chapter, the various types of nuclear reactors and propulsion plant configurations are discussed and analyzed. The end result of Chapter 3 is that the nuclear reactor and the propulsion plant for the
nuclear-4 http://gcaptain.com/maritime/blog/wp-content/uploads/2007/09/nuclear-icebreaker.jpg
powered variant are selected. Chapter 3 also addresses some of the licensing issues that will need to be overcome in order to make the project possible, and offers a solution to those problems. In Chapter 4, the economics surrounding the project are analyzed in order to determine the commercial feasibility of the conceptual design. Finally, Chapter
5 contains the conclusion of the thesis and identifies areas that could be expounded on for future follow-on work.
2. Preliminary Design Considerations and Assumptions
2.1 Overall Design Philosophy
The design philosophy employed to develop the conceptual design was multi-faceted. Consideration was given to proven as well as unproven propulsion technology. The starting assumption, however, was that the ship would be nuclear-powered. Therefore, both proven and unproven maritime reactor technology was also extensively researched and evaluated. Robert Munton, the technical director of the British Commonwealth Shipping Company, made the following statement in 1966 in regards to how shipowners view new technology:
"The owner's consideration of any difference in ship design must essentially be concerned with the effect of that difference on the economics of operation throughout the ship's life. He is concerned with the total balance of earning power, amortized capital cost and operating cost. General experience indicates that in changing from a satisfactory
design to a new design of any item of machinery brings the risk of loss in availability time and unexpected costs for maintenance."(6)
One can conclude from Mr. Munton's statement that a shipowner is generally hesitant to change from a known good design to an unknown design, even if the unknown design has significant merit. In short, shipowners are averse to taking any kind of risk that is going to affect their profitability. For that reason, risk mitigation was considered as well. Since the starting argument for this study was that the ship was going to be powered by a nuclear reactor, every other design decision was based on mitigating future risk in the design. Therefore, the ultimate design philosophy for this project was based on mitigating risk to the maximum extent practical to the shipowner, while also striving to keep total costs as low as possible in order to ultimately maximize profitability for the
shipowner.
2.2 The Proposed Ship
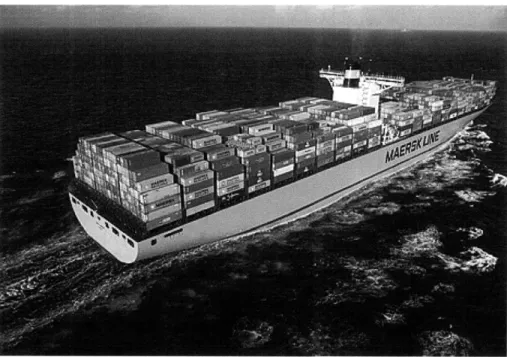
The baseline ship used for this project is the Emma Maersk, which can be seen below in Figure 8.
Figure 8: The Emma Maersk5
The principle naval architectural dimensions of the ship are listed below in Table 6(7).
LOA 397 meters
Beam 56 meters
Depth (molded) 30 meters
Displacement 120,000 LT
Cargo Capacity 11,000 + TEU
Crew ~13
Cruising Speed 25 Knots
Maximum Speed 31 Knots
Propulsion Power 110,000 SHP Maximum
Construction Cost US $145,000,000
Shipbuilder Odense Steel Shipyard Ltd
Table 6: Pertinent Naval Architectural Data for Emma Maersk
The Emma Maersk is the largest container ship ever built. It was built for the Maersk Shipping Company by the Odense Steel Shipyard located in Odense, Denmark. The Emma Maersk, along with the other ships that have been built to the same design, is the
current state of the art container ship and therefore was the obvious choice for this
5 http://gcaptain.com/maritime/blog/wp-content/uploads/2007/09/emma-maersk-underway.jpeg
analysis. The Emma Maersk is powered by a single 14-cylinder Wiirtsild diesel engine from Doosan Engine Co. developing 110,000 BHP or 80,080 kW at 102 revolutions per minute. This engine can be seen below in Figure 9(8).
Figure 9: Emma Maersk's Propulsion Diesel Engine
Also, five diesel generators with a combined power of 20,700 kW and one combined gas/steam turbine generator of 8,500 kW driven by the main engine exhaust are installed on the ship in order to supply the required cruise electrical load. Together, these generators provide the Emma Maersk with the possibility of producing 29.2 MW of electrical power. The ship is designed to be operated by 13 merchant mariners; however, accommodations are already provided for 30 total merchant mariners(7). The Maersk company lists the cargo capacity of the Emma Maersk as 11,000 TEU. However, most shipping industry experts believe that the actual cargo carrying capacity of the ship is significantly more than what the Maersk company is willing to publicly acknowledge.
Figure 10 shows one such estimate conducted by the marine industry data agency AXS-Alphaliner. AXS- Alphaliner estimates the actual cargo carrying capacity of the ship to be 15,212 TEU, as shown below in Figure 10(9).
Figure 10: Estimated Cargo Capacity of the Emma Maersk
The cargo carrying capacity of the ship is an important item, since that is how the ship earns money for the shipowner. This study will assume the initial actual cargo carrying capacity of the Emma Maersk to be 15,212 TEU, as calculated by AXS-Alphaliner.
2.3 Other Assumptions
The Maersk company declined my request for specific information about their ship. Therefore, many of the ship characteristics had to be estimated using sound engineering principles and judgement.
The trade route selected for this analysis was a route that runs from Shanghai, China to Los Angeles, California. This trade route is estimated to be 6,000 nautical miles in length. This two-port trade route was selected because it was considered to be the most viable route since it would minimize the number of ports that would have to be upgraded to in order to provide the necessary husbandry services for the design vessel. Furthermore, these two ports are among the largest and most modern shipping ports in
the entire world. Since ports-of-call of a nuclear-powered vessel are going to be required to provide services that a conventional port-of-call would not, the assumption was made that only the largest of ports would be willing to make the required accommodations. For example, a nuclear-powered ship is going to require more in-port security then a standard conventional ship.
3. Detailed Analysis
3.1 Determination of Basic Requirements
Based on publically available data, a propulsion analysis was performed on the Emma Maersk, and a speed versus power curve was developed. This curve can be seen below in Figure 11. This curve was developed using Equation 1 below.
Peff = C1v3s Equation 1
Where: Peff is the effective shaft horsepower C1 is a constant
vs is ship's speed in knots
Despite the fact the C1 is a function of many factors (ship speed, ship size, hull geometry
sea state, water depth, fouling, etc.), it generally does not vary significantly over the range of operations. Therefore, it was assumed to be equal to a constant value for the purposes of this analysis. The purpose of developing this curve was to determine the required reactor thermal power output.
Speed vs. Power
200000 A 160000 B 120000 0 1 80000 0 40000 0 5 10 15 20Ships Speed (knots)
25 30 35
Figure 11: Speed vs. Power Curve for the Emma Maersk
The required reactor electrical power output and the required reactor thermal power output is not the same. The difference between the electrical power requirement and the thermal power requirement of the nuclear reactor is based on the assumption of a
33% efficiency for the baseline nuclear reactor. This is a very conservative assumption
for a modern nuclear reactor. For example, the United States Advanced Pressurized Water Reactor (US-APWR) has a thermal efficiency of 39%(10).
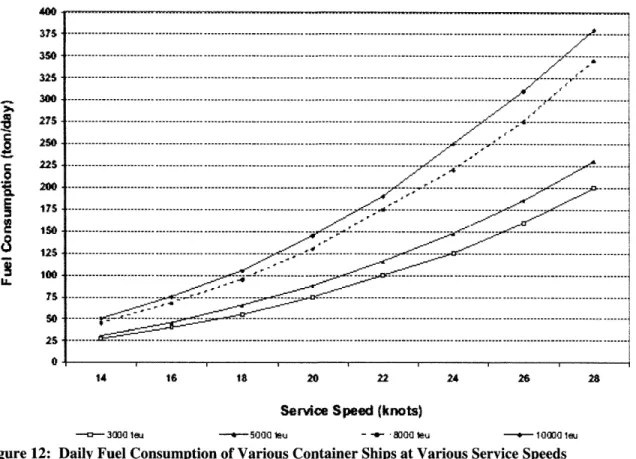
As Equation (1) and Figure 11 show, the ship's speed and the required shaft horse power needed to develop that speed are related to one another via a cubic relationship. There is a tremendous amount of additional power required to propel a ship of this size at a relatively high rate of speed. This is exactly as one would expect. As can be seen in Figure 11, the ship needs 63,647 SHP to go 25 knots, and it requires 110,000
SHP to go 31 knots. Thus, simply to increase the ship's speed from 25 knots to 31 knots requires almost double the SHP. Also worth noting is the fact that the fuel consumption
---
of a marine engine also follows a very similar cubic relationship. This is evident as seen below in Figure 12(11). 400 - 00 --- - ---37S --- ---.. . 3S0 --- --- W ---. . rn---... 3- 3 -0--- --- ---5--- --- --- --- _--- --- --- ---2W --- 7---poe them, t.c 2M -- ---- --- --- -- -- --- -- --- --- --- - --- ---- --- --- - - ... . 175 ---- --- --- ;I&I ... - - ... --- ---130 --- --- --- --- ---- --- ---1--- -- --- --- - -
---"-3
-.
-75 ---- - --- --- - - - - - - - - - - - - ---14 1 is 20 22 24 26 28Serice Speed (knots)
MOO~ leu *u - -- - 8KGG10eu 101
Figure 12: Daily Fuel Consumption of Various Container Ships at Various Service Speeds
Therefore, it becomes obvious that higher speed ships require bigger engines to propel them, and these engines consume fuel at a much higher rate when they operate at higher speeds. Also, bigger engines occupy more space and weigh more. This of course results in a loss of cargo carrying ability for the cargo ship, which in turn will decrease profitability to the shipowner. For the purposes of this conceptual study, it is assumed that the cruising speed of the nuclear-powered ship variant will be the same as for the conventionally-powered ship, namely 25 knots. Therefore, as mentioned previously, we need to develop approximately 63,647 SHP to propel the ship at its cruising speed. Cruising speed is defined as the speed a ship can go when its propulsion motor is operated at 85% of its maximum continuous rating. As will be discussed in Section 3.3,
this power will be provided by two 36.5 MWe propulsion motors. This alone corresponds to a required reactor thermal power output of approximately 219 MWth. The ship also has electrical loads needed for additional reactor support systems as well as for refrigerated cargo and hotel services. The various estimated values for these are shown in Table 7 below. Therefore, the total reactor thermal power output proposed for this design is 350 MWth.
Propulsion Motors 73 MW 219 MW
Refrigeration
20.7 MW 62 MW
Hotel Loads
Reactor Auxiliary Loads 14 MW 42 MW
Margin 9 MW 27 MW
350 MW Total Table 7: Reactor Power Basis Breakdown
The margin load takes into account the transmission losses associated with the propulsion motors. The Refrigeration and Hotel load was estimated based on the available installed power of the actual Emma Maersk. The reactor auxiliary load was estimated based on the study done by Stroud and Sawyer in (1). A discussion of the benefits and drawbacks associated with producing a larger reactor to propel the ship faster is discussed below.
One of the aspects considered during this design was the speed requirement. It is obvious from a cursory analysis that a faster speed would be more desirable then a slower
speed. Consider a fleet of ships operating on the proposed trade route. If a shipping company had a fleet of six 10,000 TEU cargo ships operating on this route traveling at an average speed of 25 knots, then it could move 60,000 TEUs every 240 hours (every 10 days). If the speed of the fleet were increased to 35 knots, then the same amount of cargo could be moved every 171 hours (every 7.14 days). This would translate to 11 more port visits per year for the higher speed fleet, which means that 660,000 more TEUs would be transported by the faster fleet each year. Or, if looked at in terms of the number of ships in the fleet, the same amount of cargo that is carried by a fleet of six ships travelling at an average speed of 25 knots could be carried by a fleet of only 4 ships if those ship travelled at an average speed of 35 knots on our proposed trade route. However, as is evident from Figure 11, there is a penalty to be paid in terms of powering for this increase in speed. This extra power comes in the form of extra weight and space needed for larger propulsion equipment and associated systems, which in turn reduces the amount of cargo that the ship is able to ultimately carry. In the case of a nuclear-powered vessel, this would also result in a larger nuclear reactor, which in turn would further reduce the amount of cargo that a ship could carry from port to port. Furthermore, the higher the speed of a ship, the higher the dynamic forces that the ship will be exposed to as it transits the open ocean. While a well-designed ship will be able to withstand these forces without experiencing any structural problems, the cargo that is being carried above the deck might not be able to. This phenomenon, called slamming, is something that must not be overlooked when considering the actual need for speed in the design of a cargo vessel. Certainly, it is logical to assume that a shipowner would prefer that his ship arrive in port later with none of the cargo damaged then earlier with a significant amount of
cargo damaged. Therefore, in keeping with the design philosophy of minimizing risk to the shipowner, the decision was made to keep the cruising speed for the nuclear-powered variant the same as the actual Emma Maersk.
3.2 Reactor Design
3.2.1 Choosing the Type of Reactor
Once the required thermal output of the reactor was determined, efforts shifted to developing a conceptual design for the reactor core that would meet this requirement. The starting point for this part of the project was to research and subsequently select the type of reactor that would be used for the ship. There are major differences between a reactor that is going to go on a ship and one that is going to be land based. Some of these basic considerations are as follows:
1. The design must consider the possible adverse effects of flooding. 2. The design must consider watertight integrity between compartments.
3. The design must take into account the constraints of being on a ship; namely volume and area constraints.
4. The design must consider the weight of the reactor and the placement on the ship, as this will essentially be a point load which could potentially affect the bending moment of the ship.
5. The design must take into account the increased likelihood of seawater corrosion of the various structural elements of the ship.
6. The design must take into account that the ship and therefore the reactor will be subjected to 6 different types of motions. A shipboard reactor will be subjected to
the same external motions as the ship that it is installed on (12). These six different types of motions can be seen below in Figure 13.
Yaw
Roll
y
Figure 13: Motions of a Ship6
Surge Motion is the movement of the ship in the forward direction. Sway is the lateral translational motion of a ship.
Heave is the up or down vertical translational motion of the ship. Roll is transverse angular motion of the ship.
Pitch is oscillatory (teeter-tooter) motion of the ship.
Yaw is the weaving motion of the ship to port or starboard(13).
Four different reactors types were investigated and analyzed for application to this project. The first reactor type analyzed was the pressurized water reactor (PWR). The PWR has the advantage of being the reactor of choice for all but one US Navy nuclear-powered vessel, and also being the reactor of choice for all previously attempted commercial nuclear-powered vessels. The PWR has proven to be technically feasible in
6 http://www.worldwideflood.com/ark/basichulldesign/degrees
of freedom.jpg
all maritime endeavors thus far. A schematic of a PWR was shown previously in Figure 3 above. In PWR designs, the nuclear reactor produces heat which is transferred to primary coolant circulated via a reactor coolant pump. This primary coolant then transfers its heat to a secondary system via a steam generator. In the steam generator, feedwater absorbs sufficient heat from the primary system to become steam which in turn drives steam turbines which produce the required electrical power needed and also the required thrust required for shaft propulsion power. Exhaust steam from the turbines is condensed in a condenser, and is subsequently pumped back into the steam generator as feedwater, where the cycle repeats. The primary system and the secondary system are not the same.
The next reactor type considered for this project was the Boiling Water Reactor (BWR). A schematic of a BWR can be seen below in Figure 14.
Boiling Water
Reactor System
A BWR power cycle is essentially a Rankine cycle. In a boiling water reactor, the heat necessary to make the steam for the turbines is still generated in the core. However, unlike in the PWR, the steam that is used to turn the turbine which makes the required electrical power is also produced in the core. Thus, there essentially is no secondary system, and the steam potentially contains radioactive impurities as a result. Some preliminary developmental work on marine BWRs has been conducted in Europe. However, this work has generally focused on the reactor's response to ship motions instead of focusing on reducing the required volume of the plant. Generally speaking, BWRs have a much lower power density then a typical PWR, and therefore the reactor plant tends to be larger. This lower power density does not make its physical size
particularly compatible with ship dimensions at high power ratings(14).
The third type of reactor considered for this project was the Sodium Cooled Reactor (SCR). Liquid sodium has superior heat transfer characteristics, making it an almost perfect reactor coolant choice. The SCR consists of three separate circulating loops, as can be seen below in Figure 15(15).
CONTROL THIMBLES
INTERMEDIATE
PRIMARY LOOP LOOP
- (SODIUM) (SODIUM EVAPORATOR
VT= VAPOR TRAP FISSION RADIACTVE ER
CTa COLD TRAP
ETx EXPANSION
--TAK!E 7 r INTE RUPE RIATAT
In the primary loop, liquid sodium is pumped through the reactor where it removes the heat generated from fission. The sodium coolant temperature leaving the reactor is about 950F. The coolant then flows through a second heat exchanger where it transfers heat to liquid sodium in the intermediate loop. The sodium coolant pressure in the intermediate loop is higher than the sodium coolant pressure in the primary loop so that if a leak were to develop, no radioactive sodium would leak into the intermediate loop. Finally the sodium coolant of the intermediate loop transfers its heat to water in the boiler of the secondary loop in order to make the steam that drives the turbines.
This type of reactor was actually built and operated by the US Navy on the USS Seawolf (SSN-575). The reactor was only operated for three years before it was replaced with a pressurized water reactor due to technical problems(16). The major problem associated with the USS Seawolf's SCR was in the superheaters of the secondary system. The technology of the time simply was not up to par for the design.
The fourth type of reactor considered for this project was the Marine high temperature gas cooled reactor (MGCR). This reactor was studied extensively in the 1970s, and is considered to be a very good design. A detailed design of such a plant was even proposed by several companies, including Westinghouse and the General Atomics Corporation. The reactor was designed to be moderated by BeO and contained fuel that was enriched to a level of 10.5% and was cooled with helium gas(14). The high temperatures that are produced in the cycle require advanced materials in many of the components that will be discussed below. A schematic representation of the MGCR is shown below in Figure 16(15).
GAS MAKEUP ANO CHARGE BOTTLES
COMPRESSOR-BLOWER
Figure 16: MGCR Concept Cycle Diagram
In the MGCR, helium leaves the reactor at very high temperatures (1700 F) and flows into the high pressure turbine. The HP turbine drives the low pressure compressor and high pressure compressors. Helium leaving the high pressure turbine then flows through the low pressure turbine, which is the power generating turbine, and is then directed into a recuperator. Helium from the compressor outlet is pre-heated prior to being returned back to the reactor by the helium flowing from the low pressure turbine.
This has the obvious effect of increasing the overall cycle efficiency, which can be as high as 40% for a well designed plant. After passing through the recuperator, the helium flows through a pre-cooler prior to flowing through both of the compressors to raise the pressure of the helium back up to around 1500 psi before it completes the cycle and returns back to the reactor.
The MGCR has a number of advantages, though it has not been installed and operated on any ship, either civilian or military. For starters, the specific weight of the
reactor plant itself is 1/5 the specific weight of a PWR(17). This means that the plant would be significantly smaller then a PWR for the same output power. Obviously, a smaller propulsion plant would translate to more cargo carrying space for a ship. It also is estimated to be around the same cost of a similar power producing PWR(17). This estimate is based on the thought that the cost reduction that would be seen from the reduction in material requirements needed for the plant would just about offset the cost addition caused by the requirement for advanced materials. The estimate also assumes that the cost of the uranium fuel in the reactor is approximately the same for a PWR and the MGCR(18).
In order to ensure that the best choice was made in regards to reactor type, a method of analysis called the Pugh Method was employed. This selection method was developed by Stuart Pugh during the 1980s. The Pugh Method concept selection seeks to narrow the number of concepts quickly and provides a unique way to incorporate strengths of rejected concepts into the dominant design, potentially generating a stronger overall concept. The process has two primary components, concept screening and concept scoring. The concept screening component has five steps. In the end, a broad variety of concepts are evaluated with respect to customer needs through converging on strengths and, at times, diverging to combine existing or inspire new concepts at different steps in overall concept selection. The first step is to prepare a selection matrix. An example of a generic Pugh matrix is presented below in Table 8(19).
Datum
Concept I
Concept 2
Concept
3
Need 1
Need
2
A
S
+
+
Need3
T
+
S
Need 4
U
S
+
S
Sum
+'s
M
1
3
1
Sum -'s
1
0
2
Table 8: Example Pugh Method Matrix
The left most column of the matrix contains selection criteria obtained by focusing on primary customer needs. Concepts that have been identified for analysis are listed across the top of the matrix. The next step is to rate the concepts. A datum or reference concept is selected for comparison. Each concept is then compared to the datum. For example, the question would be asked if concept 1 is better or worse at meeting need 1 than the datum. If the concept is better a "+" is entered in the respective cell. If the concept is as good as the datum a "S" is entered. If it is worse a "-" is entered. Once the entire Pugh chart is filled out, the first round is complete. The next step is to calculate the net score by summing the results. After determining the best concept, design work can then begin on that concept(19).
The Pugh Matrix for the reactor selection is shown below in Table 9. The PWR was chosen as the Datum, since it has been the reactor of choice for all previous ships. The categories that each reactor was scored on were developed after consulting with several individuals with significant shipboard reactor experience.
BWR SCR
Table 9: Reactor Selection Matrix
The original design philosophy called out for this project required that financial risk be minimized to the shipowner. The best possible way to mitigate the risk to the shipowner in regards to reactor choice is to select the PWR, therefore the BWR, SCR and the MGCR were given negative scores for the Risk category. In the Safety category, all reactors were determined to be the same, since any reactor built would have to ultimately meet the licensing requirements of an external agent. In the cost category, the BWR, SCR and MGCR were evaluated as worse than the PWR due to the fact that additional Research and Development funds would need to be spent before any of these reactors could be built. In the Size category, both the BWR and the SCR were evaluated as worse than the PWR, and the MGCR was evaluated as better than the PWR. Finally, in regards to complexity, the BWR, SCR, and the MGCR were evaluated as being worse than the PWR. After evaluating the results obtained from the Pugh Matrix, the PWR was the reactor type that was selected for this project. Despite the choice of a PWR for this endeavor, the author believes that the MGCR is the reactor that would ultimately be the most suitable for this application. However, until a prototype reactor is built, operated, and analyzed extensively, it will not be a suitable choice for a shipowner.
3.2.2 Core Design
Once the reactor type had been selected, a preliminary core analysis could be conducted. The design of the reactor core was performed under the following constraints, which were consistent with the previous analysis:
* The reactor selected for the ship was a pressurized water reactor (PWR). The PWR was selected because it is a proven reactor type that has been used
extensively in naval applications.
* The core was to be limited to a maximum enrichment level of 20%. This is based on the fact that 20% is the highest enrichment level available to non-government entities.
* The total operating lifetime of the reactor core was to be either five years or ten years. This decision was made to ensure that a reactor refueling could be performed in conjunction with the required ABS dry-docking inspections in order to minimize the down-time of the ship.
* The final constraint was that the level of discharge burn-up was limited to 60,000 MW-day per kilogram. This is the highest fuel burn-up that has been seen in modern nuclear reactors.
Also, the decision was made to design the core using standard nuclear fuel assemblies. Again, this decision was made in order to adhere to the original design philosophy. Therefore, the type of fuel assembly selected was a standard 17x17 Westinghouse design. A picture of this assembly can be seen below in Figure 17 and Figure 18 (20).
The standard assembly is 21.5 cm in width, and 366 cm in height. The volume of the
assembly (Va) was determined as shown below:
Va = W2H = (21.5)2(366) = 169,183.5 cm3 = 169.2 Liters
There are 289 pins per assembly, and of those, 264 are fuel pins (represented by the gray circles).
Rod Cluster Control Assembly
Bottom Nozzle--'Gridtom pring
Instrument Thimble Tube Figure 18: Standard 17x17 Fuel Assembly
The total thermal power produced by any given fuel assembly is governed by Equation 2 below:
Pa = Va x PDE Equation 2
Where: Pa is the Power per assembly
PDE is the power density of the reactor
The PDE of the reactor was a design variable. Modern commercial Pressurized Water Reactors have power densities of over 100 KW/L (21). However, shipboard propulsion reactors typically have a much lower power density. Since power density for a propulsion reactor is a measure of its size and weight, it is desired to have as high a power density as is practical. But, as PDE gets bigger, the total core operating lifetime gets smaller. After several iterations, the PDE for this design was determined to be 55.9
KW/L. This resulted in a Pa of 9458.28 KW per assembly.
Once the power per fuel assembly was known, the total number of fuel assemblies required to be installed in the core could be calculated. This calculation is governed by Equation 3 below:
Equation 3 Using Equation 3, the total number of fuel assemblies needed for this design was calculated to be 37. Once the total number of fuel assemblies required for the core was known, the actual core could be arranged. Reactor cores are designed to be axis-symmetric. Therefore, the core proposed for this design is as shown below in Figure 19.
Figure 19: Proposed Concept of Core Design
In order to validate the early concept design for the reactor core, a computer program called CASMO-4 was used. CASMO-4 is a fuel assembly burn-up program. CASMO-4 is a multi-group two-dimensional transport theory code for burn-up calculations on BWR and PWR assemblies or simple pin cells. The code handles a geometry consisting of cylindrical fuel rods of varying composition in a square pitch array with allowance for fuel rods loaded with gadolinium, burnable absorber rods,--
-I I
cluster control rods, in-core instrument channels, water gaps, boron steel curtains, and cruciform control rods in the regions separating fuel assemblies(22).
The required input cards for CASMO-4 were varied in order to produce the maximum core-life possible with the highest PDE, within the constraints imposed by the required periodicity of ship classification society inspections. As stated earlier, it was the entering desire to have a core that would last for either five or ten years. The ultimate computer model used for CASMO-4 and the final output can be viewed in Appendix A.
Bo Feng, a PhD candidate from the Department of Nuclear Science and Engineering, provided assistance in the development of the CASMO-4 routine.
In order to achieve a core life of ten years, the number of reactor effective full power hours (EFPH) determined by the CASMO-4 program had to be higher than 70,000 EFPH. Note that this value for the capacity factor was determined by performing a conservative analysis on data provided by a shipping industry source. Commercial cargo ships operate continuously, with very minimal downtime. Since it is envisioned that the reactor will operate at close to maximum power rating during open-ocean transits, and then at reduced power during piloting and while in port offloading and onloading cargo, the 80% value used in this analysis is a solid estimate.
This value of ten years for the core lifetime was arrived at as shown below:
Core Life = umber of EFPH Year _=(70,000 EFPH Year
Capacity Factor 8760 hours 0.8 8760 hours = 10 years
The CASMO-4 output results clearly shows that a ten year core life is possible with a capacity factor of 80%. This conclusion was made after a careful review of the pertinent output results from CASMO-4. Specifically, by reviewing the generated values for K-infinity and ensuring that its value never dropped below the critical value, we are sure that the reactor will be capable of being critical for its entire design life. K-infinity, the infinite multiplication factor, is defined as the ratio of the neutrons produced by fission in one generation to the number of neutrons lost through absorption in the preceding generation(23). It is defined mathematically by Equation 4 below:
neutron production from fission in one generation
Koo = Equation 4
neutron absorption in the preceding generation
In order for a nuclear reactor to maintain criticality, at least one neutron from fission in the previous generation must go on to produce a fission event in the next generation. What K-infinity does not take into account is the effect of neutrons leaking out of the core. Therefore, another parameter known as the effective multiplication factor (Keff) must be determined. Keff is defined mathematically below in Equation 5.
Keff = KoofEth;f Equation 5 Where: £th is the thermal neutron non-leakage probability
£f is the fast neutron non-leakage probability
In order for a nuclear reactor to be capable of sustained operations, Keff must be greater than one. However, CASMO-4 outputs the value of Kinf that it determines will be required to have a value for Keff that is equal to one. A typical value of neutron leakage from a large reactor is approximately 3%. More neutrons leak from a smaller core than they do from a larger core. For conservatism, the assumption was made that our reactor should be able to sustain 10% neutron leakage. Therefore, in order to account for this
neutron leakage, the critical value needed for Kinf at the end of core life was determined to be 1.10. A plot of the end of core life value of Kinf taken from CASMO-4 versus the percentage of Uranium-235 enrichment is shown below in Figure 20.
1.3
1.2 - - -
-1.1f -.--.- .-...---- -. - - .
0 5 10 15 20
Percent U-235 Enrichment
Figure 20: Graph of the Infinite Multiplication Factor vs. U-235 Percent Enrichment
Figure 20 clearly shows that the proposed reactor core will be sufficient at a Uranium-235 enrichment level of 10%.
3.2.3 Basic Concept of Reactor Operations
The general concept of reactor operations is based on that employed in a commercial power reactor. Namely, it is desired to operate the the reactor at as close to the maximum rated power level as possible while seeking to minimize power transients. This will likely be possible only during the open-ocean transit between the two ports-of-call.
3.2.4
Refueling
Since the reactor is designed to have a ten-year core lifetime, it will only be necessary to refuel the core once. Therefore, unlike for a commercial nuclear power reactor that requires refueling about every eighteen months, no special refueling systems
were incorporated into the design. It is envisioned that the reactor will be refueled using technology that already exists. The general refueling plan is quite simple and is as follows:
1. Disconnect the control rods and their drive mechanisms. 2. Remove the reactor vessel head from the reactor vessel. 3. Install extension sleeve on top of the reactor vessel. 4. Remove reactor internals.
5. Install lead-lined handling casket on top of extension sleeve.
6. Open the coffin.
7. Lift spent fuel elements one at a time into the handling casket. 8. Close the casket.
9. Lift casket off of reactor vessel and transfer it to the location where the spent fuel is going to be stored.
10. Unload fuel from casket into the transfer storage cart.
11. Repeat steps 6 through 9 until all spent fuel assemblies have been removed. 12. Inspect reactor internals and make repairs as needed.
13. Install new fuel elements into the reactor. 14. Install reactor internals.
15. Remove extension sleeve.
16. Install reactor vessel head and reconnect control rods and their drive mechanisms(15). Obviously, each step mentioned above requires an extensive amount of planning and work. However, refueling is a process that certain American shipyards, such as Northrop Grumman Newport News, are familiar with and fairly proficient at. Therefore, the author
of this thesis believes that the refueling of the reactor will not be an overly taxing evolution in the life of the ship.
3.3 Propulsion Plant Selection
In order to select the machinery needed to propel the ship, a careful analysis of the various propulsion systems and their associated configurations was conducted. This was an important analysis because even in modern ships, propulsion systems are so large and heavy that in many applications they force the rest of the ship to be constructed around them. Machine sizes and their locations also reduce the space available for cargo(24). Putting in the right configuration is vital to maximizing economic profitability. Therefore, in order to propel the ship, three separate propulsion configurations were researched and evaluated.
The first type of configuration analyzed was the direct drive configuration. In the direct drive configuration, the prime mover is directly coupled through a shaft to the propulsor. This is the current configuration that exists on the Emma Maersk, and is the configuration that exists on the majority of large conventionally-powered cargo ships. This configuration has the obvious advantage of minimizing the number of pieces of equipment in the propulsion train, as well as offering fairly high efficiencies when compared to other propulsion configurations. However, it would not be compatible with a nuclear reactor unless the propulsion turbine had an excessive amount of stages in order to reduce its speed to that compatible with the propulsor. For this reason, direct drive systems were not considered for further analysis in this project.
The second configuration investigated was the standard gear-driven assembly configuration. An example of this type of propulsion train can be seen below in Figure 21(25).
Ame LaILOW STlut
generally very efficient. From the figure, one can see that the propeller would ultimatelyline components. The major disadvantage of this type of arrangement is that it takes up a
&;Ogg CXWP.UNO
this project, the standard main engine configuration would consist of separate main
configuration was not selected because of the weights associated with the configuration as well as the space lost as a result of the required shafting and associated shaft line components.
The other propulsion configuration considered was the integrated electric drive system, whereby electrical power produced from some source is used to propel the ship via electric motors. A basic example of this type of propulsion system, showing the relative efficiency of each component, can be seen below in Figure 22(26).
TI= -0.96
l=--0.96
11= -0.97
Main Power
Prime Mover
Figure 22: Simplified Electric Propulsion System
Similar to the other propulsion arrangement, this configuration has also been used for many years and is also highly efficient. However, the electric propulsion configuration offers the naval architect / ship designer almost unlimited flexibility in propulsion arrangement. This is because the large shaft line seen in Figure 21 is essentially eliminated and is replaced with power cable runs which are easily placed wherever necessary. The length of the shaft line is reduced significantly in electrical propulsion arrangements, and could even become zero if the decision was made later on to use a podded propulsor. Furthermore, the requirement to maintain strict alignment over very long lengths from the prime mover to the propeller is also eliminated. Another advantage of electrical propulsion systems is that they give the ship operators' much needed flexibility through the ability to only use the minimum amount of electricity
generating equipment for their required operational need (24). Because of the better arrangeability given by the electric propulsion system, it is a superior system for this application. Ultimately, an integrated electric motor propulsion system was selected. This was also in keeping with the spirit of the original design philosophy. These electrical motors are coupled directly to a gearing system which in turn propels the ship through the water via the propellers. This decision proved advantageous for another reason, in that it enabled the elimination of steam turbines for propulsion. Instead, this design decision only requires steam turbines for electrical power generation. Granted these steam turbines, henceforth referred to as Ship's Service Turbine Generators (SSTGs), are now going to have to be larger than if they were only used to produce electrical power. However the elimination of turbines for propulsion reduces the overall footprint of the engineroom by eliminating additional turbine support systems.
After settling on the choice of propulsion system, it was then necessary to select the major components that were to be included in this design. First, it was necessary to see if there existed a suitable electric motor that would be able to propel a ship the size of the Emma Maersk Nuclear variant of this project. If a suitable motor was unable to be found, then the previous design decision would have to be re-evaluated. Currently there are few motors on the market that are capable of producing the required thrust needed for our ship. However, after significant research, a suitable motor was found. This motor, designed and manufactured by the American SuperConductor Company, is capable of producing 36.5 MW (48,927 SHP) of thrust to a propeller shaft. The specification for this motor, along with a picture of the motor relative to older propulsion motors is shown below in Figure 23.