Publisher’s version / Version de l'éditeur:
Vous avez des questions? Nous pouvons vous aider. Pour communiquer directement avec un auteur, consultez la première page de la revue dans laquelle son article a été publié afin de trouver ses coordonnées. Si vous n’arrivez pas à les repérer, communiquez avec nous à PublicationsArchive-ArchivesPublications@nrc-cnrc.gc.ca.
Questions? Contact the NRC Publications Archive team at
PublicationsArchive-ArchivesPublications@nrc-cnrc.gc.ca. If you wish to email the authors directly, please see the first page of the publication for their contact information.
https://publications-cnrc.canada.ca/fra/droits
L’accès à ce site Web et l’utilisation de son contenu sont assujettis aux conditions présentées dans le site LISEZ CES CONDITIONS ATTENTIVEMENT AVANT D’UTILISER CE SITE WEB.
Research Report (National Research Council of Canada. Institute for Research in
Construction), 2010-09-30
READ THESE TERMS AND CONDITIONS CAREFULLY BEFORE USING THIS WEBSITE. https://nrc-publications.canada.ca/eng/copyright
NRC Publications Archive Record / Notice des Archives des publications du CNRC :
https://nrc-publications.canada.ca/eng/view/object/?id=24aa7d6c-12b4-4fec-aa79-920d575d319c https://publications-cnrc.canada.ca/fra/voir/objet/?id=24aa7d6c-12b4-4fec-aa79-920d575d319c
Archives des publications du CNRC
For the publisher’s version, please access the DOI link below./ Pour consulter la version de l’éditeur, utilisez le lien DOI ci-dessous.
https://doi.org/10.4224/20374532
Access and use of this website and the material on it are subject to the Terms and Conditions set forth at
Lighting and Office Renovation Effects on Employee and
Organizational Well-Being
Light ing a nd Offic e Re nova t ion Effe c t s on Em ploye e a nd
Orga niza t iona l We ll-Be ing
I R C - R R - 3 0 6
V e i t c h , J . A . ; N e w s h a m , G . R . ; M a n c i n i , S . ;
A r s e n a u l t , C . D .
S e p t e m b e r 2 0 1 0
The material in this document is covered by the provisions of the Copyright Act, by Canadian laws, policies, regulations and international agreements. Such provisions serve to identify the information source and, in specific instances, to prohibit reproduction of materials without written permission. For more information visit http://laws.justice.gc.ca/en/showtdm/cs/C-42
Les renseignements dans ce document sont protégés par la Loi sur le droit d'auteur, par les lois, les politiques et les règlements du Canada et des accords internationaux. Ces dispositions permettent d'identifier la source de l'information et, dans certains cas, d'interdire la copie de documents sans permission écrite. Pour obtenir de plus amples renseignements : http://lois.justice.gc.ca/fr/showtdm/cs/C-42
Lighting and Office Renovation Effects on Employee and
Organizational Well-Being
Jennifer A. Veitch, Guy R. Newsham, Sandra Mancini, and Chantal D. Arsenault
NRC-IRC Research Report RR-306
September 30, 2010
National Research Council Canada Institute for Research in Construction Ottawa, ON, K1A 0R6, Canada
NRC-IRC project 44-B3230
Produced under subcontract 20116 from Pacific Northwest National Laboratory for the Light Right Consortium
Light Right is managed by Pacific Northwest National Laboratory under U.S. Department of Energy Contract No. DE-AC05-76RL01830
Lighting and Office Renovation Effects on Employee and Organizational Well-Being
Jennifer A. Veitch, Guy R. Newsham, Sandra Mancini, and Chantal Arsenault
Executive Summary
Building on the Light Right Albany experiments, this investigation was designed to achieve two objectives:
1. To replicate the results of the Light Right Albany experiments in a functioning work setting.
2. To extend the model developed from the Albany data to organizational effectiveness outcomes.
Research Design
The project was designed around a linked mechanisms map (Figure ES1). As in the Albany
experiments, each concept in the linked mechanisms map had at least one associated
measurement.
The experimental design was a naturally-occurring field
experiment. The host organization has undertaken a major
renovation of three office buildings, involving both
furnishings and lighting. Individual floors in all buildings will be renovated in phases over several years. During the study period (May 2008-September 2009), both old (pre-renovation) and new (post-renovation) conditions existed in the buildings. The old lighting consisted of recessed parabolic-louvered luminaires (similar to the Base Case condition in the Albany experiment 1), and the new lighting consisted of
workstation-specific individually-controllable suspended direct/indirect luminaires (similar to the Dimming Control condition in the Albany experiment 1). Figure ES2 shows the three conditions.
Figure ES1. Proposed conceptual model. The black lines
indicate relationships observed in the Albany experiments. The blue lines are relationships derived from other research. The red dashed line is based on anecdotal evidence.
Health Lighting Appraisal Mood Motivation Creativity Operational Efficiency Lighting Design Environmental Satisfaction Individual Control Room Appearance Luminous Conditions Intent to Turnover Job Satisfaction Organizational Commitment
Figure ES2. Workstation views of furnishings and lighting conditions. Left: Old teal furnishings and old
lighting. Middle: Old grey furnishings, new lighting. Right: New furnishings, new lighting.
All occupants of the three buildings were asked to complete an online questionnaire on three
occasions during the study, in May-June 2008 (T0), June 2009 (T1), and September 2009 (T2).
Each time, the questionnaire included questions and tasks to assess the individual-level concepts in the linked mechanisms map. Each measurement wave included a site visit by the research team, during which the physical conditions in selected locations were measured. Some of the participants moved to newly-renovated offices between the first and second measurement waves; others had already moved to new or newly-renovated spaces before the first wave; and others did not experience any office design or lighting changes during the study period.
Between-groups and repeated-measures statistical analyses were performed on planned comparisons between groups differing in lighting conditions, or in the availability of individual (personal) control over lighting, or in office furniture and layout, to determine the effects of the new lighting, the effects of the new furnishings, and the incremental benefit of adding individual control over lighting. Additional analyses tested the relationships between the concepts in the linked mechanisms map.
Results
Workstation-specific lighting with individual control is the higher-quality lighting solution.
Workstation-specific lighting with individual (personal) control was preferred over parabolic-louvered luminaires regardless of the surface reflectances of the furnishings. The workstation-specific luminaires with individual control were rated as providing lighting that was better than in other similar workplaces; the parabolic-louvered luminaires were seen as being the same as in other similar workplaces. In the most sensitive statistical tests, small effects were found for several outcomes. Pleasure, room
attractiveness and illumination, lighting satisfaction, overall environmental satisfaction, job satisfaction and organizational commitment were all higher for the people in offices with workstation-specific luminaires. The frequency and intensity of physical symptoms and the intent to turnover were all lower for the people in offices with workstation-specific luminaires.
Figure ES3. Group means for the overall comparison between
responses from people in workstations lit with parabolic-louvered luminaires, compared to those with workstation-specific direct-indirect luminaires with individual control, all with low-reflectance, old furniture. All differences are statistically significant. 1 2 3 4 5 6 7 Satis. w/ Lighting
OES Job Satis Org'l Commit. Intent to Turnover Me a n Sc a le Sc o re PARAB WS‐60U‐C
Several previous laboratory and field investigations have found that people prefer to control the local lighting in the workstation, and this investigation found no effects that were contrary to the expected direction. Figure ES3 shows some of the results in graphical format.
Room surface reflectances influence lighting quality. Workstation-specific luminaires with
individual control were more likely to be rated as being better than in other similar offices when the surface reflectances were high. The workstation was also judged to be more attractive and to be more highly illuminated, and to deliver a better workplace image.
Luminous conditions matter to organizational productivity. We tested the overall linked
mechanisms map using structural equation modelling. The best-fitting model was based on the Albany experiments’ linked mechanisms map. As shown in Figure ES4, luminous conditions (rated on a scale from parabolic/low reflectance to workstation-specific-control/low reflectance to workstation-specific-control/high reflectance) predicted lighting appraisals, and these in turn indirectly related to reduced health problems and to reduced intent to turnover.
Discussion
This field investigation achieved both objectives. The basic findings from the Albany experiments were replicated, in that we obtained clear evidence that the workstation-specific direct-indirect luminaires with individual control deliver a high-quality work environment for occupants. Moreover, we replicated the appraisal path from the Albany linked mechanisms map
and extended it to include organizationally-relevant outcomes. The best-fitting model links these luminous conditions to higher ratings of room appearance; more favourable mood; fewer health problems; higher environmental satisfaction; higher job satisfaction; higher organizational commitment; and, lower intent to turnover. If good-quality lighting only resulted in more
attractive spaces, the chain of relationships would stop at room appearance. Lighting conditions in offices affect organizational productivity through effects on employees.
Other NRC research in the same host organization has demonstrated that the workstation-specific direct-indirect luminaires with individual control, daylight harvesting, and occupancy sensors, can save 69% of the electricity used compared to a conventional grid of parabolic-louvered luminaires. The evidence that these luminaires also deliver a higher-quality work environment, and furthermore that this environment is associated with fewer health problems and better employee retention, makes this lighting solution an excellent choice for individuals, their employers, and the environment.
Figure ES4. Conceptual form of final structural equation model.
(neg.) Health Problems Mood Luminous Conditions Environmental Satisfaction Intent to Turnover Job Satisfaction Organizational Commitment Lighting Appraisal Room Appearance (neg.)
Table of Contents 1.0 Introduction ... 6 2.0 Method ... 8 2.1 Research Design ... 8 2.2 Participants ... 8 2.3 Building Characteristics ... 9 2.3.1 Building details. ... 9 2.3.2 Furnishings. ... 10
2.3.3 Lighting equipment and luminous conditions... 10
2.3.4 Summary of buildings and floors by measurement wave. ... 13
2.4 Questionnaire ... 14
2.4.1 Performance measures. ... 15
2.4.2 Perceptions and feelings. ... 15
2.4.3 Statistical controls. ... 16
2.5 Procedure ... 16
2.5.1 Online questionnaire. ... 16
2.5.2 Physical measurements. ... 17
2.5.3 Archival organizational data. ... 18
3.0 Results ... 18
3.1 Questionnaire Data Analysis Strategy ... 18
3.2 Questionnaire Data ... 21
3.2.1 Lighting comparisons. ... 21
3.2.2 Control comparisons. ... 26
3.2.3 Furnishings comparison. ... 29
3.2.4 Renovation comparisons. ... 31
3.2.5 Structural equation modelling. ... 31
3.3. Physical Data ... 35
3.3.1 Luminous conditions. ... 35
3.3.2 Thermal conditions. ... 39
3.3.3 Acoustic conditions. ... 41
3.4 Archival Data ... 41
3.4.1 Lighting energy use. ... 41
3.4.2 Facilities complaints calls. ... 42
4.0 Discussion ... 42
4.1 Lighting Effects on Individuals and Organizations ... 42
4.2 Limitations ... 45
4.3 Conclusions ... 45
5.0 References ... 46
Acknowledgements ... 49
1.0 Introduction
A century of lighting research has returned a good understanding of the effects of interior lighting on visual processes (Boyce, 2004). This, together with advances in technology, has largely eliminated problems of seeing from office work. Tasks themselves have changed and recommended practice documents for lighting, based on consensus built on vision research, have ensured that for most office workers the quantity of illumination is more than adequate for the tasks they must perform. However, the means to improve the quality of the lit environment beyond merely adequate seeing — to provide lighting that enhances the health, wealth, and happiness of the occupant — remain unclear (Boyce, 2004).
Recent laboratory research, including the Light Right Albany experiments, has begun to provide guidance on this question. The two Albany experiments tested the responses of, in total, 288 participants to six different lighting installations (Boyce et al., 2006a; Boyce et al., 2006b; Boyce, Veitch, Newsham, Myer, & Hunter, 2003). Of occupants whose lighting was typical of current practice, a 2 x 4 parabolic recessed troffer, approximately 70% rated the lighting as comfortable. This percentage rose to ~80% for a suspended direct/indirect system, and to ~90% for a suspended direct/indirect system with individual lighting control. This apparent preference for the combination of direct and indirect lighting is consistent with other work (Houser, Tiller, Bernecker, & Mistrick, 2002; Veitch & Newsham, 2000). The combination of direct and indirect lighting, rather than fully direct lighting, appears to be one way to improve office lighting quality.
Another result from Albany showed that individual control over lighting had a statistically significant effect on motivation over the working day; those without control showed a decline in motivation, whereas those with control maintained the same level throughout the day (Boyce, et al., 2003). An experiment conducted at the National Research Council of Canada at the same time as the Albany experiments used a different experimental paradigm to examine the benefits of individual control. In that experiment, 118 participants were given control over their office lighting for the last quarter of the working day (after the afternoon coffee break). There were statistically significant improvements in mood, environmental satisfaction, and visual comfort after the introduction of control; these effects appeared to be associated with the ability to obtain one’s preferred lighting condition (Newsham, Veitch, Arsenault, & Duval, 2004). Obtaining one’s preferred lighting conditions was associated with better mood, lighting quality ratings, and environmental satisfaction in an earlier NRC-IRC experiment (Newsham & Veitch, 2001). Because individual preferences vary widely, individual control is the only practical means to ensure that people have a fair chance of obtaining their own preferences.
These laboratory experiments can provide solid evidence that various lighting enhancements can have measurable, observable effects on occupants over the short term; however, they cannot demonstrate what happens when people work under such lighting over a longer period, as in an office occupied daily for weeks or years. Moreover, they cannot provide the evidence that employers want concerning the effects of lighting enhancements on
organizational performance. This paper reports results of a field investigation that was designed to fill the knowledge gap with such evidence. This investigation had two objectives:
1. To replicate the results of the Light Right Albany experiments in a functioning work setting.
2. To extend the model developed from the Albany data to organizational effectiveness outcomes.
The project was designed around a linked mechanisms map. The proposed linked mechanisms map for this investigation is shown in Figure 1. As in the Albany experiments, each concept in the linked mechanisms map has at least one associated measurement. In Figure 1, black lines indicate relationships that were observed in tests of the linked mechanisms map using the data from the two experiments in Albany (Boyce, et al., 2003; Veitch, Newsham, Boyce, & Jones, 2008). The blue lines in Figure 1 are relationships supported by other research.
For instance, the connection from mood to creativity and motivation has as its basis the positive affect theory of Alice Isen as adapted for organizations and the physical environment (Baron, 1990; Baron & Thomley, 1994; Isen & Baron, 1991).
We proposed to link the existing linked mechanisms map to a body of research from organizational psychology, shown here schematically at the bottom of Figure 1. The connection from environmental satisfaction to job satisfaction is a robust relationship observed in several investigations, including NRC-IRC’s Cost-effective Open-Plan Environments field study (Carlopio, 1996; Veitch, Charles, Farley, & Newsham, 2007). Carlopio (1996) and Donald and Siu (2001) observed a further connection from workplace satisfaction to job satisfaction to organizational commitment. A strong connection from job satisfaction to turnover intent and organizational rates of turnover is well-established (Harter, Schmidt, & Hayes, 2002; Koys, 2001; Lambert, Hogan, & Barton, 2001). Harter et al. (2002) also found that organizations with higher job satisfaction show improved customer satisfaction and profitability.
The experimental design is a naturally-occurring field
experiment. The host organization is undertaking a major renovation of three office buildings in south-west British Columbia. The renovations involve both
furnishings and updated lighting. Both the old and new lighting are the equipment types that were the focus of previous research. The old lighting consists of recessed parabolic-louvered luminaires (similar to the Base Case in the Albany experiment 1), and the new lighting consists of
workstation-specific individually-controllable suspended
direct/indirect luminaires (similar to Dimming Control in the Albany experiment 1).
All occupants of the three buildings (N ~ 2400) were asked to complete an online
questionnaire on three occasions
during the study (T0: May-June
2008, T1: June 2009, and T2:
September 2009). Each wave included questions and tasks relevant to all the individual-level concepts in the linked mechanisms map (white boxes in Figure 1), as well as demographic and work characteristics questions that were used to establish group equivalencies. Some of the participants moved to newly-renovated or newly-built offices
between measurement waves; others had already moved to newly-renovated spaces; and others did not experience any office design or lighting changes during the study period.
Figure 1. Proposed conceptual model.
The black lines indicate relationships observed in the Albany experiments. The blue lines are relationships derived from other
research The red dashed line is based on anecdotal evidence.
Health Lighting Appraisal Mood Motivation Creativity Operational Efficiency Lighting Design Environmental Satisfaction Individual Control Room Appearance Luminous Conditions Intent to Turnover Job Satisfaction Organizational Commitment
2.0 Method
2.1 Research Design
The investigation was a naturally-occurring field quasi-experiment taking place in three buildings in southwest British Columbia that are occupied by one organization, a large Canadian corporation. The phrase “naturally-occurring” means that the host organization had complete control over all aspects of the buildings, their furnishings, their lighting, and their operation. The organization is undergoing a phased renovation of certain floors within its three buildings, involving changes to both lighting and furnishings. The old lighting consists of recessed parabolic-louvered luminaires (abbreviated PARAB) and the new lighting consists of
workstation-specific individually-controllable suspended direct/indirect luminaires (abbreviated WS-81U-C to note the percentage of indirect light at full output of all “on” lamps), or the same luminaire with the indirect lamp turned off (abbreviated WS-76U-C). Four floors of one building have a similar, but not identical, luminaire, also with the indirect lamp turned off (abbreviated WS-60U-C). (The –C suffix denotes the availability of individual control.)
The phasing-in of the lighting retrofit provided comparison groups to permit the
separation of effects associated with light distribution, individual control over lighting, and office furnishings. Table 1 shows the groups formed by the combinations of lighting and furnishings. In addition, some of the floors with WS-76U and WS-81U lighting lacked individual control at either
T0 or T1, enabling comparisons of the effect of individual control between groups with the same
luminaire and furnishings.
The renovation of Buildings 1 and 2 continued past the end of the investigation. Over time, all employees in Buildings 1 and 2 will move into renovated spaces with new panels and WS-81U-C lighting. (That is, those in the cell at the top left of Table 1 will over time move to the conditions described in the cell at bottom right.)
Table 1. Lighting and furnishings combinations in the three buildings, with valid sample sizes (N) for
measurement waves T0, T1, T2 shown beneath.
PARAB WS-60U-C WS-76U-C WS-81U-C
Old panels – teal Bldg 1, 2 474, 451, 373 Old panels – grey Bldg 3
4, 10, 12 Bldg 3 69, 80, 62 New panels Bldg 1 20, 12, 8 Bldg 3 35, 50, 45 Bldg 1, 2 61, 77, 43 2.2 Participants
Occupants in the three buildings were invited by e-mail to participate by completing an online questionnaire. There were three measurement waves. Table 2 summarizes the
participation at each wave. Taken overall, 3841 unique individuals were invited to participate and 1750 participated at least once, for a response rate of 45% taken over the entire
investigation. Within each wave the response rate of 30-40% is normal for this type of organizational survey (Rose, Sidle, & Griffith, 2007).
Table 2. Invitations issued and frequency of responses to the three measurement waves.
Invited Responded Completed New Response Rate
T0 2749 1022 837 2749 37%
T1 3035 1022 932 889 34%
T2 2856 791 708 203 28%
Total 1750 3841 45% at least once
To test for bias in the sample, we obtained sex and age distribution data from the host organization’s Human Resources department. Tables 3 and 4 summarize the combined respondents for the three waves in terms of age and sex (for those who answered these two
questions), and compare the distribution of these variables to the population of employees in the three buildings. Looking at the whole sample, there was a slight tendency for more women than expected to respond, and the sample is slightly younger than expected.
The data analyses for this study considered only respondents in open-plan offices. Therefore, we also examined the age and sex distributions for respondents in open-plan offices. We could only compare these to the total population, as sex and age data were not available by office type. The tendency for there to be a higher proportion of women and younger people among the respondents was slightly more pronounced among the open-plan office respondents than in the overall sample, but as the expected distributions of age and sex for open-plan respondents are not known, we cannot judge whether or not the final sample shows any bias compared to the population of employees in the open-plan areas. In any case, the differences from the expected values are small.
Table 3. Sex distribution of participants and population.
Valid N Male % Female % Χ2(1)
Population 54.6 45.4
Full Sample 1540 51.9 48.1 4.62*
Open-plan only 1267 50.6 49.4 8.24**
Note. *p<.05. **p<.01.
Table 4. Age distribution of participants and population.
Valid N 18-29 % 30-39 % 40-49 % 50-59 % >=60 % Χ2(4)
Population 14.5 27.6 30.2 22.7 4.9
Full Sample 1552 17.3 28.5 30.1 18.9 5.2 18.84***
Open-plan only 1280 18.8 28.8 30.4 17.1 5.0 34.17***
Note. ***p<.001.
We also recorded the education level and job category of participants at each
measurement wave. There was no population data to which to compare this information. Table 5 shows the demographic characteristics of the respondents from the full sample and from the open-plan offices, whose data were used in the subsequent analyses.
Table 5. Education and job type distributions of participants.
Valid N Admin % Technical % Prof. % Manager %
Full Sample 1547 17.2 17.8 48.6 16.4
Open-plan only 1277 18.6 17.7 48.3 15.4
Valid N High school % Coll /Tech Cert % U < Bach % Bachelor % Grad/Prof %
Full Sample 1545 4.0 18.6 9.0 34.0 34.3
Open-plan only 1274 3.8 18.6 9.7 34.9 33.1
2.3 Building Characteristics
The three buildings are located in three different
neighbourhoods in a large metropolitan area. In addition, the organization has other office space elsewhere in the region; one reason for the renovation is to increase occupancy in the buildings in order to reduce the need for the additional space.
All three buildings have large windows in all compass orientations. There are open-plan areas around the perimeters of the buildings, with services and shared spaces in the core. The windows in all buildings have venetian blinds, and on a few floors also have low-transmission transparent roller blinds. The windows do not open. One of the buildings has under-floor ventilation (Building 2); two have traditional ceiling ventilation (Buildings 1 and 3).
Buildings 1 and 2 were constructed in the late 1980s/early 1990s and have very similar original layout and furnishings (see below for furnishings details). These buildings are the target of the phased renovation in which new furnishings and lighting are being installed.
Building 3 was constructed in the mid-1990s as an 11-storey building, and three floors were added in 2007. Five floors have been occupied by the host organization since its
construction, and to these have been added the newly constructed floors.
All employees use computers in their jobs; Over 96% of these were reported to be flat-panel LCD monitors. Some were on laptop computers, but most were stand-alone monitors. Some employees use two monitors, usually side-by-side.
Buildings 1 and 2 were originally designed to the same standard in the late 1980s, and consequently share very similar furnishings and layouts (see Figure 2.A) in the unrenovated areas. The design and layout use modular systems furniture typical of North American offices. Most employees are in open-plan areas, but those with enclosed offices are on the periphery on the unrenovated floors. The cubicle sizes and panel heights vary from one area to another. The original floors in Building 3 are furnished with rectilinear cubicles similar to the layout of the unrenovated spaces in Buildings 1 and 2,
although with a different colour scheme (see below).
The new layout, which is in place on renovated floors in Buildings 1 and 2 and on the newly built floors in Building 3, reduces the formal partitions between cubicles in favour of promoting team areas, and has changed the orientation of workstations to provide more shared window access. Panel heights are lower to promote daylight penetration. Enclosed offices are in the core of the building rather than on the periphery. Workstation sizes are smaller than in the original areas to increase the occupancy; however, each floor also has dedicated lounge or meeting areas as well as common services such as printers, photocopies, and fax machines.
Table 6 summarizes the reflectances of key surfaces for the three furnishing conditions. The photographs below do not do justice to the visual change between the old and new
furnishings. The predominant finish in the new spaces is a warm off-white colour, used on the panel trim, the cabinets and shelves, and on hard panel surfaces. The fabric panels in the new spaces are smaller than in the unrenovated areas, and the shelves and bins predominate. In addition, the renovated and new floors have several intense accent colours for columns and boundary walls, and on chairs and upholstery.
Table 6. Measured average reflectances of key surfaces.
Principal Colours Fabric
panel Shelves & Bins Panel Trim Hard Panels
Carpet Desk Ceiling Tile
Old - Bldg 1&2 teal / grey .27 .43 .15 .10 .16 .49 .72
Old - Bldg 3 grey / grey .35 .37 .10 .36 .12 .47 .76
Reno & New off-white / gold .36 .63 .63 .44 .17 .62 .78
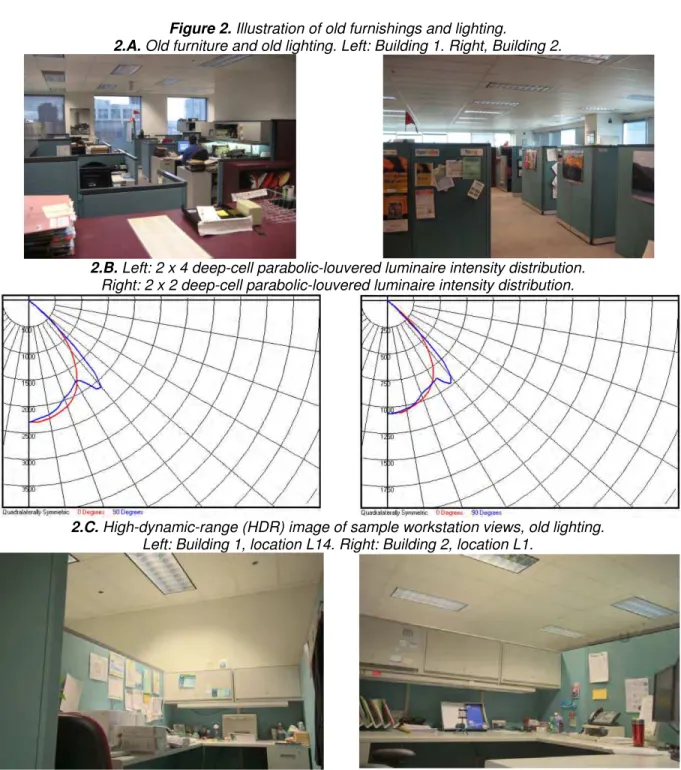
On unrenovated floors in Buildings 1 and 2, and on one floor of Building 3, the lighting consists of 2’ x 4’ (90%) and 2’ x 2’ (10%) recessed deep-cell (4”) parabolic-louvered luminaires (PARAB), each with 2 T8 lamps at 85 CRI and 3500 CCT and non-dimming electronic ballasts. Figure 2.B shows the intensity distribution from these
luminaires. Note that there is no indirect component for these luminaires: The luminaires deliver 100% downlight. Figure 2.C. shows workstation-level views of two workstations with this
lighting.
2.3.2 Furnishings.
Figure 2. Illustration of old furnishings and lighting.
2.A. Old furniture and old lighting. Left: Building 1. Right, Building 2.
2.B. Left: 2 x 4 deep-cell parabolic-louvered luminaire intensity distribution.
Right: 2 x 2 deep-cell parabolic-louvered luminaire intensity distribution.
2.C. High-dynamic-range (HDR) image of sample workstation views, old lighting.
Left: Building 1, location L14. Right: Building 2, location L1.
The new lighting in buildings 1 and 2 consists of workstation-specific, suspended direct-indirect luminaires with three lamps, all 32 W T8 lamps at 85 CRI and 3500 CCT. One of the three lamps provides the indirect component; it is run on a non-dimming electronic ballast at full power throughout the workday. The other two lamps provide the direct component, and are run on a dimming electronic ballast. Figure 3.B. shows the luminous intensity distribution from this luminaire. At full output, 81% of the light is directed up and 19% down. We have labelled this luminaire WS-81U. The newly-constructed floors at Building 3 have the same luminaire, but only the two dimmable lamps are used. This changes the distribution somewhat; at full output 76% of the light is directed up, and we have labelled this luminaire WS-76U (right panel, figure 3B).
Figure 3. Illustration of new furnishings and lighting. 3.A. New conditions. Left: Building 2. Right: Building 3.
3.B. Left: WS-81U luminaire luminous intensity distribution at full output (3 lamps on, Bldgs 1 and 2).
Right: WS-76U luminaire luminous intensity distribution at full output (2 lamps on, Bldg 3).
3.C. HDR image of selected new lighting, dimmers at 100%, Building 1, location L3.
Occupants of four of the older floors in Building 3 have an earlier generation of the luminaire used on the renovated and newly-built floors (see Figure 4). The lamps are 32W T8, 3500 K, 85 CRI. The lighting is operated with downlights only; the uplights have been set to 0% output since mid-2006 as part of an aggressive energy conservation program. Figure 4.B. shows the luminous intensity distribution of the luminaire as operated. Sixty percent of the output is directed up, and we have labelled this luminaire WS-60U.
Figure 4. Illustration of old furnishings and new lighting in Building 3, original floors. 4.A. Building 3 conditions – original floors.
4.B. WS-60 luminous intensity distribution
(Building 3, old floors, 2 down lamps on).
4.C.High-dynamic range image of Building 3, WS—60U;
old furnishings, location L6.
For all the workstation-specific luminaires, the level of the direct component may be modified by output from an occupancy sensor, a light sensor, or individual control through the desktop computer. The occupancy sensor is integral to the luminaire, and detects motion in the workspace. If no presence is detected, the sensor prompts the downlight to gradually dim down to zero output and switch off. When presence is detected, the downlight automatically returns to the previously set level. The light sensor is also integral to the luminaire. It monitors the
surrounding light levels and dims the downlight when sufficient light from other sources is present to maintain the preset light level; its principal function is to provide daylight harvesting. The individual (personal) control consists of a computer program resident on the occupant’s computer, with a graphic interface that allows the individual to set the dimmer level for the downlight component to any level between 0 and 100%.
Table 7 summarizes the status of the study floors in the three buildings at each measurement wave. Some floors were not surveyed, either because their occupants were not employees of the host organization or because their layout and furnishings were different from the standard (e.g., the floor for senior management was differently laid out and furnished). Floors 1E, 2K, and 2Q were renovated as part of a pilot
project and were occupied in spring 2007 (approximately 1 year prior to T0). Floors 3F, 3G, and
3H were newly constructed and occupied in spring 2008 (1-3 months prior to T0). Individual
control over lighting was not enabled on these floors until after the T0 measurement wave. Floor
1H was renovated in late 2008-early 2009 and occupied in March 2009. Individual control over
lighting was withheld from this floor until after measurement wave T1. Floor 1I was unoccupied
during T1 and T2. because it was being renovated. Floors 1C, 1G, and 1K were slated to begin
construction in December 2009; their occupants would have been aware at T2 that they were to
vacate their offices within a few months.
Table 7. Summary of lighting and furnishings on study floors.
Bldg Floor T0 T1 T2
Lighting Furniture Lighting Furniture Lighting Furniture
1 A PARAB New PARAB New PARAB New
1 B PARAB Old, teal PARAB Old, teal PARAB Old, teal
1 C PARAB Old, teal PARAB Old, teal PARAB Old, teal
1 D PARAB Old, teal PARAB Old, teal PARAB Old, teal
1 E WS-81U-C New WS-81U-C New WS-81U-C New
1 F PARAB Old, teal PARAB Old, teal PARAB Old, teal
1 G PARAB Old, teal PARAB Old, teal PARAB Old, teal
1 H PARAB Old, teal WS-81U New WS-81U-C New
1 I PARAB Old, teal
1 J PARAB Old, teal PARAB Old, teal PARAB Old, teal
1 K PARAB Old, teal PARAB Old, teal PARAB Old, teal
2 C PARAB Old, teal PARAB Old, teal PARAB Old, teal
2 D PARAB Old, teal PARAB Old, teal PARAB Old, teal
2 E PARAB Old, teal PARAB Old, teal PARAB Old, teal
2 F PARAB Old, teal PARAB Old, teal PARAB Old, teal
2 H PARAB Old, teal PARAB Old, teal PARAB Old, teal
2 I PARAB Old, teal PARAB Old, teal PARAB Old, teal
2 J PARAB Old, teal PARAB Old, teal PARAB Old, teal
2 K WS-81U-C New WS-81U-C New WS-81U-C New
2 L PARAB Old, teal PARAB Old, teal PARAB Old, teal
2 M PARAB Old, teal PARAB Old, teal PARAB Old, teal
2 N PARAB Old, teal PARAB Old, teal PARAB Old, teal
2 O PARAB Old, teal PARAB Old, teal PARAB Old, teal
2 P PARAB Old, teal PARAB Old, teal PARAB Old, teal
2 Q WS-81U-C New WS-81U-C New WS-81U-C New
2x A PARAB Old, teal PARAB Old, teal PARAB Old, teal
2x B PARAB Old, teal PARAB Old, teal PARAB Old, teal
2x C PARAB Old, teal PARAB Old, teal PARAB Old, teal
2y A PARAB Old, teal PARAB Old, teal PARAB Old, teal
2y B PARAB Old, teal PARAB Old, teal PARAB Old, teal
2y C PARAB Old, teal PARAB Old, teal PARAB Old, teal
3 A PARAB Old, teal PARAB Old, teal PARAB Old, teal
3 B WS-60U-C Old, grey WS-60U-C Old, grey WS-60U-C Old, grey 3 C WS-60U-C Old, grey WS-60U-C Old, grey WS-60U-C Old, grey 3 D WS-60U-C Old, grey WS-60U-C Old, grey WS-60U-C Old, grey 3 E WS-60U-C Old, grey WS-60U-C Old, grey WS-60U-C Old, grey
3 F WS-76U New WS-76U-C New WS-76U-C New
3 G WS-76U New WS-76U-C New WS-76U-C New
3 H WS-76U New WS-76U-C New WS-76U-C New
Note. Buildings 2x and 2y are three-story podium buildings connected to Building 2. 2.4 Questionnaire
The dependent variables encompassed all of the measurements of concepts in the linked mechanisms map (Figure 1). Among the criteria for selection of these variables was their demonstrated validity and reliability and their suitability for use in a computer interface by employees during a regular working day. The total time and effort burden on the research participants was a further consideration in selecting dependent variables for this investigation and tools with which to measure them.
Motivation. Motivation may be expressed as the degree
to which one will persist in the anagram task developed by Aspinwall and Richter (1999), in which participants are given a series of 5-letter anagrams, some solvable (e.g., "uijce = juice") and some unsolvable (e.g., "oneci" does not make an English word). The measure of persistence is the number of times the participant attempts to complete the impossible task during the allotted time, or the duration of time spent working on the unsolvable task. Participants spent 5 minutes on this task, or worked through the six items presented, of which two were unsolvable and four were solvable. We also obtained a cognitive performance measure by examining the success rate and time taken to solve the solvable anagrams.
Creativity. We used a divergent thinking task that has been used previously in lighting
research (Veitch & Gifford, 1996), where it was sensitive to the degree of control participants had over the lighting at their workstation. In this task, participants are presented with a picture of an everyday object and asked to suggest as many novel uses for that object as possible. This
task was presented only at T0 because we observed that a large number of respondents quit the
questionnaire at or immediately after this task, and we had many complaints about its suitability. The outcome measures included objective ratings of fluency (number of novel uses) and speed, and ratings of the perceived creativity of the uses. The ratings were performed by independent raters unaware of the hypotheses and of the office conditions of the respondents.
Lighting appraisal. The principal lighting appraisal tool
is the Office Lighting Survey (Eklund & Boyce, 1996), which was used in the Light Right Albany experiments (Boyce, et al., 2003). The responses from the Office Lighting Survey were compared with normative data collected by Eklund and Boyce in similar buildings in the Northeastern United States.
We added four questions concerning perceptions of daylight and windows. The first three are modelled on the Office Lighting Survey (Eklund & Boyce, 1996), and the fourth is a semantic differential rating of the attractiveness of the view through the window.
Room appearance. Participants were asked to evaluate the appearance of the space using a set of semantic differential rating scales selected from the 27 items used by Veitch and Newsham (1998). They were chosen because these items showed consistent correlations across the several studies in which the 27-item set was chosen (Boyce, et al., 2003; Newsham, et al., 2004; Veitch & Newsham, 1998). They produced average ratings for room attractiveness and room illumination.
Environmental features ratings. Participants rated their satisfaction with 23 specific
aspects of their work environment using the NRC Environmental Features Ratings. This is a modified version of the 18-item questionnaire developed for the Cost-effective Open-Plan Environments project (Veitch, et al., 2007), itself based on the Ratings of Environmental Features developed by Stokols and Scharf (1990). For this project we added five questions about the furnishings and office layout to assess specific aspects that are expected to change in the renovation. The original 18 items formed a stable 3-factor structure that was used to create subscale scores for satisfaction with lighting, with ventilation & temperature, and with privacy & acoustics.
Mood. Mood was assessed using the Affect Grid, which is a simple measure of pleasure
and arousal, in which the individual places a mark in one square of a 9 x 9 matrix on which one axis indicates pleasure and the other arousal (Russell, Weiss, & Mendelsohn, 1989).
Environmental satisfaction. We used the two-item measure of overall environmental
satisfaction developed as part of NRC-IRC 's Cost-effective Open-Plan Environments (COPE) project, which has been shown to relate to conditions in the physical environment (Veitch, Charles, Newsham, Marquardt, & Geerts, 2003). We made a small change to the wording of the first question to return it to the original wording (Wilson & Hedge, 1987).
In addition, we asked three questions to assess employee opinions concerning the
2.4.1 Performance measures.
match between the physical environment in which they work and their understanding of corporate values, creating a separate scale that we call workplace image. They are based on questions used by workplace design consultants, which they have found to have practical utility (Laing, 2005).
Job satisfaction. We used a single-item measure of overall job satisfaction. The wording
is based on the question used by Dolbier, Webster, McCalister, Mallon, and Steinhardt (2005). Single-item scales of job satisfaction have been shown to have acceptable reliability and to be suitable for use when longer scales are impractical (Dolbier, et al., 2005; Wanous, Reichers, & Hudy, 1997), although multi-item scales have higher reliability. In this instance, the overall length of the questionnaire makes a single-item scale preferable.
Organizational commitment. Participants answered the six-item scale of affective
organizational commitment developed by Meyer, Allen, and Smith (1993). This scale uses the Allen and Meyer three-component conceptualization of organizational commitment (Allen & Meyer, 1990), which has been extensively tested and validated (Allen & Meyer, 1996), and is widely used. For instance, Saks and Ashforth (2002) used the 8-item version to study recent university graduates' job experiences, finding that the perceived fit between person and job or person and organization predicted organizational attitudes (affective commitment and intention to quit).
Intent to turnover. The survey included a three-item scale of turnover intention was
developed by Colarelli (1984), and is a common measure of this concept. For instance, it was the intention to quit scale used by Saks and Ashforth (2002).
Health. Visual discomfort was measured using a short version of the scale developed by
Wibom and Carlsson (1987), and with which they demonstrated that luminance ratios of greater than 10:1 between paper and a VDT screen tend to reduce visual comfort over several hours. The list of physical discomfort measures was adapted from the literature (Hedge, Erickson, & Rubin, 1992) and placed in the same format as the visual discomfort symptoms. Veitch and Newsham (1998) and Newsham et al. (2004) have found these discomfort measures to be sensitive to changes in lighting conditions.
Absenteeism. We relied on self-reported absenteeism because organizational data were
not available, asking individuals to report the number of days during the previous month on which they were absent because of personal illness and the total number of days of paid time off that they have taken during that same period.
We included several demographic and work experience variables to provide statistical control by allowing a determination of the degree to which the occupants in the experimental groups are similar. Participants were asked to record their age, sex, education, job category, years of work experience (both overall and tenure with the host organization), the state of their vision (corrected or not), and to provide ratings of job demands and organizational climate. The job demand and organizational climate questions were taken from the organizational psychology literature (Lowe, Schellenberg, & Shannon, 2003). They were chosen for their brevity and because they have shown adequate internal consistency reliability and convergent and discriminant validity.
Open comments. The survey concluded with two open-ended questions. Participants
were asked to indicate their beliefs about the purpose of the survey, and invited to report any comments, positive or negative, about their workplaces. These questions were used to explore possible source of bias in the data.
2.5 Procedure
Approximately one week prior to each measurement wave, potential participants in the three buildings received messages from Corporate Communications announcing the study, and an article appeared in
2.4.3 Statistical controls.
the organization’s online newsletter (received by all employees, not only those in the study buildings). A week later, each of the potential participants received a personally-addressed e-mail invitation with a unique access code and a link to the questionnaire on NRC’s secure server. Participation was encouraged by offering to make a $5 contribution to the organization’s employee charitable foundation for each respondent. Respondents received a thank-you e-mail following their participation. Reminder messages were sent to those individuals who had not responded after one and two weeks, and the questionnaire was closed after three weeks. A short announcement in the online employee newsletter approximately one month later thanked all employees and announced the total contribution that would be made to the charitable foundation as a result of their participation in this wave of the study. Individuals who asked not
to be contacted again following T0 and T1, were placed on a “do not call” list, and excluded from
subsequent NRC e-mails concerning the study.
Clicking on the link in the e-mail message took the participant to the questionnaire on the secure NRC web site. The first page viewed was a consent form; it included a link to a pop-up window to view detailed NRC’s privacy policy applicable to the study. Participants who agreed to the terms of the consent form entered their unique access codes and clicked “start survey” to proceed from the consent form to the first page of questions. The access codes permitted the matching of data from the different measurement waves.
Each measurement wave included a 5-day site visit to the organization by NRC research staff. Photometric measurements were the principal focus of the site visits. At each visit, we made several
reflectance measurements of key surfaces; these were the basis for the values reported above in Table 5. We also made detailed photometric measurements by day and by night.
The most important measurements were the night-time electric lighting measurements in selected workstations of all furnishing types. The luminance measurements included calibrated high-dynamic-range (HDR) images of the viewpoint of a seated occupant (see Figure 5A), from which luminance and derived luminance variability metrics were created using Photosphere (Ward, 2005) and the recommendations provided by Reinhard (2006). We also took spot
luminance measurements on the ceiling. For illuminance, we measured cubic illuminance at the location of the head of a seated occupant and took two desktop illuminance measurements (see
figure 5B). For the WS-60U, WS-76U, and WS-81U luminaires at T0 and T1, we repeated all of
these measurements for five combinations of dimmer settings: target workstation at 100%, adjacent workstations at 100%, 50%, and 0%; and, target workstation at 0%, adjacent
workstations at 50% and 100%. The settings will provide information concerning the degree of
spill from one workstation to another. At T2 we measured only the 100%-100% condition, in
order to have time to visit a larger number of workstations.
During the daytime (principally afternoons), we made illuminance measurements at T0,
T1, and T2, and luminance measurements at T1 and T2 in a convenience sample of workstations
in each building. The luminance measurements for the occupant’s field of view were based on calibrated HDR images; spot measurements were taken of the maximum and minimum ceiling luminance. We also recorded the location of windows, their orientation, and the blinds and sky conditions. The daytime lighting measurements took the conditions as found, but the choices of locations were restricted in that the measurement ranges of the equipment did not permit direct sunlight on any sensor.
Figure 5. Luminance and illuminance equipment, shown on a floor with old furnishings.
A (Left), Camera setup for HDR photography. B (Right) Cubic and desktop illuminance installation.
We also assessed the acoustic conditions in the old and new layouts at T0, to determine
whether or not either layout created acoustic conditions substantially different from
recommended practice. These measurements used the NRC-produced SPMSoft system to assess sound transmission between workstations and to calculate speech intelligibility indices (Bradley & Gover, 2008). This measurement involves placing a sound generator to produce a known sound in one workstation and a sound level meter in an adjacent workstation, connected to a computer running the software.
On all three site visits, we collected air and radiant temperatures and relative humidity at 20 locations spread across the three buildings, with some placed on floors of each furniture/lighting combination. The air temperatures were recorded at three heights: ankle, desk, and panel top, using a custom combination of off-the-shelf data loggers (Figure 6). The loggers were installed on Monday afternoon of each site visit week and removed on
Thursday night or Friday morning; we used the data collected during working hours on Tuesday, Wednesday, and Thursday.
The linked mechanisms map predicted that where lighting and furnishings conditions improved satisfaction, there would be lower lighting energy use and fewer facilities complaints. We therefore sought to obtain lighting energy use and facilities management records from the host organization for the three buildings over the study period.
3.0 Results
3.1 Questionnaire Data Analysis Strategy
Table 8 summarizes the dependent variables from the questionnaire, their measurement scales and (where appropriate) the internal consistency reliability calculated based on the full sample.
Figure 6. Temperature and humidity
data logger installation.
Table 8. Dependent variables, in conceptual groups.
Construct Dependent variables(DV) Abbreviation Scale # Scale Reliability
Items T0 T1 T2
Lighting Appraisal Office Lighting Survey, 10 questions Satisfaction with Windows & Daylight
OLS1-9 OLS10 SWD1-3 0-1 -1, 0, 1 0-1 1 1 1 Room Appearance Attractiveness
Illumination Attract Illum 0-99 0-99 5 3 .95 .83 .96 .86 .96 .89 Mood Arousal Pleasure Arousal Pleas 1-9 1-9 1 1 Overall Environment
Overall Environmental Satisfaction Workplace Image OES WI 1-7 1-7 2 3 .70 .91 .80 .91 .81 .92 Environmental Satisfaction Components (COPE)
Satisfaction with Lighting
Satisfaction with Ventilation & Temperature Satisfaction with Acoustics & Privacy
Sat_L Sat_VT Sat_AP 1-7 1-7 1-7 5 3 10 .81 .85 .91 .81 .84 .92 .79 .85 .92 Renovation Satisfaction
Satisfaction with furnishings Satisfaction with view
COP19 – COP23 SWD4 1-7 0-99 1 1 Job Satisfaction Job Satisfaction
Organizational Commitment Intent to Turnover JS1 OC IT 1-7 1-7 1-7 (lower is better) 1 6 3 .86 .74 .87 .75 .88 .77 Health Visual Complaints – Frequency
Visual Complaints – Intensity Physical Complaints – Frequency Physical Complaints -- Intensity
VC_F VC_I PC_F PC_I 0-4 (lower is better) 0-4 (lower is better) 0-4 (lower is better) 0-4 (lower is better) 4 4 3 3 .75 .75 .65 .67 .73 .73 .64 .67 .79 .78 .72 .74 Absenteeism Absenteeism – Own Illness
Absenteeism – All (paid time off)
AB1 AB2 0-5 (lower is better) 0-5 (lower is better) 1 1 Motivation Unsolvable anagrams – attempts
Unsolvable anagrams – time
UA_TRIES UA_TIME
0 – unlimited 0 – 300 sec Cognition Anagrams – correct
Anagrams – attempts Anagrams – time taken
A_COR A_TRIES A_TIME 0 – 4 0 – unlimited 0 – 300 sec
Effort Time to complete survey DURATION # minutes
Creativity (T0 only)
Number of novel uses Average use per image Average time per use Average creativity rating
CNUSUM CNUPI CTPU ACR 0 - unlimited 0 - unlimited 0 – 300 sec 1-7 2 raters R*w g(J) = .83 Job Characteristics Job Demands
Communication & Social Support
JD CS 1-7 1-7 4 4 .87 .83 .86 .83 .86 .83 Control Interface Satisfaction with control interface, 5 items LC1-5 0-4 1
Note. For the scale scores, reliability is expressed as Cronbach’s alpha. For the creativity ratings, inter-rater agreement across two raters is expressed as R*wg(J) (LeBreton & Senter, 2008).
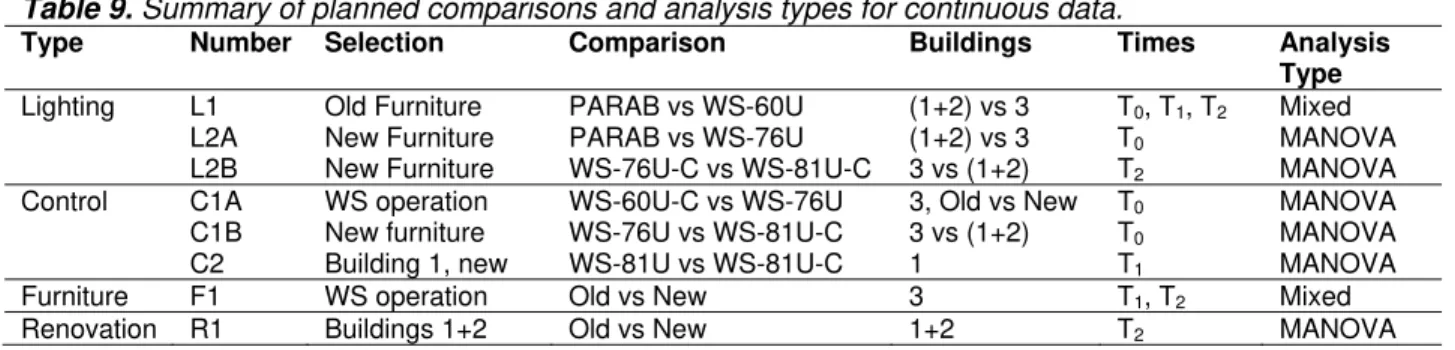
This investigation has a complex structure made up of non-orthogonal planned
comparisons. It is a quasi-experimental non-equivalent control group design (Shadish, Cook, & Campbell, 2002). We formed a series of planned comparisons to explore the hypotheses of interest while controlling as much as possible for possible confounding variables. Table 8 summarizes these contrasts.
For each planned comparison we first examined the demographic variables for the groups involved in the comparison, to ascertain whether or not there existed possible biases in the form of differing distributions by sex, age, education, job category, tenure with the
organization, job demands or communication and social support. Had we found any such differences we would have included the relevant variable as a covariate in subsequent
analyses; however, we found none. We were informed, however, that employees in buildings 1 and 2 work on the operational side of the organization, whereas those in Building 3 are
predominantly in outreach and public relations/communications functions. One result of this is that many employees in buildings 1 and 2 are unionized, whereas few in Building 3 are governed by collective agreements.
For all analyses involving interval or continuous data, we screened the variables prior to the analysis and excluded outliers (cases with standardized scores > 3), as is common
(Tabachnick & Fidell, 2001).
For each contrast, we used the nonparametric statistic chi-squared (Χ2) to test for
differences in responses to the categorical questions of the Office Lighting Survey (OLS). The differences tested were between the observed responses and a normative sample collected by the OLS developers (Eklund & Boyce, 1996), and for differences in response distributions between groups involved in the specified contrast.
For the ordinal and continuous variables, we used multivariate analysis of variance (MANOVA) for simple two-group comparisons. Where we were able to use MANOVA, we have reported statistically significant univariate results only for those models with statistically
significant multivariate tests.
We used mixed models for comparisons involving two variables: the contrast and time. Mixed models are able to generate effect estimates even when the research design is
unbalanced, as when group sizes are markedly different from one time to another (Kenny, Bolger, & Kashy, 2002). The summary of these planned comparisons and the analysis used is shown in Table 9.
Table 9. Summary of planned comparisons and analysis types for continuous data.
Type Number Selection Comparison Buildings Times Analysis Type Lighting L1 Old Furniture PARAB vs WS-60U (1+2) vs 3 T0, T1, T2 Mixed
L2A New Furniture PARAB vs WS-76U (1+2) vs 3 T0 MANOVA
L2B New Furniture WS-76U-C vs WS-81U-C 3 vs (1+2) T2 MANOVA
Control C1A WS operation WS-60U-C vs WS-76U 3, Old vs New T0 MANOVA
C1B New furniture WS-76U vs WS-81U-C 3 vs (1+2) T0 MANOVA
C2 Building 1, new WS-81U vs WS-81U-C 1 T1 MANOVA
Furniture F1 WS operation Old vs New 3 T1, T2 Mixed
Renovation R1 Buildings 1+2 Old vs New 1+2 T2 MANOVA
For both the MANOVA and mixed models, we calculated the effect size for statistically significant tests between two groups using Cohen’s d (Cohen, 1988). This statistic shows the size of the mean difference between the two groups as a function of the standard deviation. We have adopted Cohen’s suggestions for interpretation: d = .2 is a small effect (S); d =.5 is a medium effect (M); d >= .8 is a large effect (L).
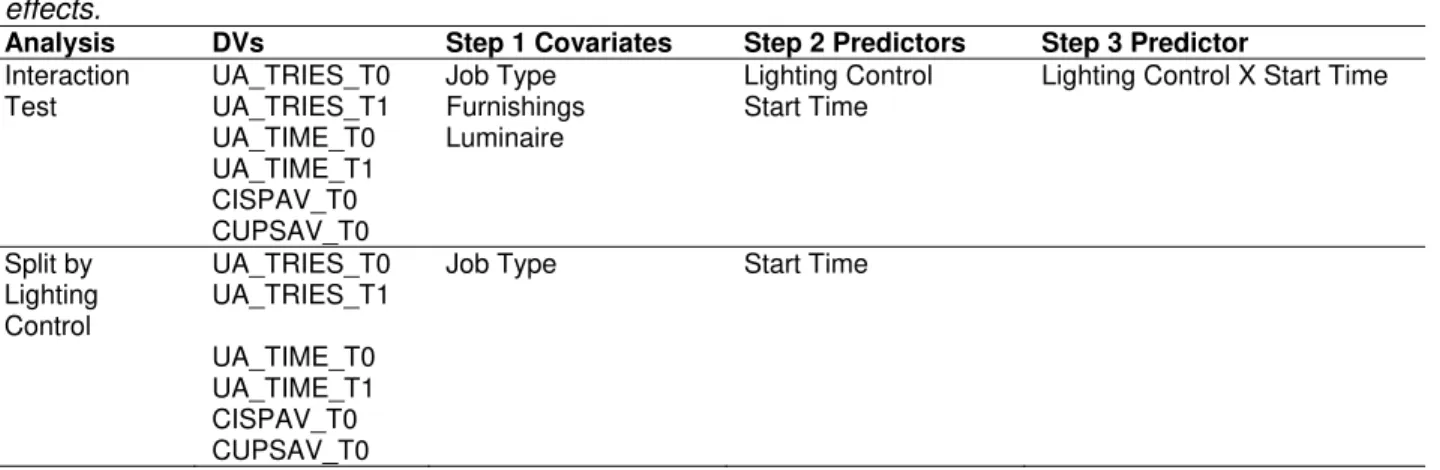
The Light Right Albany experiment found an interaction of individual control over lighting by time of day, such that individuals with individual control over lighting tended to maintain their
persistence over the day whereas those without showed declining persistence (Boyce, et al., 2006b; Boyce, et al., 2003). We tested this hypothesis in the questionnaire data using the time of day at which the individual completed the questionnaire as the source of the interaction. This analysis use multiple regression, described in more detail below under the heading C3. Heading C4 applies to an evaluation of the interface for individual control.
We used structural equation modelling to explicitly test the indirect effects expressed in the Linked Mechanisms Map. This technique is described in greater detail below.
3.2 Questionnaire Data
L1: Old furniture, comparing Parab and WS-60U-C lighting. This comparison targeted respondents at all
three survey times, in open-plan offices with the old style of furniture (whether grey or teal). For the agree/disagree items, we analysed the responses for each time separately. For all other analyses the model was a 2 Lighting x 3 Time Mixed Model; lighting was a between-subjects variable, but time was both repeated measures and between-subjects, as some participants completed only one measurement wave but others responded two or three times. Mixed models are able to test these unbalanced designs (Kenny et al., 2002).
Prior to analysis, we examined the demographic characteristics of the two groups and their reports of job demands and communications/social support. The two groups did not differ in terms of age, sex, education, job type, first language, tenure in the organization, years in the workforce, frequency of office moves in the previous three months, job demands, or
communications/social support. Therefore, there were no covariates applied to these analyses. The results show similar patterns on all occasions. Overall, both lighting designs were appraised as being better than the norms (e.g., ~81-83% of people in the Parab condition rated the lighting as comfortable, compared to 69% of the normative sample). The normative sample dates from the mid-1990s in the northeastern US. At that time most computers had CRT monitors, whereas 96% of this sample used LCD flat monitors. Although parabolic luminaires were designed to reduce reflections in CRTs, their success depends on the intended geometry of luminaire and monitor. Flat-panel monitors are less susceptible to problematic reflections, which might explain the higher number of comfortable people in the present sample; that is, the normative data might no longer hold. Alternatively, it is also possible that the presence of large windows and excellent views outside might influence the lighting appraisals. (Appendix A shows the detailed results for lighting appraisals in the Office Lighting Survey for the three times.)
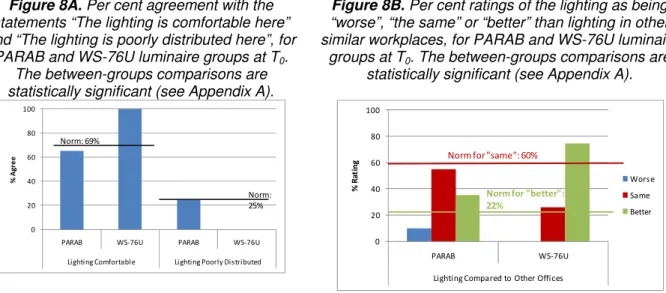
Significant differences are shown in Figure 7A for two statements: “Overall, the lighting is comfortable here.” “The lighting is poorly distributed here.” Figure 7B shows the pattern for the question “How does the lighting compare to similar workplaces in other buildings?” In all three cases, the WS-60U-C lighting was appraised as better than the Parab lighting at all three times. For the question comparing this to other workplaces, fewer than expected respondents rated the Parab lighting as being better than other similar workplaces, whereas more WS-60U-C
respondents than expected rated their lighting as being better than other similar workplaces. The trend toward more people in this group rating the lighting as “same” as other similar
workplaces from T0 to T2 might reflect their awareness of the renovation program; as the
organization installed new lighting, WS-60U-C could be said to be becoming more “the same” as other similar workplaces within the organization.
Figure 7A. Per cent agreement with the
statements “The lighting is comfortable here” and “The lighting is poorly distributed here”, for two
lighting conditions at three survey waves. The between-groups comparisons within each survey wave are statistically significant (see Appendix D).
Figure 7B. Per cent ratings of the lighting as being
“worse”, “the same” or “better” than lighting in other similar workplaces, for two luminaire types at three survey times. The between-groups comparisons within each survey wave are statistically significant
(see Appendix A).
There were small differences between the lighting conditions on the questions pertaining to satisfaction with windows and daylighting (see Appendix A). There was a small tendency for people in the WS-60U-C group to complain of problems related to direct sunlighting, but they also were more likely to report being able to adjust window blinds. These probably relate more to architectural differences between the buildings than the lighting; the Parab group was in buildings 1 and 2, and the WS-60U-C group was in Building 3.
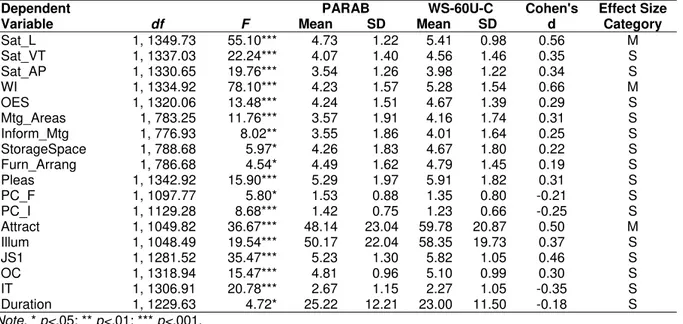
All the other variables that were measured at the three waves were analyzed in a series of mixed analyses, the results of which are summarized in Tables 10-13. Table 10 shows the list of significant main effects of Lighting. All of the effects were in the predicted direction: the better outcome was found for people with WS-60U-C lighting. The effects were generally small, but the three effects were medium-sized, all for variables related to lighting satisfaction with lighting: (Sat_L), workplace image (WI), and attractiveness (Attract).
There were unexpected effects on four variables related to the furnishings, all small effects. People with WS-60U-C lighting rated their satisfaction with the availability of formal and informal meeting areas, storage space, and the arrangement of their furnishings and equipment, as being better than those with parabolic lighting. These effects are more likely to relate to differences in the buildings (the parabolic lighting was predominantly in buildings 1 and 2, WS-60U-C was only in Building 3), than to differences in the lighting.
0 20 40 60 80 100
PARAB WS‐60U‐C PARAB WS‐60U‐C
Lighting Comfortable Lighting Poorly Distributed % Ag re e T0 T1 T2 Norm: 69% Norm: 25% 0 20 40 60 80 100 T0 T1 T2 T0 T1 T2 PARAB WS‐60U‐C Lighting Compared to Other Offices % Ra ti n g Worse Same Better Norm for "Same": 60% Norm for "Better": 22%
Table 10. Statistically significant main effects of luminaire for contrast L1 (all old furniture) in mixed
models, showing test statistics (F), degrees of freedom (df), mean, standard deviation (SD0 and effect size.
Dependent PARAB WS-60U-C Cohen's Effect Size
Variable df F Mean SD Mean SD d Category
Sat_L 1, 1349.73 55.10*** 4.73 1.22 5.41 0.98 0.56 M Sat_VT 1, 1337.03 22.24*** 4.07 1.40 4.56 1.46 0.35 S Sat_AP 1, 1330.65 19.76*** 3.54 1.26 3.98 1.22 0.34 S WI 1, 1334.92 78.10*** 4.23 1.57 5.28 1.54 0.66 M OES 1, 1320.06 13.48*** 4.24 1.51 4.67 1.39 0.29 S Mtg_Areas 1, 783.25 11.76*** 3.57 1.91 4.16 1.74 0.31 S Inform_Mtg 1, 776.93 8.02** 3.55 1.86 4.01 1.64 0.25 S StorageSpace 1, 788.68 5.97* 4.26 1.83 4.67 1.80 0.22 S Furn_Arrang 1, 786.68 4.54* 4.49 1.62 4.79 1.45 0.19 S Pleas 1, 1342.92 15.90*** 5.29 1.97 5.91 1.82 0.31 S PC_F 1, 1097.77 5.80* 1.53 0.88 1.35 0.80 -0.21 S PC_I 1, 1129.28 8.68*** 1.42 0.75 1.23 0.66 -0.25 S Attract 1, 1049.82 36.67*** 48.14 23.04 59.78 20.87 0.50 M Illum 1, 1048.49 19.54*** 50.17 22.04 58.35 19.73 0.37 S JS1 1, 1281.52 35.47*** 5.23 1.30 5.82 1.05 0.46 S OC 1, 1318.94 15.47*** 4.81 0.96 5.10 0.99 0.30 S IT 1, 1306.91 20.78*** 2.67 1.15 2.27 1.05 -0.35 S Duration 1, 1229.63 4.72* 25.22 12.21 23.00 11.50 -0.18 S Note. * p<.05; ** p<.01; *** p<.001.
There was one statistically significant interaction of lighting and time, and a few main effects of time. The interaction, which was significant only for the variable workplace image, is shown in Table 11. The effect of lighting on workplace image, although persistent across all the
times, was largest at T0.
Table 11. Interaction effect of lighting and time on Workplace Image, within old furniture.
WI df = 2, 851.18 F = 5.244**
Parab WS-60U-C Cohen's Effect Size
Mean SD Mean SD d Category
T0 4.12 1.57 5.71 1.17 0.99 L
T1 4.34 1.59 5.05 1.74 0.44 S
T2 4.22 1.54 5.10 1.55 0.55 M
Note. * p<.05; ** p<.01; *** p<.001.
Tables 12 and 13 show the main effects of time (i.e., measurement wave). Most of these
effects are predictable. There was a significant difference in paid time off (AB2) between T2 and
T1, which is not surprising given that T2 occurred in September, and many people would have
taken summer vacation just before. The return to work in autumn might also explain the small
drop in job satisfaction at T2. The effects on cognitive performance, measured on an anagram
task, are probably the result of differences in the problem sets; learning is an unlikely
explanation because of the large number of people who did not participate at all times. The set
used at T1, although randomly selected from a larger set, might have been easier than the sets
at the other times. The change in the duration of the questionnaire at T1 compared to T0 is
explained by the fact that the 5-min creativity task was presented only at T0. It is less clear why
there was a small change in satisfaction with the availability of meeting rooms at T1, nor why
there was very small (in real terms; see Table 13) increase in persistence on the unsolvable