Publisher’s version / Version de l'éditeur:
Powder Diffraction, 23, December 4, pp. 292-299, 2008
READ THESE TERMS AND CONDITIONS CAREFULLY BEFORE USING THIS WEBSITE. https://nrc-publications.canada.ca/eng/copyright
Vous avez des questions? Nous pouvons vous aider. Pour communiquer directement avec un auteur, consultez la
première page de la revue dans laquelle son article a été publié afin de trouver ses coordonnées. Si vous n’arrivez pas à les repérer, communiquez avec nous à PublicationsArchive-ArchivesPublications@nrc-cnrc.gc.ca.
Questions? Contact the NRC Publications Archive team at
PublicationsArchive-ArchivesPublications@nrc-cnrc.gc.ca. If you wish to email the authors directly, please see the first page of the publication for their contact information.
NRC Publications Archive
Archives des publications du CNRC
This publication could be one of several versions: author’s original, accepted manuscript or the publisher’s version. / La version de cette publication peut être l’une des suivantes : la version prépublication de l’auteur, la version acceptée du manuscrit ou la version de l’éditeur.
For the publisher’s version, please access the DOI link below./ Pour consulter la version de l’éditeur, utilisez le lien DOI ci-dessous.
https://doi.org/10.1154/1.3009635
Access and use of this website and the material on it are subject to the Terms and Conditions set forth at
Ab initio structure determination of the low-temperature phase of
succinonitrile from laboratory X-ray powder diffraction data - coping
with potential poor powder quality using DFT ab initio methods
Whitfield, Pamela; Le Page, Yvon; Abouimrane, A.; Davidson, Isobel
https://publications-cnrc.canada.ca/fra/droits
L’accès à ce site Web et l’utilisation de son contenu sont assujettis aux conditions présentées dans le site LISEZ CES CONDITIONS ATTENTIVEMENT AVANT D’UTILISER CE SITE WEB.
NRC Publications Record / Notice d'Archives des publications de CNRC:
https://nrc-publications.canada.ca/eng/view/object/?id=35373b0f-e6e6-44b0-9c7e-02be3425f14e https://publications-cnrc.canada.ca/fra/voir/objet/?id=35373b0f-e6e6-44b0-9c7e-02be3425f14e
Ab initio
structure determination of the low-temperature phase
of succinonitrile from laboratory X-ray powder diffraction
data—Coping with potential poor powder quality using DFT
ab initio
methods
P. S. Whitfield, Y. Le Page, A. Abouimrane, and I. J. Davidson
Institute for Chemical Process and Environmental Technology, National Research Council Canada, 1200 Montreal Road, Ottawa, Ontario K1A 0R6, Canada
共Received 21 July 2008; accepted 10 September 2008兲
Without experimental or predicted literature crystal structures for succinonitrile at low temperature, structure solution was attempted from powder diffraction data taken at 173 and 90 K from a solid sample. Its room-temperature plastic-crystal state makes production of a sample with good particle statistics and random orientation almost impossible. Combining constrained models, simulated annealing, and careful application of second-order spherical harmonic corrections nevertheless produced viable-looking structures at 90 and 173 K, yielding two distinct structure models with the same projection down c. VASP optimization of atom coordinates in the experimental cell agreed well with the 90 K model but poorly with the model derived from the 173 K data. The refined 90 K structure changed little on optimization and fitted all datasets from 85 to 225 K. Plots of cell data, torsion angles, and isotropic displacement parameters against temperature suggest possible phase transitions around 100, 120, and 180 K. Cell data at 90 K: monoclinic P21/a, a = 9.0851共5兲 Å,
b= 8.5617共5兲 Å, c = 5.8343共3兲 Å,= 79.295共2兲°, and Z = 4. Succinonitrile has gauche conformation, in agreement with literature spectroscopy data. © 2008 Crown of Canada.
关DOI: 10.1154/1.3009635兴
Key words: structure solution, DFT methods, simulated annealing, nonambient diffraction
I. INTRODUCTION
Succinonitrile is an interesting material because of the ability of its ambient-temperature plastic-crystal phase 共Sher-wood, 1979兲 to dissolve many inorganic salts, and under cer-tain circumstances to form intricate self-assembling network coordination compounds 共Carlucci et al., 2002; Whitfield et
al., 2007a兲. The solvating properties of succinonitrile in the plastic-crystal state, with subsequent good ionic transport properties, have made it a potential base for solid electrolytes for lithium battery materials 共Alarco et al., 2004; Long et al., 2003; Abouimrane et al., 2007兲. Succinonitrile exhibits a transition from the room-temperature cubic plastic-crystal containing both gauche and trans conformers 共Fengler and Ruoff, 2001兲 to an ordered crystalline phase on cooling be-low 230 K 共Janz and Fitzgerald, 1955兲. There are a number of literature papers describing the rotational and conforma-tional disorder in the plastic crystal phase 共Derollez et al., 1990兲, but little other than spectroscopy 共Fengler and Ruoff, 2001; Janz and Fitzgerald, 1955兲 and thermal analysis data 共Alarco et al., 2004; Badea et al., 2007兲 describing the low-temperature phase. Statements that it is monoclinic 共Fengler and Ruoff, 2001; Badea et al., 2007兲 with space group P21/a
共Badea et al., 2007兲 appear, but we have found no definitive information to date as to how these data were derived. Spec-troscopy data have shown that the molecules in the low-temperature form are solely in the gauche conformation 共Janz and Fitzgerald, 1955兲. The number of molecules in the unit cell has also been assigned as Z = 4 共Fengler and Ruoff, 2001兲. During a variable temperature phase study of a poten-tial electrolyte system, we collected low-temperature diffrac-tion data of pure succinonitrile, providing the opportunity to study the low-temperature crystal structure of succinonitrile.
Succinonitrile is a challenging material for powder dif-fraction analysis because of its plastic state and sticky nature at room temperature. Optimizing the particle statistics by producing a micron-sized powder may be possible using cryomilling. In all other situations the possibility of poor statistics is always present with subsequent errors in relative peak intensities 共Smith, 2001兲. The low linear absorption co-efficient of succinonitrile with Cu K␣ makes analysis in transmission preferable to reflection, but getting the sample inside the capillary is more difficult than for most materials. Melting the sample by heating to 60 ° C and injecting the liquid into the capillary before cooling is the most practical approach, but this leads to a single lump of plastic crystal. An additional complication is that succinonitrile is a classical example of a system where dendritic and directional crystal growth can occur 共Glicksman et al., 1976; Fedorov et al., 2005兲, which could lead to significant orientation issues in-side a capillary. Although capillaries are usually a way of avoiding orientation with platelike morphologies, they can make the orientation of fiberlike materials worse. It is pos-sible that the combination of orientation and poor statistics has hindered previous attempts to solve the crystal structure of the low-temperature form from powder diffraction. Any particle statistics problem could be addressed, at least par-tially, using a 2D detector, but the orientation issue would remain. Single crystal diffraction would normally solve such a small-molecule structure with ease, but again the plastic-crystal nature of the phase may also have hindered good-quality low-temperature data from being obtained.
We determine here the crystal structure of succinonitrile in two ab initio steps completed by a rigid-body refinement, based on its low-temperature powder diffraction data at
173 K and then at 90 K after recrystallizing the sample
in situ. The first ab initio step was the derivation of a crude conformation, orientation, and position for the molecule with the help of recent structure-determination methods using minimal prior information and thus often called ab initio methods, as implemented in DIFFRACPlus TOPAS 共Bruker-AXS兲. The second ab initio step was a DFT optimization with VASP 共Kresse, 1993; Kresse and Hafner, 1993, 1994兲 of this crude conformation, orientation, and position of the mol-ecule in its accurate experimentally determined cell. Inex-pensive computers capable of performing DFT optimization of even large crystal-structure models have recently become available. The combination of powder methods and DFT methods is quite intuitive, and accordingly becoming more widespread. Depending on the desired amount of experimen-tal content of the printed results, this combination can take several forms. At one end of the spectrum, Mercier et al. 共2007兲 salvage as much experimental content as possible in a nevertheless numerically stable refinement by constraining a single chemically uninterpretable angle in a parametrized de-scription of apatites to its DFT-calculated value. At the other end, Smrčok et al. 共2007兲 advocate complete replacement of Rietveld refinement of organic molecular crystals by their DFT optimization. There are many intermediate possibilities for combinations 共Dinnebier et al., 2001; Neumann et al., 2002; Baikie et al., 2007; Whitfield et al., 2007b兲. Here, the use of DFT methods helped us label as wrong an otherwise plausible rigid-body structure model from standard X-ray structure solution methods.
II. EXPERIMENTAL
The data were obtained from a Cu K␣ Bruker D8 Ad-vance diffractometer. The diffractometer was equipped with a focusing primary mirror and a Vantec PSD detector with radial Soller slits. The mirror was effective in suppressing the Kline, so a filter was not necessary. The temperature of the sample was controlled using a custom-built cryoflow sys-tem 共Cryosyssys-tems of America, Inc.兲 with the nozzle geom-etry colinear with the capillary to reduce turbulence and con-sequent icing of the sample. A goniometer heat shield 共Cryo Positioning Systems兲 was used to prevent the goniometer head from icing. A Lakeshore 331S cryocontroller was used to maintain a constant temperature. A 4 mm Debye slit was used in the detector so the detector only “saw” the sample in the constant temperature zone along the capillary. The tem-perature calibration of the cryoflow system was checked pre-viously using the thermal expansion of aluminium powder and phase transitions of NH4NO3and found to be
reproduc-ible.
For the 173 K dataset, the succinonitrile 共99%, Aldrich兲 was melted and injected into a 0.5 mm borosilicate capillary before cooling to room temperature in ambient conditions. Another set of data was obtained after melting the sample in the capillary and cooling down to 85 K while rotating the sample. Data were then obtained between 85 and 355 K in 5 K steps. Data were taken with a 10° window between 5 and 80° 2 using a 0.0214° step size and an effective 1 s count time.
All of the data analysis was performed using DIFFRAC-Plus TOPAS 共Bruker-AXS兲 on raw, unprocessed data.
Crys-tallite size-constrained single peak fitting produced the input data for indexing using the singular value decomposition method 共Coelho, 2003兲. All possible symmetries from cubic to primitive monoclinic were examined. The ratio of possible unobserved to observed reflections was set as 12. The highest ranked solution with no unindexed lines was a cell in P21
with a GOF of 34.6. Automated Pawley fitting 共Pawley, 1981兲 of the candidate unit cells with the GOFs down to 20 was used to confirm the quality of the fit of the cells to the experimental data before proceeding further. The TOPAS in-dexing software produces a suggested space group, but an analysis using Extsym 共Markvardsen et al., 2001兲 was also used to examine the possible space groups in terms of maxi-mum likelihood. Extsym examines the systematic absences in a Pawley fit of the lowest applicable symmetry, in this case P2, to rank the most likely extinction symbols. A. Ab initio structure solution
The diffraction pattern of the succinonitrile at room tem-perature before cooling is shown in Figure 1. Although
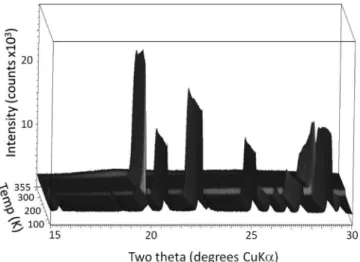
Figure 2. Powder diffraction data from succinonitrile between 85 and 355 K.
Figure 1. Room-temperature diffraction pattern of the succinonitrile before cooling to 173 K. The weak reflections correspond to the poorly crystalline cubic Im3m plastic-crystal phase.
mostly amorphous, reflections corresponding to the cubic
Im-3m plastic-crystal unit cell can be seen. The full range of experimental data can be seen in Figure 2, showing the low-temperature crystalline to plastic-crystal transition at 230 K, and the melting at 330 K.
Given the likely orientation bias in the experimental data, the use of z-matrix rigid-body constrained simulated annealing 共SA兲 was preferable to charge-flipping 共Oszlányi and Süto, 2004兲. The z-matrix was constructed such that the conformation of the succinonitrile was randomly assigned to
cis, trans, or gauche before each cycle. Forcing the molecule to restart in one of the possible conformations as opposed to a freely refined torsion angle once again acted as a constraint against bias from orientation and possibly unreliable relative intensities. Bond lengths, bond angles, and torsion angles were constrained to chemically reasonable values 共Lide, 2007兲 for the solution step.
One approach to account for preferential orientation dur-ing the SA of the 173 K dataset was adddur-ing a March-Dollase parameter 共Dollase, 1986兲. Given the cubic nature of the plastic-crystal succinonitrile and lack of any obvious direc-tion, an assumption had to be made regarding the orientation direction. The March-Dollase correction along the assumed 关100兴 direction had a variable constrained between the values of 0.8 and 1.2 in order to maintain stability during the SA. However, visual comparison with a structure proposed from parallel work by a group using synchrotron data 共Hore et al., 2008兲 indicated that the assumed direction biased the SA to the point where the correct minimum had not been found. In the event, it would appear as though the March-Dollase ap-proach with the 关100兴 direction would have been perfectly adequate for the 90 K dataset, but the 173 K dataset was attempted first. The spherical harmonics approach 共Von Dreele, 1997兲 has the advantage of no assumed orientation
direction but would normally be too likely to destabilize an SA run. In an attempt to stabilize the coefficients, a second-order correction was added 共three variables in this case兲 us-ing the TOPAS macro language command “valគonគcontinue” to force the values to reset to zero after each minimization cycle. The TOPAS “decomposition” option was used for the
TABLE I. Bond lengths from the 90 K DFT-optimized structure. Atom pair Optimized bond length 共Å兲
N1-C1 1.1633 C1-C2 1.4504 C2-C3 1.5396 C3-C4 1.4511 C4-N2 1.1645 C2-H1 1.0989 C2-H2 1.0975 C3-H3 1.0998 C3-H4 1.0960
TABLE II. Selected bond angles from the 90 K DFT-optimized structure. Atom group Bond angle 共°兲 Torsion angle 共°兲
C4-C3-C2 112.997 —
N2-C4-C3 179.330 —
C1-C2-C3 112.964 —
N1-C1-C2 178.488 —
C1-C2-C3-C4 — 60.396
Figure 3. 共Color online兲 Rigid-body succinonitrile molecule produced from the optimized 90 K structure.
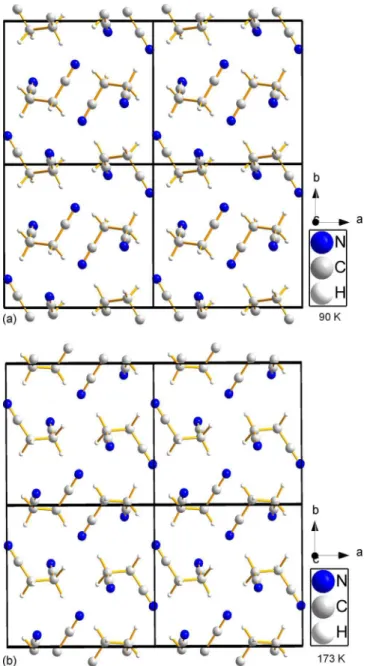
Figure 4. 共Color online兲 Projections down the c axis for the optimized structures from the 共a兲 90 K solution and 共b兲 173 K solution. The structures are not related by any symmetry operation, although visually from the view along the c axis, it might be expected that they are related by an origin shift.
simulated annealing where the peak intensities are used alone in order to speed up the calculation. Datasets taken at both 90 and 173 K were used in SA runs. For the refinement step, a fourth-order spherical harmonics correction was used. B. DFT ab initio structure optimization
The conformation of the models obtained from X-ray refinement were clear but had very crude distances and angles. We accordingly optimized the atom coordinates of the structures obtained from the 90 and 173 K data with DFT 共density functional theory兲 methods, while retaining their ex-perimental unit cell dimensions. Optimization was performed with VASP using input files prepared, and output files inter-preted with the Materials Toolkit 共Le Page and Rodgers, 2005兲 environment for ab initio modeling of materials. The GGA PAW potentials 共Kresse and Joubert, 1999兲 for C, N, and H atoms were used for all calculations with 400 eV en-ergy cutoff. Wave functions were optimized iteratively with the Davidson blocked scheme in combination with reciprocal space projectors 共Davidson, 1983兲 down to an electronic convergence of 1 ⫻ 10−7eV. A Monkhorst-Pack scheme
共Monkhorst and Pack, 1976兲 was used to perform reciprocal space integration. Energy corrections were applied according to the Methfessel-Paxton smearing scheme with order 1 and width 0.2 eV 共Methfessel and Paxton, 1989兲. The conver-gence criterion for forces was 1 ⫻ 10−4eV/ Å. No spin
polar-ization corrections were performed. A 3 ⫻ 3 ⫻ 3 k mesh was used for all calculations, ensuring a reciprocal resolution bet-ter than 0.07 Å−1 in all directions.
Convergence of the 173 K model was slow but steady, with no drastic change to the model, apart from a regulariza-tion of distances and angles. The slow convergence speed was a result of “ringing” of the molecule each time an atom-position adjustment altered a bond length, but the total en-ergy went down steadily without quite reaching the mini-mum total energy of the 90 K model. The initial total energy of the 90 K X-ray model was 9 eV lower than the initial total energy of the 173 K model and converged rapidly with next to no change. This indicated excellent agreement between
the X-ray model and its DFT optimization for the 90 K model, but poor agreement for the 173 K model.
C. Rigid-body X-ray re-optimization based on DFT
ab initiogeometry
A rigid-body z-matrix was constructed from the 90 K optimized succinonitrile molecule 共Figure 3兲 for refinement of the molecular arrangement against the experimental data. Bond lengths, bond angles, and torsion angles were extracted from the optimized succinonitrile molecule as shown in Tables I and II. The refined variables were limited to the translation and rotation of the rigid-body, lattice parameters, zero point error, background, separate Bisofor N and 共C,H兲,
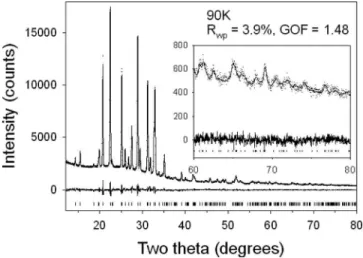
Figure 5. Rietveld difference plot of the 90 K DFT ab initio derived rigid body to the 90 K experimental data. The high-angle portion of the difference plot is magnified in the inset.
Figure 6. 共Color online兲 Projections of the succinonitrile structure at 90 K down 共a兲 the a direction and 共b兲 c direction.
and a fourth-order spherical harmonics preferential orienta-tion correcorienta-tion. The terminal C-C-C bond angles were also refined but constrained to have equal values to reduce corre-lations. The very close values for these angles in the opti-mized structure would appear to make this a reasonable as-sumption. The cycle of optimization and refinement was repeated twice. The final refinement errors were calculated using the bootstrap method 共Efron and Tibshirani, 1986兲, as the errors in fractional coordinates in a z-matrix cannot be determined in TOPAS using matrix inversion. This method carries out a series of refinements 共in this case 100兲 with a portion of the observed intensities modified, with the stan-dard deviation of the refined values becoming the bootstrap errors 共see the DIFFRACPlus TOPAS: TOPAS 4 user manual兲.
III. RESULTS AND DISCUSSION A. Comparison with literature results
The maximum likelihood results from Extsym 共Mark-vardsen et al., 2001兲 suggested that the most likely extinction symbols in order of probability were P1a1 共15.3兲, P121/a1
共10.8兲, and P1211 共3.4兲. The extinction symbol P1a1
con-tains the space group P2 / a in addition to Pa 共Looijenga-Vos
and Buerger, 2006兲. The solution in P2 / a was extremely poor, yielding an Rwpvalue of 35.6. P21/a agrees with the sole literature assignment 共Badea et al., 2007兲, but solutions were attempted in all these space groups. Actually, the solu-tion in space group Pa, which is a subgroup of both space groups P2 / a and P21/a, produced candidate structures that
were very similar to those for space group P21/a. Initial refinement using space group Pa produced a slightly better fit than P21/a 共Rwpof 6.4% and 7.0%, respectively兲, but that
is expected given the extra degrees of freedom in a subgroup. A number of the bond and torsion angles in the Pa structure went well beyond reasonable values, while the single
z-matrix in the P21/a cell refined to reasonable values even
if some of the bond lengths were rather long. It is quite possible that the Pa structure had more degrees of freedom than the data could support. Pawley fits of the experimental data to the unit cell in Pa and P21/a yielded identical fits, and indeed optimization of the Pa structure produced a struc-ture indistinguishable to the P21/a solution. The solution
was pursued in P21/a as opposed to the transformed P21/c
cell to facilitate comparison with other studies. B. The two solutions and their discrimination
The SA found satisfactory-looking solutions for both the 173 and 90 K datasets, with raw, unrefined Rwp values of 8.5% and 7.0%, respectively. The SA solutions from the datasets at 173 and 90 K were found to be different, although looking at the projections in the c direction 共Figure 4兲 it seems as though they should be related by an origin shift, but they are not. The initial refined structure from the 90 K data was found to be 9 eV lower in energy than the refined 173 K structure because the 173 K structure had drifted away from chemically reasonable bond lengths during X-ray optimiza-tion. This is not an issue with the temperature, but with the model, as a separate solution using the 175 K dataset from the recrystallized sample produced a solution identical to the 90 K solution.
The fits obtained after Rietveld refinement are good as seen in Figure 5, with an Rwp residual for the 90 K refine-ment of 3.9%, a GOF of 1.48, and a Durban-Watson statistic of 1.5. The packing of the structure at 90 K along the a and
caxes can be seen in Figure 6. The projection along the c axis appears identical to that in Hore et al. 共2008兲, but with-out cell data and atomic coordinates, it was not possible to directly compare the two. It must be noted that the false minima found with the 173 K data also looked the same along the c direction. However, it was not energetically stable and produced a significantly different calculated pow-der pattern after DFT optimization.
C. Possible phase transitions
The atomic coordinates of the 90 K optimized structure refined against the 90 and 225 K experimental data are given in Tables III and IV, respectively. Some of the structural parameters refined from the recrystallized sample between 85 and 225 K showed some interesting trends. Figure 7 shows the refined unit cell parameters and Figure 8 shows the Bisovalues and central C-C torsion angles. The excursion
in both Biso共N兲 and Biso共C , H兲 below 100 K suggests some
kind of phase transition and is matched by what could be
TABLE III. Atomic coordinates for the 90 K DFT-optimized succinonitrile molecule refined against the experimental data at 90 K.
Atom x y z C1 0.3119共2兲 0.0175共3兲 0.0069共5兲 C2 0.3262共3兲 0.9540共4兲 0.7733共5兲 C3 0.1732共4兲 0.9359共4兲 0.6988共3兲 C4 0.0948共3兲 0.0838共4兲 0.7021共2兲 N1 0.3005共4兲 0.0684共5兲 0.1942共5兲 N2 0.0320共4兲 0.2025共4兲 0.7047共5兲 H1 0.3996共3兲 0.0329共5兲 0.6550共5兲 H2 0.3798共5兲 0.8387共4兲 0.7645共7兲 H3 0.1023共5兲 0.8528共4兲 0.8137共6兲 H4 0.1914共5兲 0.8877共5兲 0.5218共4兲 a= 9.0851共5兲 Å, b = 8.5617共5兲 Å, c = 5.8343共3兲 Å, = 79.295共2兲°; space group P21/a, Biso共C , H兲 = 3.1共1兲Å2, Biso共N兲 = 3.4共1兲Å2, C2-C3 torsion angle= 59.34共3兲°; Rwp= 3.88, GOF= 1.46, DW= 1.65.
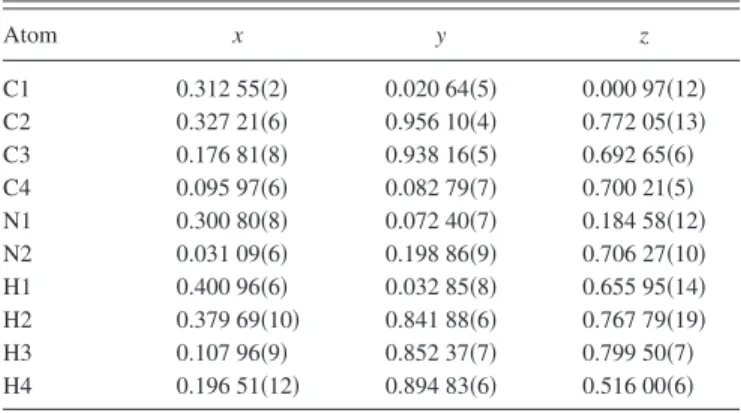
TABLE IV. Atomic coordinates for the 90 K DFT-optimized succinonitrile molecule refined against the experimental data at 225 K.
Atom x y z C1 0.312 55共2兲 0.020 64共5兲 0.000 97共12兲 C2 0.327 21共6兲 0.956 10共4兲 0.772 05共13兲 C3 0.176 81共8兲 0.938 16共5兲 0.692 65共6兲 C4 0.095 97共6兲 0.082 79共7兲 0.700 21共5兲 N1 0.300 80共8兲 0.072 40共7兲 0.184 58共12兲 N2 0.031 09共6兲 0.198 86共9兲 0.706 27共10兲 H1 0.400 96共6兲 0.032 85共8兲 0.655 95共14兲 H2 0.379 69共10兲 0.841 88共6兲 0.767 79共19兲 H3 0.107 96共9兲 0.852 37共7兲 0.799 50共7兲 H4 0.196 51共12兲 0.894 83共6兲 0.516 00共6兲 a= 9.16156共2兲 Å, b= 8.65418共5兲 Å, c= 5.92118共1兲 Å, = 79.9106共4兲°; space group P21/a, Biso共C , H兲 = 5.77共3兲 Å2, Biso共N兲 = 5.96共2兲 Å2, C2-C3 tor-sion angle= 56.518共8兲°; Rwp= 3.94, GOF= 1.40, DW= 1.69.
negative thermal expansion between 90 and 100 K. The graph in Figure 9 showing the closest refined N-N contacts appears to indicate a definite transition below 120 K. The plateau in intermolecular N-N closest contact at about 3.58 Å corresponds very well with the step in plateau from ⬃57.7° to ⬃59° in torsion angles below 125 K seen in Fig-ure 8. An additional change is visible in the torsion angles above 180 K, with a change from the plateau at ⬃57.7° to a sloping temperature dependence down to a torsion angle of 56.5° at 225 K.
The transition below 120 and 125 K appears to be re-lated to intermolecular electrostatic effects given the behav-ior of the closest N-N contacts in Figure 9. The cause of the discontinuities in displacement parameters and lattice param-eters below 110 K and the change in temperature depen-dence of the torsion angle above 180 K are as yet unex-plained. The relatively poor counting statistics in the data above 40° 2in Figure 5 are very obvious. In order to extract additional structural subtleties, the counting statistics in the lower d-spacing range would have to be improved, possibly using a variable-count 共Madsen and Hill, 1994兲 or pseudo-variable count time strategy in the data collection.
D. Texture analysis with spherical harmonics
The 90 K derived structure fitted the data from the re-crystallized samples better than the structure derived from the original 173 K sample cooled in ambient air. Analysis of the spherical harmonics coefficients showed the texture in-dex of the 173 K data refinement with the 90 K model to be 1.21 versus 1.06 for the refinement of the same structure against the 90 K data. This shows that recrystallizing the sample in situ by quenching/rapid cooling reduced signifi-cantly the orientation in this particular case.
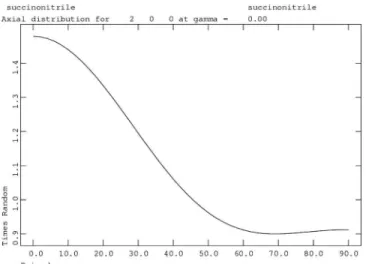
Spherical harmonics orientation corrections can often improve the fit of Rietveld refinements, even where the data, structures, or both are questionable. Ideally, if the proposed structure is correct, the orientation should have a physical basis, e.g., probable direction of the crystallization front. GSAS 共Larson and Von Dreele, 1994兲 was used to plot the axial distributions from the spherical harmonics coefficients. Capillary geometry simplifies the texture significantly. The gamma angle becomes meaningless and the psi angle is sim-ply the angle away from the central axis of the capillary.
The coefficients for the refinements of the 173 K and recrystallized 90 K data are significantly different, and the analysis reinforced this fact as shown in the axial distribu-tions in Figures 10 and 11. The data for the recrystallized
Figure 8. Plot of refined Bisovalues and torsion angle versus temperature.
Figure 9. Variation in intra- and closest N-N intermolecular contact dis-tances with temperature.
Figure 10. Axial distribution calculated along 200 using the refined fourth-order spherical harmonics coefficients for the 90 K dataset.
Figure 7. Refined unit cell volume for succinonitrile between 85 and 225 K.
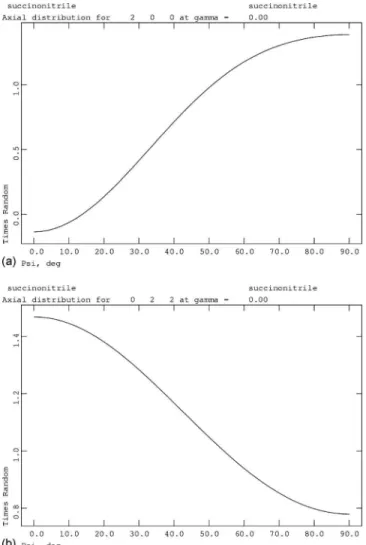
sample at 90 K show the cylinder axis to be oriented along the 关100兴 direction, whereas Figure 11共a兲 shows that the 关100兴 direction is perpendicular to the cylinder axis in the 173 K dataset. Figure 11共b兲 shows that for the 173 K dataset, it is the 关022兴 direction that is orientated along the cylindrical axis. This helps explain why the constrained March-Dollase correction with 关100兴 direction was ineffective in the solution step with the 173 K data, but it would have been perfectly adequate with the 90 K data.
The well-documented crystallization behavior of plastic-crystal succinonitrile in the presence of temperature gradi-ents 共Fedorov et al., 2005兲 may provide a clue as to the origin of the drastically different texture of the two datasets. While the 173 K sample was cooled in ambient lab condi-tions before further cooling, the 90 K sample was crystal-lized in situ directly from the melt using the cryoflow appa-ratus. With ambient air and slow cooling the dominant temperature gradient is likely to be across the capillary, whereas rapid cooling with the cryoflow system will tend to produce a gradient mostly parallel to the nozzle along the capillary axis. This suggests that the succinonitrile tended to crystallize along the 关100兴 direction following the tempera-ture gradient during the transition from the plastic-crystal phase. How much this crystallization behavior depends on the plastic-crystal orientation is uncertain, but in many ways
the plastic-crystal phase behaves very much like a fluid with regard to transport properties 共Alarco et al., 2004兲 because of the orientational disorder, so it is possible that it may also impact the low-temperature crystallization process.
IV. CONCLUSION
A combination of simulated annealing and ab initio DFT optimization has been used to obtain a rigid-body structure for succinonitrile at low temperature. The use of continually resetting second-order spherical harmonics was found to be more reliable than a constrained March-Dollase correction because of the lack of an assumed hkl direction. Two solu-tions were obtained, one at 90 K and the other at 173 K. The structure obtained from the 90 K data has been demonstrated to be the correct one by DFT optimization. The unit cell was found to be monoclinic in P21/a with Z = 4, and the
succi-nonitrile molecules are in the gauche conformation in agree-ment with literature spectroscopy data. The optimized struc-ture was used to refine structural changes in a series of datasets taken between 85 K and just below the plastic-crystal transition at 225 K.
It is worth noting that the solution of the 173 K X-ray data set produced by simulated annealing yielded a model that may have sounded quite plausible in the absence of the correct 90 K solution in view of the X-ray residuals, quality factors, and possibly questionable relative intensities. Even in the absence of a competing model, DFT ab initio optimi-zation methods could label the 173 K model as dubious and probably from a false minimum: the model drifted so far away from its X-ray assigned position and orientation that the powder pattern recalculated from DFT-optimized coordi-nates had little similarity with the experimental one. In con-trast, in the absence of a competing model, the 90 K model could be labeled as most certainly the correct global mini-mum from simulated annealing, as it did not change signifi-cantly under DFT optimization. This observation underscores the usefulness of DFT software as a complement for struc-ture solution from powder diffraction data using global opti-mization techniques, such as simulated annealing. The uncer-tainty in such techniques as to whether the real global minimum has been found is always a concern, especially where the use of constraints and penalty functions can bias the result.
The “correct” solution produces low X-ray data residu-als, a chemically plausible model within experimental error, and resides at an ab initio total-energy minimum. This again demonstrates the complementarity of experimental diffrac-tion and DFT ab initio methods in structural investigadiffrac-tions.
Although the transition below 120 to 125 K may be a result of intermolecular electrostatic interactions between the nitrogens, the apparent transitions below 110 K and above 180 K currently cannot be explained using the structural models used in the analysis. Explanations may become ap-parent with higher quality data with improved counting sta-tistics to lower d-spacings, to allow independent refinement of all the structural parameters.
ACKNOWLEDGMENTS
The authors thank Robert Von Dreele of Argonne Na-tional Laboratory for suggestions regarding the texture
Figure 11. Axial distribution calculated along 共a兲 200 and 共b兲 022 using the refined fourth-order spherical harmonics coefficients for the 173 K dataset.
analysis and Robert Dinnebier of the Max-Planck Institute for Solid State Research for discussions about their results on the structure of succinonitrile and a preprint of his paper prior to submission. The work was partly funded by the Ca-nadian Government Technology and Innovation Initiative and the Canadian Department of National Defense.
Abouimrane, A., Whitfield, P. S., Niketic, S., and Davidson, I. J. 共2007兲. “Investigation of Li salt doped succinonitrile as potential solid electro-lytes for lithium batteries,” J. Power Sources 174, 883–888.
Alarco, P.-J., Abu-Lebdeh, Y., Abouimrane, A., and Armand, M. 共2004兲. “The plastic-crystalline phase of succinonitrile as a universal matrix for solid-state ionic conductors,” Nature Mater. 3, 476–481.
Badea, E., Blanco, I., and Gatta, G. D. 共2007兲. “Fusion and solid-to-solid transitions of a homologous series of alkane-␣,-dinitriles,” J. Chem. Thermodyn. 39, 1392–1398.
Baikie, T., Mercier, P. H. J., Elcombe, M. M., Kim, J. Y., Le Page, Y., Mitchell, L. D., White, T. J., and Whitfield, P. S. 共2007兲. “Triclinic apatites,” Acta Crystallogr., Sect. B: Struct. Sci. 63, 251–256. Carlucci, L., Ciani, G., Proserpio, D. M., and Rizzato, S. 共2002兲.
“Coordi-nation networks from the self-assembly of silver salts and the linear chain dinitriles NC共CH2兲nCN 共n = 2 to 7兲: A systematic investigation of
the role of counterions and of the increasing length of the spacers,” Cryst. Eng. Commun. 4, 413–425.
Coelho, A. A. 共2003兲. “Indexing of powder diffraction patterns by iterative use of singular value decomposition,” J. Appl. Crystallogr. 36, 86–95. Davidson, E. R. 共1983兲. “Matrix eigenvector methods,” in Methods in
Com-putational Molecular Physics, edited by G. H. F. Diercksen and S. Wil-son 共Plenum, New York兲, pp. 95–113.
Derollez, P., Lefebvre, J., Descamps, M., Press, W., and Fontaine, H. 共1990兲. “Structure of succinonitrile in its plastic phase,” J. Phys.: Condens. Matter 2, 6893–6903.
Dinnebier, R. E., Ding, L., Ma, K., Neumann, M. A., Tanpipat, N., Leusen, F. J. J., Stephens, P. W., and Wagner, M. 共2001兲. “Crystal structure of a rigid ferrocene-based macrocycle from high-resolution X-ray powder diffraction,” Organometallics 20, 5642–5647.
Dollase, W. A. 共1986兲. “Correction of intensities for preferred orientation in powder diffractometry: Application of the March model,” J. Appl. Crystallogr. 19, 267–272.
Efron, B. and Tibshirani, 共1986兲. “Bootstrap methods for standard errors, confidence intervals, and other measures of statistical accuracy,” Stat. Sci. 1, 54–77.
Fedorov, O. P., Shpak, A. P., Zhivolub, E. L., and Shuleshova, O. V. 共2005兲. “The influence of crystalline anisotropy on the evolution of the crystal-lization front during directional solidification,” Crystallogr. Rep. 50, 1027–1033.
Fengler, O. I. and Ruoff, A. 共2001兲. “Vibrational spectra of succinonitrile and its 关1 , 4-13C
2兴-, 关2 , 2 , 3 , 3-2H4兴- and 关1 , 4-13C2-2 , 2 , 3 , 3-2H4兴-isotopomers and a force field of succinonitrile,” Spectrochim. Acta, Part A 57, 105–117.
Glicksman, M. E., Scaefer, R. J., and Ayers, J. D. 共1976兲. “Dendritic growth—a test of theory,” Metall. Trans. A 7A, 1747–1759.
Hore, S., Dinnebier, R., Wen, W., Hanson, J., Belabbas, I., Carlsson, J. M., Scheffler, M., and Maier, J. 共2008兲. “High resolution in situ powder diffraction of highly disordered plastic crystal, namely succinonitrile,” Z. Anorg. Allg. Chem. 共in press兲.
Janz, G. J. and Fitzgerald, W. E. 共1955兲. “Infrared spectrum and molecular structure of succinonitrile,” J. Chem. Phys. 23, 1973–1974.
Kresse, G. 共1993兲. Ab initio Molekular Dynamik für flüssige Metalle, Ph.D. Thesis, Technische Universität Wein, Vienna, Austria.
Kresse, G. and Hafner, J. 共1993兲. “Ab initio molecular dynamics for
open-shell transition metals,” Phys. Rev. B: Condens. Matter 48, 13115– 13118.
Kresse, G. and Hafner, J. 共1994兲. “Ab initio molecular-dynamics simulation of the liquid-metal-amorphous-semiconductor transition in germanium,” Phys. Rev. B: Condens. Matter 49, 14251–14269.
Kresse, G. and Joubert, D. 共1999兲. “From ultrasoft pseudopotentials to the projector augmented-wave method,” Phys. Rev. B: Condens. Matter 59, 1758–1775.
Larson, A. C. and Von Dreele, R. B. 共1994兲. General Structure Analysis System (GSAS) 共Report LAUR 86–748兲. Los Alamos National Labora-tory, Los Alamos, New Mexico.
Le Page, Y. and Rodgers, J. R. 共2005兲. “Quantum software interfaced with crystal-structure databases: Tools, results and perspectives,” J. Appl. Crystallogr. 38, 697–705.
Lide, D. R. 共Ed.兲 共2007兲. CRC Handbook of Chemistry and Physics, 88th ed. 共CRC, Cleveland兲.
Long, S., MacFarlane, D. R., and Forsyth, M. 共2003兲. “Fast ion conduction in molecular plastic crystals,” Solid State Ionics 161, 105–112. Looijenga-Vos, A. and Buerger, M. J. 共2006兲. “Space-group determination
and diffraction symbols,” in International Tables for Crystallography, edited by Th. Hahn 共IUCr, Chester兲, Vol. A, pp. 44–54.
Madsen, I. C. and Hill, R. J. 共1994兲. “Collection and analysis of powder diffraction data with near-constant counting statistics,” J. Appl. Crystal-logr. 27, 385–392.
Markvardsen, A. J., David, W. I. F., Johnston, J. C., and Shankland, K. 共2001兲. “A probabilistic approach to space-group determination from powder diffraction data,” Acta Crystallogr., Sect. A: Found. Crystallogr.
57, 47–54.
Mercier, P. H. J., Dong, Z., Baikie, T., Le Page, Y., White, T. J., Whitfield, P. S., and Mitchell, L. D. 共2007兲. “Ab initio constrained crystal-chemical Rietveld refinement of Ca10共VxP1−xO4兲F2 apatites,” Acta Crystallogr., Sect. B: Struct. Sci. 63, 37–48.
Methfessel, M. and Paxton, A. T. 共1989兲. “High-precision sampling for Brillouin-zone integration in metals,” Phys. Rev. B: Condens. Matter
40, 3616–3621.
Monkhorst, H. J. and Pack, J. D. 共1976兲. “Special points for Brillouin-zone integrations,” Phys. Rev. B: Condens. Matter 13, 5188–5192. Neumann, M. A., Tedesco, C., Destri, S., Ferro, D. R., and Porzio, W.
共2002兲. “Bridging the gap—structure determination of the red poly-morph of tetrahexylsexithiophene by Monte Carlo simulated annealing, first-principles DFT calculations and Rietveld refinement,” J. Appl. Crystallogr. 35, 296–303.
Oszlányi, G. and Süto, A. 共2004兲. “Ab initio structure solution by charge flipping,” Acta Crystallogr., Sect. A: Found. Crystallogr. 60, 134–141. Pawley, G. S. 共1981兲. “Unit-cell refinement from powder diffraction scans,”
J. Appl. Crystallogr. 14, 357–361.
Sherwood, J. N. 共1979兲. The Plastically Crystalline State 共Wiley, London兲. Smith, D. K. 共2001兲. “Particle statistics and whole-pattern methods in quan-titative X-ray powder diffraction analysis,” Powder Diffr. 16, 186–191. Smrčok, Ĺ., Jorík, V., Scholtzová, E., and Milata, V. 共2007兲. “Ab initio structure determination of 5-anilino-methylene-2,2-dimethyl-1,3-dioxane-4,6-dione from laboratory powder data—a combined use of X-ray, molecular and solid-state DFT study,” Acta Crystallogr., Sect. B: Struct. Sci. 63, 477–484.
Von Dreele, R. B. 共1997兲. “Quantitative texture analysis by Rietveld refine-ment,” J. Appl. Crystallogr. 30, 517–525.
Whitfield, P. S., Abouimrane, A., and Davidson, I. J. 共2007a兲. “Structure determination from powder diffraction data of some moisture-sensitive network coordination compounds,” Adv. X-Ray Anal. 50, 139–144. Whitfield, P. S., Le Page, Y., Grice, J. D., Stanley, C. J., Jones, G. C.,
Rumsey, M. S., Blake, C., Roberts, A. C., Stirling, J. A. R., and Carpen-ter, G. J. C. 共2007b兲. “LiNaSiB3O7共OH兲—novel structure of the new borosilicate mineral jadarite determined from laboratory powder diffrac-tion data,” Acta Crystallogr., Sect. B: Struct. Sci. 63, 396–401.