Publisher’s version / Version de l'éditeur:
Synthetic Metals, 158, August 14, pp. 577-584, 2008
READ THESE TERMS AND CONDITIONS CAREFULLY BEFORE USING THIS WEBSITE.
https://nrc-publications.canada.ca/eng/copyright
Vous avez des questions? Nous pouvons vous aider. Pour communiquer directement avec un auteur, consultez la première page de la revue dans laquelle son article a été publié afin de trouver ses coordonnées. Si vous n’arrivez pas à les repérer, communiquez avec nous à [email protected].
Questions? Contact the NRC Publications Archive team at
[email protected]. If you wish to email the authors directly, please see the first page of the publication for their contact information.
NRC Publications Archive
Archives des publications du CNRC
This publication could be one of several versions: author’s original, accepted manuscript or the publisher’s version. / La version de cette publication peut être l’une des suivantes : la version prépublication de l’auteur, la version acceptée du manuscrit ou la version de l’éditeur.
For the publisher’s version, please access the DOI link below./ Pour consulter la version de l’éditeur, utilisez le lien DOI ci-dessous.
https://doi.org/10.1016/j.synthmet.2008.04.004
Access and use of this website and the material on it are subject to the Terms and Conditions set forth at
Fabrication of poly-3-hexylthiophene/polyethylene oxide nanofibers
using electrospinning
Laforgue, Alexis; Robitaille, Lucie
https://publications-cnrc.canada.ca/fra/droits
L’accès à ce site Web et l’utilisation de son contenu sont assujettis aux conditions présentées dans le site LISEZ CES CONDITIONS ATTENTIVEMENT AVANT D’UTILISER CE SITE WEB.
NRC Publications Record / Notice d'Archives des publications de CNRC:
https://nrc-publications.canada.ca/eng/view/object/?id=d4ea8151-ee63-4e8d-a92e-8a1d79d3d19d
https://publications-cnrc.canada.ca/fra/voir/objet/?id=d4ea8151-ee63-4e8d-a92e-8a1d79d3d19d
Alexis Laforgue
∗, Lucie Robitaille
National Research Council Canada, Industrial Materials Institute, Functional Polymer Systems, Boucherville, Qu´ebec J4B 6Y4, Canada
a r t i c l e
i n f o
Article history:
Received 22 October 2007
Received in revised form 15 January 2008 Accepted 3 April 2008
Available online 21 May 2008
Keywords: Nanofibers Electrospinning Poly-3-hexylthiophene Conducting fiber
a b s t r a c t
P3HT–PEO blend nanofibers were produced by electrospinning from chloroform solutions. A morpholog-ical study was carried out as a function of the processing parameters as well as the ratio between the two polymers. The fibers containing at least 60 wt.% of P3HT presented striated surfaces that could be explained by the alignment of the polymer domains along the fiber axis. The structural arrangement of the polymers was found to vary according to the polymers relative contents. The maximum electrical conductivity found for unaligned mats was 0.16 S/cm and increased to 0.3 S/cm when the nanofibers were aligned along a preferential direction.
Crown Copyright © 2008 Published by Elsevier B.V. All rights reserved.
1. Introduction
Since the discovery of intrinsically conducting polymers (ICPs) 30 years ago[1,2], an incredible amount of work has been done on the development of this new class of polymers, leaded by the will to use the fabulous and unique set of properties that they offer: switchable and tunable semi-conductivity, thermo-, solvato- and electrochromism, photo- and electroluminescence, solar conver-sion capabilities (photovoltaic), energy storage, etc.
Besides, the entrance in the 21st century comes along with the intensive development of nanotechnologies, which opens wide new areas of development for the ICPs. Indeed, the structure control at the nano-scale is one of the major issues that need to be addressed before a number of new technologies based on the properties of ICPs can be successfully deployed, especially in the area of organic electronics. Hence, synthesis and process-ing of controlled ICP nanostructures is the subject of extensive research, going from the direct synthesis of nanofibers[3–6]or precisely defined block copolymers[7–11], to the nanopattern-ing of ICPs usnanopattern-ing lithography methods or self-assembly templates
[12–16].
Among these techniques, the processing of ICPs into nanofibers using the electrospinning technique is a method of choice for its versatility and the level of control that can be reached by tuning the
∗ Corresponding author. Tel.: +1 450 641 5222; fax: +1 450 641 5105.
E-mail address:[email protected](A. Laforgue).
process parameters[17–19]. Electrospinning has been successfully used to produce nanofibers of polyaniline (PANI)[20–23], polypyr-role (PPy)[24–30], poly(p-phenylene vinylenes) (PPVs)[27–33]as well as polythiophenes (PThs)[34–38].
Since the ICPs generally have rigid backbones, the level of chain entanglements required to form the fibers is usually not reached by these polymers. Different strategies have been used to over-come this problem: the use of more flexible polymer precursors or even monomers that can be converted into ICPs in a second step[27,28,39–41], the addition of a spinable polymer to assist the formation of fibers[20,26,32], or the use of a core–shell coaxial electrospinning strategy, the ICP being the core and the spinable polymer being the post-removable shell[37]or inversely, the spin-able polymer as the core and the ICP as the shell[42]. All of these strategies have been used with success and present their respective set of advantages and limitations.
In this paper, we report the fabrication of nanofibers of blends of poly-3-hexylthiophene (P3HT) and polyethylene oxide (PEO) using the electrospinning technique. P3HT is a polymer of great interest, widely used in organic electronics, especially in photo-voltaic devices. The processing of P3HT into nanofibers could have important advantages towards film-casting, particularly to enhance the active surface area. PEO was chosen as the spinable polymer since it is known to be easily electrospun and relatively soluble in chloroform, also a good solvent for P3HT. Nanofibers of rela-tively high molecular weight P3HT have already been electrospun, but the reports were focussed on theoretical studies about hole mobility in field effect transistors made with one single nanofiber
0379-6779/$ – see front matter. Crown Copyright © 2008 Published by Elsevier B.V. All rights reserved. doi:10.1016/j.synthmet.2008.04.004
578 A. Laforgue, L. Robitaille / Synthetic Metals 158 (2008) 577–584
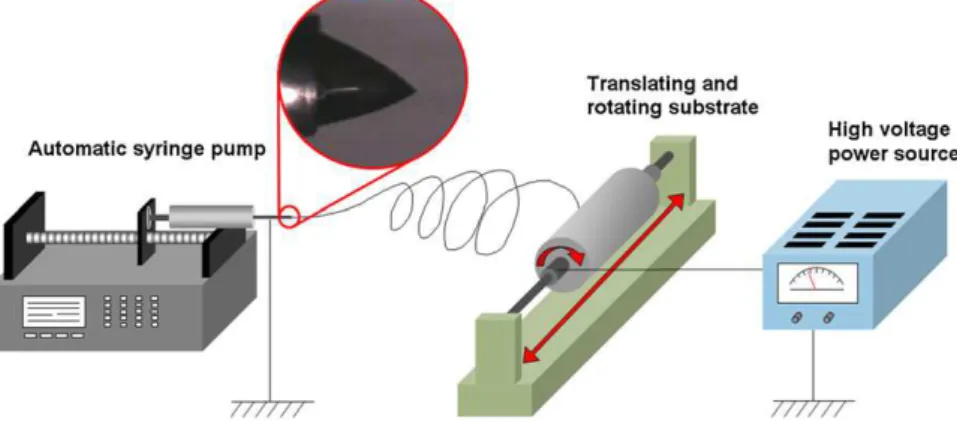
Fig. 1. Electrospinning setup at NRC-IMI. Inset is a photograph of the Taylor cone.
[34,35]. This paper will present an exhaustive morphological study of the P3HT–PEO nanofibers as a function of various electrospinning parameters. A study of the conducting properties of the nanofibers will also be presented.
2. Experimental
2.1. Materials
Regio-random poly-3-hexylthiophene was chemically synthe-sized using the FeCl3 oxidation method, as described elsewhere
[43,44](Mw = 43,700 g/mol (PS standard); PDI = 2.8 as determined by gel permeation chromatography in THF; 72% head-to-tail diad content estimated by1H NMR in the ␣-methylene region[45]).
Polyethylene oxide (Mw = 1,000,000 g/mol) was purchased from Polysciences (USA, PA). Anhydrous chloroform (CHCl3) and
tetrahy-drofuran (THF) (Sigma–Aldrich, USA) were used as received to prepare the electrospinning solutions.
The electrospinning solutions were prepared by dissolving the polymers simultaneously into CHCl3or THF and gently stirred for a
minimum of 12 h. The solution temperature was raised to ∼50◦C for
the first 30–60 min to assure complete dissolution of the polymers.
2.2. Electrospinning
The polymer solutions were filled into a glass syringe terminated by a stainless steel needle (no. 20: ext= 0.91 mm; int= 0.58 mm).
The syringe was placed in an automatic pump (Harvard Apparatus PHD4400) and grounded (cf.Fig. 1). A stainless steel substrate was connected to a high voltage power supply (Gamma High Voltage Research Model ES75P-10 W). In the following text, D represents the distance between the tip of the needle and the substrate. For the electrical conductivity measurements, the nanofiber mats were
electrospun on a non-conductive polyimide sheet (Thermalimide RCBS from Airtech, 50 m thick) which served as a rigid substrate easier to handle than the unsupported mat.
2.3. Characterization
Scanning electron microscopy was performed on a Hitachi S4700 microscope. For the diameter analysis, histograms were built using SEM image analysis on a minimum of 50 fibers taken at sev-eral positions on the sample.
Electrical conductivity measurements were carried out under ambient conditions after iodine vapour doping for at least 4 h, to ensure complete doping of the polymer (usually reached within 1 h). The measurements were performed by the four-point probe method using a Bekktech conductivity cell and using a VMP3 mul-tipotentiostat (Princeton Applied Research, USA). The conductivity measurements were systematically taken within 5 min after the samples were taken out of the doping medium, to eliminate the effect of de-doping over time. At least three measures were taken for each sample and average values are reported in this publica-tion. It is important to note that iodine doping is not stable in time and was only used to characterize the P3HT conductivity percolation behaviour in the blended fibers. To achieve a sta-ble conductivity, the P3HT would have to be doped with other molecules [46] or polyelectrolytes as in the case of PEDOT–PSS
[47].
Transmission electron microscopy (TEM) was performed either on a JEOL JEM2000FX operated at 80 kV or on FEI Philips Tecnai 12 at 120 kV. For TEM observation, the electrospun mats were embed-ded into an epoxy resin and cut into 50–80 nm lamellas using a Leica Ultracut UCT ultramicrotome equipped with a EM FCS cry-ochamber. The samples were observed after either RuO4staining
(30 min), I2staining (15 min to 1 h) or without staining.
Fig. 2. SEM micrographs of electrosprayed P3HT solutions in CHCl3(a) or THF (b). Polymer concentration: 3 wt.%. Insets are closer views of the surface structures. Scale bars
Fig. 3. Optical microscopy image of P3HT–PEO nanofibers containing 75 wt.% of
P3HT. Scale bar represents 50 m.
3. Results and discussion
3.1. Effect of processing variables
P3HT was first electrospun in THF or CHCl3at concentrations of
3 and 6 wt.%. Solutions of higher concentrations were too viscous to be electrospun. The process was very stable at concentrations between 3 and 6 wt.% but did not lead to the formation of fibers, as can be observed inFig. 2. The microstructures obtained are between those obtained from an electrospraying process and nanofibers obtained by electrospinning. They can be described as a 3D network of linked polymer droplets. The short chain length (low molec-ular weight) of the polymer used in this study can most likely explain the lack of chains entanglement resulting in the formation of these structures[26,48]. The rigidity of the backbone of this type of polymers is also an important factor that affects the degree of entanglement.
In a second step, high molecular weight PEO was added to the P3HT solutions to assist the formation of fibers. For the follow-ing experiments, CHCl3 was used as the solution solvent. When
a small amount of PEO was added to the P3HT solution, fibers were easily produced.Fig. 3shows an optical microscopy image of P3HT–PEO nanofibers. They have the bright red color characteris-tic of undoped poly-3-alkylthiophenes. The overall process showed significant similarities with the electrospinning of pristine PEO nanofibers in chloroform, in terms of Taylor cone shape, jet sta-bility and whipping behaviour. These observations tend to show that the fiber formation of the PEO chains is the phenomenon that controls the process.
However, obtaining perfect non-beaded fibers required a good control of the processing parameters. The electrospinning process was stable only when the flow rate was maintained above 0.2 ml/h. Below this value, rapid solidification of the polymers at the needle tip blocked the solution inside the needle.
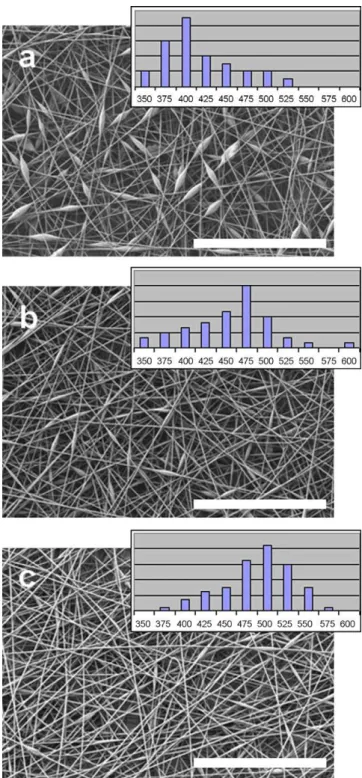
The voltage was found to be a critical parameter in the pro-duction of non-beaded fibers, as illustrated for the thinnest fibers obtained with a P3HT content of 75 wt.%.Fig. 4shows the scanning electron micrographs of nanofibers obtained with 3P3HT–1PEO solutions under different voltage conditions. At 14 kV, the fibers presented many beads even if the electrospinning process was per-fectly stable. By increasing the voltage, the beads progressively disappeared from the fibers and above 22 kV non-beaded fibers were obtained. The fibers’ average diameter was found to increase from 400 to 500 nm, as an increasing quantity of polymer material
Fig. 4. SEM micrographs of nanofibers containing 75 wt.% of P3HT, obtained at
dif-ferent voltages: 14 kV (a), 18 kV (b) and 22 kV (c). D = 10 cm; flow rate = 0.5 ml/h;
T = 21◦C; RH = 23%. Insets are the histograms of the fiber diameters (in nm). Scale
bars represent 50 m.
was introduced into the fibers instead of being agglomerated into the beads.
3.2. Morphology study
A morphological study was carried out on nanofibers with dif-ferent P3HT contents.Fig. 5presents SEM images of electrospun mats obtained with P3HT contents varying from 86 to 33 wt.%.
With most of the solution compositions, the fiber diameter could be tuned to a certain extent by varying the voltage and/or distance
580 A. Laforgue, L. Robitaille / Synthetic Metals 158 (2008) 577–584
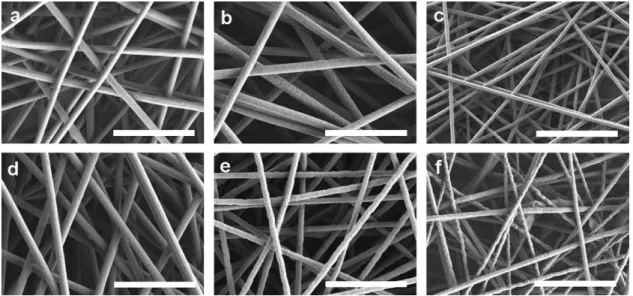
Fig. 5. SEM micrographs of P3HT–PEO nanofibers with various PEO and P3HT concentrations (in wt.%): 3P3HT–0.5PEO (a), 3P3HT–0.75PEO (b), 3P3HT–1PEO (c), 3P3HT–2PEO
(d), 2P3HT–2PEO (e) and 1P3HT–2PEO (f). Corresponding P3HT content in the fibers: 86 wt.% (a), 80 wt.% (b), 75 wt.% (c), 60 wt.% (d), 50 wt.% (e) and 33 wt.% (f). D = 15 cm (a–e) and 10 cm (f); flow rate = 0.5 ml/h; voltage = 24 ± 1 kV (a–e) and 32 kV (f); T = 21–23◦C; RH = 15–23%. Scale bars represent 10 m.
Fig. 6. Histograms of the fiber diameters for the samples shown inFig. 4(X axis: nm, Y axis: arbitrary units).
between the needle and the substrate. The fibers shown inFig. 5
were the thinnest obtained for each composition, and hence the experimental parameters can differ slightly from one sample to another. In all cases, the process was very stable and fibers could be collected continuously for long times. The histograms of the fiber diameter distributions of the above samples are displayed inFig. 6. As can be seen, the fibers were obtained with quite uniform size dis-tributions. There are apparently no obvious relationships between the polymer ratio and the fiber diameter, however, some trends can still be extracted from the results.
Indeed, in the series a–d (Figs. 5 and 6), the P3HT content in solution was maintained constant at 3 wt.% and the PEO content increased from 0.5 wt.% (a) to 2 wt.% (d). The fibers obtained by adding 0.5 wt.% of PEO to the 3 wt.% solution of P3HT have an average diameter of 850 nm (cf.Figs. 5 and 6a). The addition of 0.75 wt.% PEO made the average diameter increase to 1100 nm (cf.Figs. 5 and 6b). However, at 1 wt.% PEO the average diameter decreased unexpectedly (and with reproducibility) to 500 nm (cf.
Figs. 5 and 6c), and then increased back at 1000 nm for fibers con-taining 2 wt.% PEO (cf.Figs. 5 and 6d). This special electrospinning
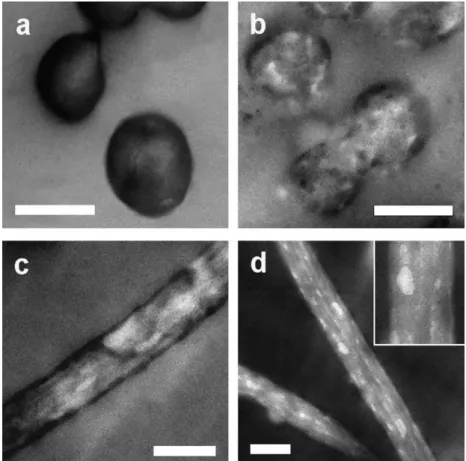
Fig. 8. TEM images of fibers with 75 wt.% P3HT stained using RuO4(a), not stained (b, c) and stained with I2(d). All scale bars represent 500 nm.
regime found at 3 wt.% P3HT and 1 wt.% PEO is not well under-stood yet and is currently under investigation. Due to viscosity issues, the ratio study was completed by maintaining 2 wt.% of PEO and decreasing the P3HT content. As expected, the fiber diameter decreased with the total polymer concentration: 1000 nm at 5 wt.% (cf.Figs. 5 and 6d), 850 nm at 4 wt.% (cf.Figs. 5 and 6e) and 500 nm at 3 wt.% (cf.Figs. 5 and 6f).
All fibers produced in this study presented a textured surface. Fibers having a P3HT content above 60 wt.% generally presented striated surfaces, as can be observed inFig. 7. This observation tends to indicate that the structure is composed of segregated domains of P3HT and PEO aligned along the fiber axis. How-ever, X-ray diffraction experiments did not show any evidence of crystallinity. Interestingly, in a very similar study recently pub-lished, the authors performed confocal fluorescence measurements on poly-3-dodecylthiophene/polyethyleneoxide electrospun fibers which indicated the alignment of co-continuous domains of the two polymers along the fiber axis[38].
To further investigate the blend morphology in these nanofibers, TEM experiments were carried out.Fig. 8shows transmission elec-tron micrographs of the fibers stained by different methods to enhance the contrast between the polymers as well as the epoxy surrounding the fibers. P3HT is more effectively stained by RuO4
and I2than PEO due to stronger interactions with the sulfur atom
in P3HT than with the oxygen atom in PEO. Therefore P3HT appears darker in the TEM images. Moreover, the sulfur atom being heavier than the oxygen one, P3HT also appears darker when the samples are not stained[49]. InFig. 8, the dark areas located essentially at the surface of the fibers are believed to be P3HT dense domains that have segregated at the surface of the fibers. It is clear from
Fig. 8b and c that this external layer (30 to 60 nm thick) is not totally uniform along the fiber structure. This chemically heteroge-neous surface could explain the surface striations observed by SEM. The solvent evaporation rate is most likely different depending on the chemical nature of the surface, and the striations are believed to appear because of a heterogeneous shrinkage upon solvent
Fig. 9. SEM images of nanofibers with different P3HT contents: 50 wt.% (RH 15–23%) (a), 33 wt.% (RH 15–23%) (b) and 50 wt.% (RH 39%) (c). T = 21–23◦C. All scale bars represent
582 A. Laforgue, L. Robitaille / Synthetic Metals 158 (2008) 577–584
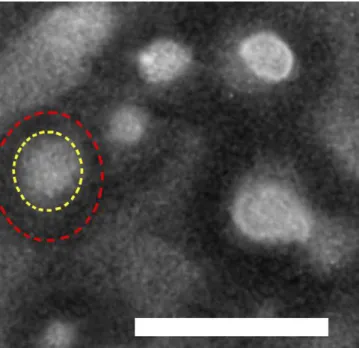
Fig. 10. Cross-sectional TEM image of fibers containing 33 wt.% of P3HT (I2stained).
Scale bar represents 1 m.
evaporation. The internal structure of the fibers seems to be rather heterogeneous, as suggested by the disordered white and grey areas being observed onFig. 8a–c. I2 staining allowed a more accurate
observation of the arrangement of the two polymers in the fiber (cf.Fig. 8d). Stretched domains of PEO (bright areas) appear well aligned along the fiber axis, surrounded by a P3HT matrix. Based on these observations and the ones made by Bianco et al.,[38]we con-clude that the polymers have segregated into separated domains. It can be noted that I2heavily stained the surrounding epoxy, making
it appear darker than the fibers and making the observation of the dense P3HT surface layer difficult.
The surface of the fibers drastically changed when the P3HT content became lower or equal to 50 wt.%: the surface striations were replaced by very heterogeneous surface features, as can be observed inFig. 9a–c. These results are believed to be related to superior phase separation in the polymer blends. P3HT being the
Fig. 11. Electrical conductivity of P3HT–PEO nanofibers as a function of the P3HT
content in the nanofibers.
minor component in these blends, it is surrounded by PEO in the structures, and tends to agglomerate and form irregular nodules, as already observed in electrospun blends involving P3HT and other polymers[50]. Besides, it seems that the interactions with the sol-vent play an important role in the phase separation process, as it is significantly enhanced when the relative humidity is increased from 23 to 39% (Fig. 9a compared to9c).
The TEM image presented in Fig. 10 shows more accurately the internal structure of fibers containing 33 wt.% of P3HT. A core–sheath structure seems to be obtained, the P3HT forming the sheath (red circle in the figure) around a dense PEO core (yellow circle in the figure). This confirms a more important segregation between the polymer domains. It is important to note that the het-erogeneity of the surface makes the thickness of the P3HT layer appear larger than the actual one.
3.3. Conductivity study
Electrical conductivity measurements of the nanofiber mats were performed under ambient conditions after iodine vapour dop-ing. The conductivity of undoped fiber mats was found in the range of 10−9S/cm. This value is in agreement with previously reported
data[51,52].
Fig. 11shows the conductivity of doped nanofibers at various P3HT contents. The maximum conductivity of 0.16 ± 0.02 S/cm was obtained for fibers containing above 75 wt.% of P3HT. As a compar-ison, a cast film of the same composition showed a conductivity of 2.0 ± 0.1 S/cm, i.e. one order of magnitude higher. This difference of conductivity between cast films and electrospun fiber mats has also been observed for PANI.HCSA/PEO blends[20]. It is important to note that the four-point probe technique provides volumic conduc-tivities and is only suitable for bulk materials, not for highly porous materials like electrospun nanofiber mats. Hence, the electrical conductivity values obtained for the mats are only apparent con-ductivities, and do not apply to single fibers, which should present significantly higher conductivities.
The following experiment clearly illustrates this effect: P3HT–PEO nanofibers with 75 wt.% P3HT were electrospun between two metallic plates separated by a 3 cm gap. This method has been successfully used to obtain aligned electrospun nanofibers
[53]. Using this technique, it was possible to obtain mats of nanofibers aligned along a preferential axis (cf.Fig. 12). The electri-cal conductivity of such an aligned mat of fibers was measured to be 0.30 ± 0.02 S/cm (measures taken along the aligned axis), i.e. twice
Fig. 12. SEM micrograph of an aligned mat of P3HT–PEO nanofibers containing
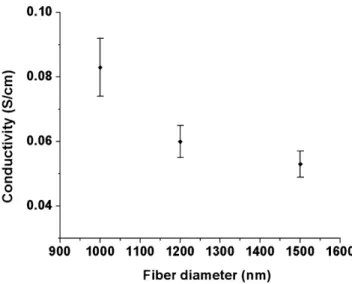
Fig. 13. Electrical conductivity of P3HT–PEO nanofiber mats containing 60 wt.% of
P3HT as a function of the fiber diameter.
the conductivity of an unaligned fiber mat of the same composition. This result indicates that the electrical conductivities measured by the four-point probe method are related not only to the intrinsic properties of the material, but also to the geometric structure of the sample.
By varying the voltage and/or the distance between the needle and the fiber collector (D), it was also possible to modify the average fiber diameter of the electrospun fiber mats (not aligned). This was done with fibers containing 60 wt.% of P3HT and the results are presented inFig. 13. This graph shows the electrical conductivities of unaligned fiber mats, plotted as a function of the fibers average diameter. This study clearly demonstrates that the conductivity of a fiber mat increases when the fiber diameter decreases. A similar observation has already been made on PEDOT.PSS/PAN electrospun nanofibers[36,54].
Two phenomena could explain this observation. The first one occurs at the fiber level, the second one at the mat level. In the first case, the increased fiber stretching and related decrease of fiber diameter is believed to be directly related to a more significant polymer compaction in the fiber: when more stretched, the poly-mer chains are more compacted in the fibers, leading to a decreased diameter. The chains within the fibers would then have better inter-actions with their neighbours, the lack of which is known to be the main limiting parameter to electrical conductivity. The poly-mer chain compaction should then lead to better charge transport inside the fibers. Alternatively, giving that the measured conduc-tivity is a volumic one, the observed increase of conducconduc-tivity could also be explained by the increase in the packing density of the mat: the decrease in fiber diameter allows the deposition of more fibers in a given volume, resulting in a larger number of electronic paths usable for the conduction.
Eventually, the measurement of the conductivity of a single fiber would be interesting to discriminate between the two phenom-ena. However, this represents a major technical challenge[55]and this measurement is not crucial to applications using whole fiber mats.
4. Conclusions
Nonwoven mats of P3HT–PEO fibers with diameters down to 500 nm have been obtained by the electrospinning technique. Both SEM and TEM measurements revealed that the polymer domains are aligned along the fiber axis. The structural arrangement of the
References
[1] C.K. Chiang, C.R. Fincher, Y.W. Park, A.J. Heeger, H. Shirakawa, E.J. Louis, S.C. Gau, A.G. MacDiarmid, Phys. Rev. Lett. 39 (1977) 1098.
[2] H. Shirakawa, E.J. Louis, A.G. MacDiarmid, C.K. Chiang, A.J. Heeger, J. Chem. Soc., Chem. Commun. (1977) 578.
[3] Z. Zhang, Z. Wei, M. Wan, Macromolecules 35 (2002) 5937. [4] L. Zhang, L. Zhang, M. Wan, Y. Wei, Synth. Met. 156 (2006) 454. [5] J. Huang, R.B. Kaner, J. Am. Chem. Soc. 126 (2004) 851. [6] X. Zhang, S.K. Manohar, J. Am. Chem. Soc. 126 (2004) 12714.
[7] A.D. Cuendias, M.L. Hellaye, S. Lecommandoux, E. Cloutet, H. Cramail, J. Mater. Chem. 15 (2005) 3264.
[8] S. Luebben, S. Sapp, B. Elliott, W. Ellis, E. Chang, R. D’Sa, Polym. Mater.: Sci. Eng. 91 (2004) 979.
[9] C.P. Radano, O.A. Scherman, N. Stingelin-Stutzmann, C. M ¨uller, D.W. Breiby, P. Smith, R.A.J. Janssen, E.W. Meijer, J. Am. Chem. Soc. 127 (2005) 12502. [10] P. Lecl `ere, E. Hennebicq, A. Calderone, P. Brocorens, A.C. Grimsdale, K. M ¨ullen,
J.L. Br ´edas, R. Lazzaroni, Prog. Polym. Sci. 28 (2003) 55.
[11] R.D. McCullough, J. Liu, P.C. Ewbank, E.E. Sheina, US patent 2003/6,602,974. [12] D.A. Acevedo, A.F. Lasagni, C.A. Barbero, F. M ¨ucklich, Adv. Mater. 19 (2007) 1272. [13] M. Woodson, J. Liu, J. Am. Chem. Soc. 128 (2006) 3760.
[14] S.I. Yoo, B.-H. Sohn, W.-C. Zin, J.C. Jung, Langmuir 20 (2004) 10734. [15] S.-Y. Jang, M. Marquez, G.A. Sotzing, Synth. Met. 152 (2005) 345. [16] B. Fabre, D.D.M. Wayner, Comptes Rendus Chimie 8 (2005) 1249.
[17] S.V.N.T. Kuchibhatla, A.S. Karakoti, D. Bera, S. Seal, Prog. Mater. Sci. 52 (2007) 699.
[18] A. Bolognesi, C. Botta, C. Mercogliano, W. Porzio, P.C. Jukes, M. Geoghegan, M. Grell, M. Durell, D. Trolley, A. Das, J.E. Macdonald, Polymer 45 (2004) 4133. [19] Z.-M. Huang, Y.-Z. Zhang, M. Kotaki, S. Ramakrishna, Compos. Sci. Technol. 63
(2003) 2223.
[20] I.D. Norris, M.M. Shaker, F.K. Ko, A.G. MacDiarmid, Synth. Met. 114 (2000) 109. [21] D. Aussawasathien, J.-H. Dong, L. Dai, Synth. Met. 154 (2005) 37.
[22] S.-H. Lee, J.-W. Yoon, M.H. Suh, Macromol. Res. 10 (2002) 282.
[23] Y. Zhu, J. Zhang, Y. Zheng, Z. Huang, L. Feng, L. Jiang, Adv. Funct. Mater. 16 (2006) 568.
[24] T.S. Kang, S.W. Lee, J. Joo, J.Y. Lee, Synth. Met. 153 (2005) 61.
[25] S. Nair, S. Natarajan, S.H. Kim, Macromol. Rapid Commun. 26 (2005) 1599. [26] I.S. Chronakis, S. Grapenson, A. Jakob, Polymer 47 (2006) 1597.
[27] H. Okuzaki, T. Takahashi, N. Miyajima, Y. Suzuki, T. Kuwabara, Macromolecules 39 (2006) 4276.
[28] C. Wang, W. Zhang, Z.H. Huang, E.Y. Yan, Y.H. Su, Pigment Resin Technol. 35 (2006) 278.
[29] Y. Xin, Z.H. Huang, E.Y. Yan, W. Zhang, Q. Zhao, Appl. Phys. Lett. 89 (2006) 053101. [30] W. Zhang, Z. Huang, E. Yan, C. Wang, Y. Xin, Q. Zhao, Y. Tong, Mater. Sci. Eng. A
443 (2007) 292.
[31] W. Zhang, E. Yan, Z. Huang, C. Wang, Y. Xin, Q. Zhao, Y. Tong, Eur. Polym. J. 43 (2007) 802.
[32] S. Chuangchote, T. Srikhirin, P. Supaphol, Macromol. Rapid Commun. 28 (2007) 651.
[33] C. Wang, E. Yan, Z. Huang, Q. Zhao, Y. Xin, Macromol. Rapid Commun. 28 (2007) 205.
[34] R. Gonzalez, N.J. Pinto, Synth. Met. 151 (2005) 275.
[35] H. Liu, C.H. Reccius, H.G. Craighead, Appl. Phys. Lett. 87 (2005) 1. [36] A.K. El-Aufy, B. Naber, F.K. Ko, Polym. Prepr. 44 (2003) 134. [37] D. Li, A. Babel, S.A. Jenekhe, Y. Xia, Adv. Mater. 16 (2004) 2062.
[38] A. Bianco, C. Bertarelli, S. Frisk, J.F. Rabolt, M.C. Gallazzi, G. Zerbi, Synth. Met. 157 (2007) 276.
[39] S.-Y. Jang, V. Seshadri, M.-S. Khil, A. Kumar, M. Marquez, P.T. Mather, G.A. Sotzing, Adv. Mater. 17 (2005) 2177.
[40] H. Okuzaki, T. Aoyama, T. Abe, Y. Ito, US patent 2005/0287366.
[41] W.J. Belcher, A.G. MacDiarmid, D.L. Officer, S. B. Hall, International patent WO2006/001719.
[42] Q. Zhao, Y. Xin, Z. Huang, S. Liu, C. Yang, Y. Li, Polymer 48 (2007) 4311. [43] R.-I. Sugimoto, S. Takeda, H.B. Gu, K. Yoshino, Chem. Express 1 (1986) 635. [44] H. Mao, B. Xu, A.S. Holdcroft, Macromolecules 26 (1993) 1163.
584 A. Laforgue, L. Robitaille / Synthetic Metals 158 (2008) 577–584
[45] S. Amou, O. Haba, K. Shirato, T. Hayakawa, M. Ueda, K. Takeushi, M. Asai, J. Appl. Polym. Sci. 37 (1999) 1943.
[46] C. Clarisse, D. Delabouglise, J.-L. Ciprelli, International patent WO95/27289. [47] S. Kirchmeyer, K. Reuter, J. Mater. Chem. 15 (2005) 2077.
[48] S.L. Shenoy, W.D. Bates, H.L. Frisch, G.E. Wnek, Polymer 46 (2005) 3372. [49] Z. Sun, E. Zussman, A.L. Yarin, J.H. Wendorff, A. Greiner, Adv. Mater. 15 (2003)
1929.
[50] A. Babel, D. Li, Y. Xia, S.A. Jenekhe, Macromolecules 38 (2005) 4705. [51] S.-A. Chen, C.-S. Liao, Macromolecules 26 (1993) 2810.
[52] J.E. Osterholm, P. Passiniemi, Synth. Met. 18 (1987) 213. [53] D. Li, Y. Wang, Y. Xia, Adv. Mater. 16 (2004) 361. [54] A.K. El-Aufy, Ph.D. thesis, Drexel University, PA USA, 2004.
[55] Z. Niu, J. Liu, A. Lee, M.A. Bruckman, D. Zhao, G. Koley, Q. Wang, Nano Lett. 7 (2007) 3729.