Publisher’s version / Version de l'éditeur:
Journal of Fluorescence, 20, 4, pp. 857-863, 2010-07-01
READ THESE TERMS AND CONDITIONS CAREFULLY BEFORE USING THIS WEBSITE.
https://nrc-publications.canada.ca/eng/copyright
Vous avez des questions? Nous pouvons vous aider. Pour communiquer directement avec un auteur, consultez la
première page de la revue dans laquelle son article a été publié afin de trouver ses coordonnées. Si vous n’arrivez pas à les repérer, communiquez avec nous à PublicationsArchive-ArchivesPublications@nrc-cnrc.gc.ca.
Questions? Contact the NRC Publications Archive team at
PublicationsArchive-ArchivesPublications@nrc-cnrc.gc.ca. If you wish to email the authors directly, please see the first page of the publication for their contact information.
NRC Publications Archive
Archives des publications du CNRC
This publication could be one of several versions: author’s original, accepted manuscript or the publisher’s version. / La version de cette publication peut être l’une des suivantes : la version prépublication de l’auteur, la version acceptée du manuscrit ou la version de l’éditeur.
For the publisher’s version, please access the DOI link below./ Pour consulter la version de l’éditeur, utilisez le lien DOI ci-dessous.
https://doi.org/10.1007/s10895-010-0629-x
Access and use of this website and the material on it are subject to the Terms and Conditions set forth at
On the emission intensity of fluorescent microspheres in cardiac tissue images
Gussakovsky, Eugene; Yang, Yanmin
https://publications-cnrc.canada.ca/fra/droits
L’accès à ce site Web et l’utilisation de son contenu sont assujettis aux conditions présentées dans le site LISEZ CES CONDITIONS ATTENTIVEMENT AVANT D’UTILISER CE SITE WEB.
NRC Publications Record / Notice d'Archives des publications de CNRC:
https://nrc-publications.canada.ca/eng/view/object/?id=1c91c7cc-fa95-4a42-a29b-5b97506a0e67 https://publications-cnrc.canada.ca/fra/voir/objet/?id=1c91c7cc-fa95-4a42-a29b-5b97506a0e67
On the Emission Intensity of Fluorescent Microspheres in Cardiac Tissue
Images
Gussakovsky, Eugene; Yang, Yanmin
Abstract
Formulations for the total fluorescence intensity of fluorescent microspheres in slabs of cardiac tissue were determined experimentally and theoretically. The tissue depth, at which the slab can be considered as a semi-infinite turbid medium, and critical layer thickness, which accounts for the most emission intensity were evaluated to be 8–9 and 3–5 mm, respectively, for the cardiac tissue. When fluorescent microspheres are linearly distributed across the slab depth, the mean absorption of them is proportional to the sum of their normalized total emissions in the slab excited from both sides. The formulations may be used for the fluorescence images analysis of cardiac and other biological tissues.
Keywords Fluorescence imaging - Cardiac tissue - Fluorescent microspheres
Introduction
Fluorescence of biological tissues has been discussed in multiple reviews [1, 2]. They consider intrinsic fluorescence originating from biological chromophores like aromatic amino acids, fluorescent cross-links in collagen and elastin, fluorescent cofactors, etc. Other type of fluorescent agents, which are employed to solve biomedical problems, are fluorescent dyes. Among many other applications of the dyes, fluorescent dye-labeled microspheres were found to be extremely useful for measurements of coronary flow. The microspheres made of polystyrene loaded with appropriate dye prevent its washout into the aqueous media when injected into the blood circulation. The diameter of microspheres (typically 10–15 μm) is larger than the diameter of capillaries (∼5 μm), which results in the entrapment of microspheres in cardiac tissue in proportion to coronary flow. Subsequent extraction of microspheres and dye from pieces of tissue allows quantification of their content and hence coronary flow in three dimensions. However the method is laborious and spatial resolution is limited by tissue cube size (l = 2– 3 mm) as the microsphere amount is inversely proportional to l 3 [3, 4].
In an attempt to overcome the limitations of the ―destruction & extraction‖ method, fluorescence imaging of fluorescent microspheres in biomedical samples was employed for qualitative and quantitative characterization of microsphere deposition and blood flow [5–7]. In particular, fluorescence images of frozen thin (30 μm) rabbit heart slices were shown to quantify fluorescent microspheres deposited in the cardiac tissue [7].
An advantage of fluorescence imaging is the non-invasive analysis of biological tissue as a whole without additional physical or chemical destruction. An optical image is a 2D map of some optical parameter value across the tissue surface. The known inverse problem may be formulated as a determination of fluorescent inclusions in the tissue depth from 2D intensity
distribution [8]. The solution of such problems has been shown to lead to a 3D reconstruction of spatial distribution of fluorescent sources from initial 2D data [8–10].
The present paper presents results showing how fluorescence intensity in 2D images of cardiac tissue slices depends on fluorescence centers inside the slice. This task resembles a problem of determination of the position of fluorescent inclusions from the 2D intensity distribution recorded by a CCD camera (the inverse problem) [8]. Most of the inverse problem results were obtained using model calculations. Our goal was to experimentally find a quantitative link between the measured 2D fluorescence image of real biological tissue surface and inside-tissue fluorophore quantity. For this we employed fluorescent microspheres distributed in pig cardiac tissue, which are routinely used for visualization and determination of blood flow in the heart in vivo.
Experimental section
In the present study, FluoSpheres® dark red (645/680) polystyrene fluorescent microspheres (FS) of 15.4 ± 0.2 μm diameter (Invitrogen—Molecular probes; cat. #F8843) were used as recommended for blood flow determination [3]. Emission and excitation spectra of an FS suspension are shown in Fig. 1. Five ml of sonicated FS suspension (1 × 10⁶ microspheres per ml) were injected through the apex into the left ventricle while the aorta was clamped for a few seconds directing all ejected blood and FS to the coronary circulation. The heart was arrested with cardioplegic solution, isolated and cut into slices of 3–6 mm thickness across the heart long axis (from the apex to the base). The Slices were stored in buffered formalin solution35% formaldehyde, 0.40% NaH2PO4, 0.65% Na2HPO4. The slice sides facing the apex or the base are
called apex (A) or base (B) sides, respectively. For fluorescence imaging, a slab of about 3.3 cm2 × 0.9 cm ≈ 30 cm3 was cut from the middle slice parallel to the short axis representing the left ventricular wall. Immediately before imaging the slab was washed in deionized water and blotted with paper tissue. Photographs of this piece are shown in Fig. 3a and c.
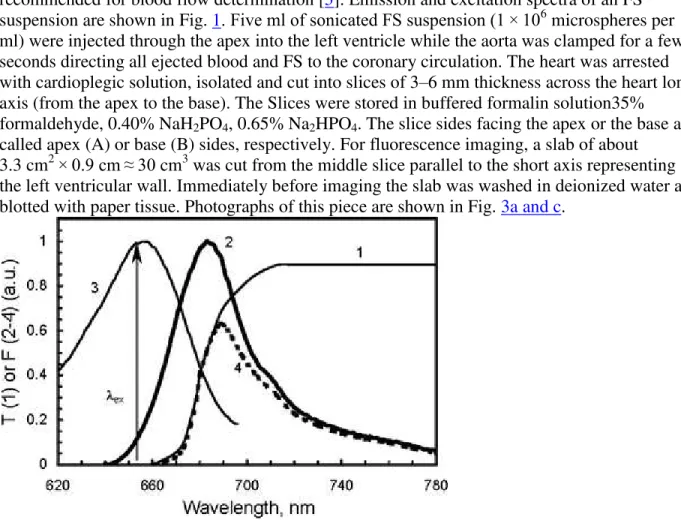
Fig. 1 The spectra of transmittance of the KC-18 glass filter (1), emission (2) and excitation (3) of FluoSpheres® polystyrene 15 μm dark red (645/680) fluorescent microspheres (FS). The product of the emission spectrum and the glass filter transmittance (4) shows the real
wavelength, which was used for the FS fluorescence excitation. The spectra of an FS aqueous suspension were taken from http://probes.invitrogen.com/media/spectra/data/8807h2o.txt and are spectrally non-corrected
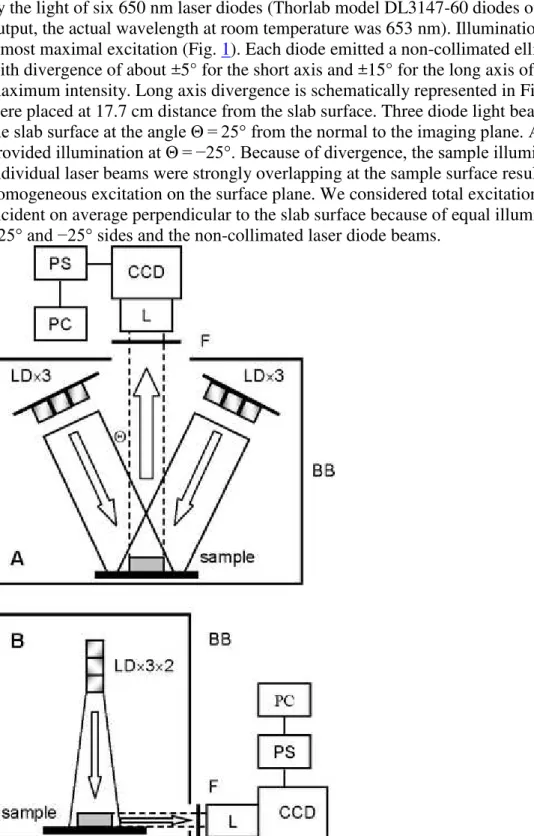
Figure 2 shows schematics of the fluorescence image measurements. Fluorescence was excited by the light of six 650 nm laser diodes (Thorlab model DL3147-60 diodes of 7 mW emission output, the actual wavelength at room temperature was 653 nm). Illumination at 653 nm provides almost maximal excitation (Fig. 1). Each diode emitted a non-collimated elliptical light beam with divergence of about ±5° for the short axis and ±15° for the long axis of an ellipse at half of maximum intensity. Long axis divergence is schematically represented in Fig. 2 B. The diodes were placed at 17.7 cm distance from the slab surface. Three diode light beams were incident on the slab surface at the angle Θ = 25° from the normal to the imaging plane. Another three diodes provided illumination at Θ = −25°. Because of divergence, the sample illuminations by the individual laser beams were strongly overlapping at the sample surface resulting in the
homogeneous excitation on the surface plane. We considered total excitation illumination to be incident on average perpendicular to the slab surface because of equal illumination from the +25° and −25° sides and the non-collimated laser diode beams.
Fig. 2 Schematics of fluorescence imaging measurements. BB, black box; CCD, charge-coupled device camera; F, cutoff glass filter; L, lens; LD, laser diode; PC, computer; PS, power supply and CCD signal amplifier; Θ, angle of the excitation light beam incidence. LD light is incident on the sample. Emission (dashed lines) is collected on the CCD elements by the lens via the cutoff filter. PS amplifies the CCD signal and transfers it to PC for resulting image capture. Setups A and B allowed measuring fluorescence at 180° and 90° to the excitation direction, respectively. The black box BB in setup B is a side view of it in setup A
A red-NIR-sensitive CCD camera consisting of a 512 × 512 back illuminated CCD element and 14/16-bit ST-138 analog-to-digital converter were run in 16-bit mode (Photometrics, Tuscon, Az). The camera measured fluorescence passed via a Nikon Micro AF60 lens (aperture 6–9 mm) and a LOMO (Russia) KC-18 cutoff glass filter (50% transmittance at 680 nm) either from the sample surface (Fig. 2 A) or from its side (90-degree from the excitation beam, Fig. 2 B). Binning (2 × 2) was performed to produce final images with 256 × 256 pixels resolution. The KC-18 glass filter cuts off the excitation light almost completely but transmits more than half of the FS fluorescence (Fig. 1).
For the setup shown in Fig. 2 A emission was collected perpendicularly from either the apex or base sides at the distance from the lens aperture to the sample surface of 45 cm, which provided the focused image capture from an area of 100 × 100 mm, which resulted in area resolution of 0.39 × 0.39 mm = 0.153 mm2
per pixel. When the fluorescence was measured from the side of the slab (Fig. 2 B), the distance from the aperture to the surface of 20 cm provided a focused image with the area resolution of 0.19 × 0.19 mm = 0.038 mm2/pixel.
Results and discussion
Measured fluorescence images
On average, pig heart tissue of 200–210 g occupied about 190–200 ml according to the muscle density of 1.06 g/ml [11]. Therefore the calculated mean concentration of FS in the cardiac tissue in our experiments was 5 × 10⁶/200 = 2.5 × 10⁴
beads/ml, assuming homogeneous distribution across the heart. In reality the distribution is heterogeneous and is determined by variations of blood flow in different parts of the heart as is clearly seen in fluorescence images of both the apex and base sides of the cardiac slab (Fig. 3b; see setup in Fig. 2 A). Below we present evidence that this heterogeneity directly reflects heterogeneity of fluorescent microspheres distribution across the slab.
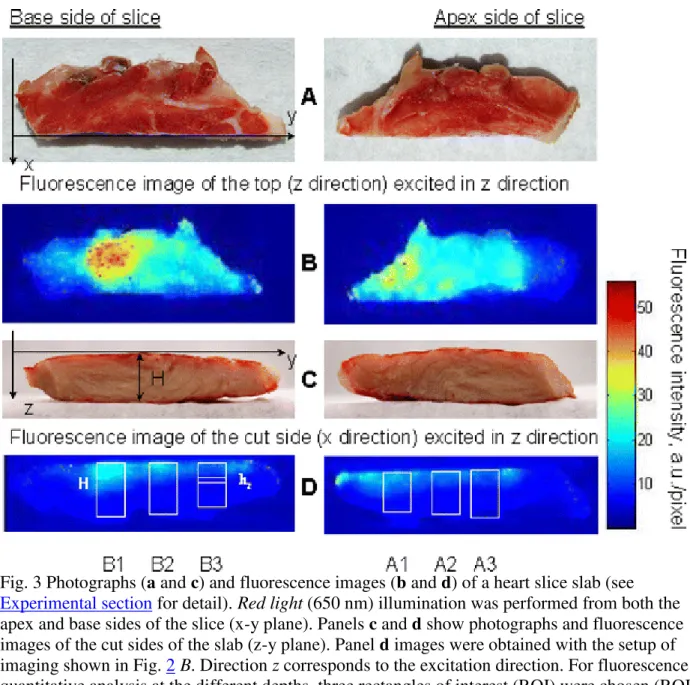
Fig. 3 Photographs (a and c) and fluorescence images (b and d) of a heart slice slab (see
Experimental section for detail). Red light (650 nm) illumination was performed from both the apex and base sides of the slice (x-y plane). Panels c and d show photographs and fluorescence images of the cut sides of the slab (z-y plane). Panel d images were obtained with the setup of imaging shown in Fig. 2 B. Direction z corresponds to the excitation direction. For fluorescence quantitative analysis at the different depths, three rectangles of interest (ROI) were chosen (ROI are A1, A2 and A3 for the excitation of the apex side; ROI are B1, B2 and B3 for the excitation of the base side). Each ROI was divided into eight equal parts, ROI/8, of equal width (width of the ROI). An example of such an ROI/8 part see inside the B3 ROI
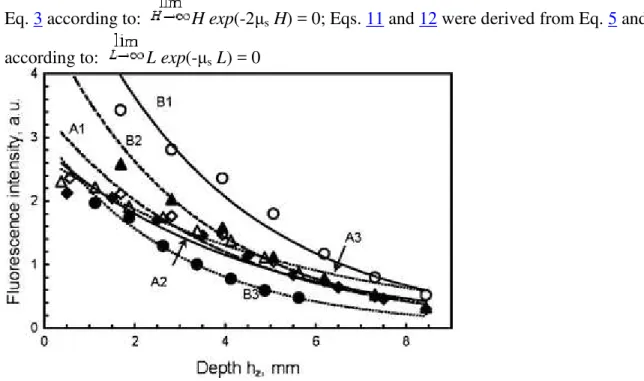
To find the dependence of fluorescence intensity of FS in cardiac tissue across the side cut along z direction (z-y plane, see setup in Fig. 2 B and fluorescence images in Fig. 3c) at various depths of the slab when excited from either B or A side as defined in Fig. 3a, the rectangles of interests (ROI) were chosen to have a height H as shown in Fig. 3d. Each ROI (Table 1) was divided into eight equal parts of H/8 height and parallel to the slab surface (see example of the hz-rectangle in
ROI B3, Fig. 3d). The fluorescence intensities at each pixel in such an eighth ROI (ROI/8) were averaged and assigned to the middle of ROI/8 (hz in Fig. 3d and Table 2). Then, the averaged
(Fig. 4; Table 1). Here, the exponential decrease reflects light scattering-dependent attenuation of the excitation light penetration with the increasing depth.
Table 1 Parameters of the exponential fitting y = Aexp(-αz) the fluorescence decrease (Fig. 4) with depth z of the cardiac slab
ROI H, mm hz, mm A α, mm−1 R H 0.95, mm H 2e, mm A1 9 1.13 3.39 0.260 0.978 5.76 3.85 A2 8 1.00 2.83 0.225 0.983 6.66 4.44 A3 6 0.75 2.68 0.181 0.982 8.28 5.52 B1 9 1.13 6.38 0.282 0.986 5.31 3.55 B2 9 1.13 4.14 0.280 0.987 5.35 3.57 B3 6 0.75 3.03 0.330 0.998 4.54 3.03 Mean ± std 3.7 ± 1.4 0.26 ± 0.02 0.986 ± 0.007 6.0 ± 1.3 4.0 ± 0.9
A, pre-exponential factor, A = E 0ϕμa0x/μs (see text for details); H, height of ROI (see Fig. 3d); hz
= H/8, height of rectangle taken for emission averaging; H 0.95 is the depth at which the tissue
slab may be considered as a semi-infinite turbid medium with an accuracy of 95% (see text and Fig. 5); H 2e is the height of the tissue layer, which provides a critical part of the total
fluorescence; R, correlation coefficient; ROI, rectangle of interest (see Fig. 3d); α, exponential
factor, α ≈ μs, (see text for details)
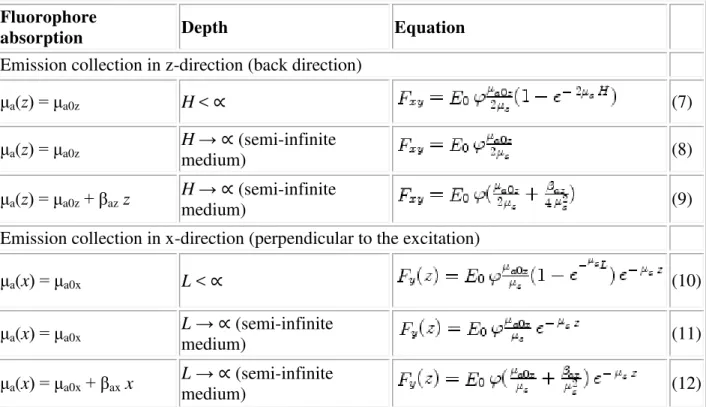
Table 2 Equations for the total fluorescence F emitted from tissue
Fluorophore
absorption Depth Equation
Emission collection in z-direction (back direction)
μa(z) = μa0z H < ∝ (7) μa(z) = μa0z H → ∝ (semi-infinite medium) (8) μa(z) = μa0z+ βaz z H → ∝ (semi-infinite medium) (9)
Emission collection in x-direction (perpendicular to the excitation)
μa(x) = μa0x L < ∝ (10) μa(x) = μa0x L → ∝ (semi-infinite medium) (11) μa(x) = μa0x+ βax x L → ∝ (semi-infinite medium) (12)
F xy is an (x,y)-map of fluorescence intensity emitted in the back direction, i.e. is a fluorescence
Eq. 3 according to: H exp(-2μs H) = 0; Eqs. 11 and 12 were derived from Eq. 5 and 6
according to: L exp(-μs L) = 0
Fig. 4 Dependence of the averaged intensity across the ROI/8 rectangle on the depth hz. Curves
A1, A2, A3, B1, B2 and B3 refer to the ROI in Table 1 and Fig. 3d. See Table 1 and text for definitions
Light attenuation in tissue
Such light attenuation has been predicted for turbid media [12–15]. The incident exciting light E
o attenuates exponentially and is, in general, equal to [15] at
any depth z (see the axis system in Fig. 3). R F is the reflectance of the excitation light from the
surface and depends on the polarization state of the incident light according to Fresnel equations. μt= μa+ μs, where μaand μs are absorption and scattering at the excitation wavelength in cm−1,
respectively. Here, μs means a reduced scattering coefficient which differs from the scattering
coefficient by a factor (1 – g) where g is an anisotropy parameter (for example, see Refs. [5, 17]). For biological tissues, g is in range of 0.7–0.9 [17].
The absorption μa is a product of the extinction coefficient and concentration of fluorophore. It
consists, mostly, of FS absorption because the tissue in formalin did not contain myoglobin and hemoglobin while mitochondrial cytochrome c oxidase heme absorption is negligible at 653 nm according to a diffuse reflectance spectrum (not shown here). μa = 8.6 × 10⁻⁴ cm−1 was calculated
for FS of 17 μg/mg dye/polystyrene, 1.06 g/ml of polystyrene density (Molecular Probes data), 2.5 × 10⁴
beads/ml and estimated extinction coefficient of about 1 cm/mg. This μa value is much
lower than μt found experimentally (Table 1). Therefore, the scattering prevails in the total light
attenuation, μt≈ μs. Although the cardiac tissue has a fibrous structure, macroscopically it is
isotropic. Respectively, we consider μs, is the same in all directions. Because R F = 0.028 when
polarized light penetrates from air to muscle (n = 1.4; [16]) at the 25° angle of incidence (see
Therefore, we consider the excitation light to decay exponentially, . A fluorophore at depth z emits with a quantum yield ϕ in stereo-angle of 4π. The concentration of FS may vary in all directions of the slab (x,y,z). According to the excitation beam and collection of fluorescence setup (Fig. 2), the z-direction was selected for each (x,y) pair, μ+xy(z) for
excitation, μ−xy(z) for emission in the back direction, and μyz(x) for emission in the x-direction.
The absorption part μaof μtis significant (even though μa>> μt) in the (+)z-direction and
(+)x-direction as it determines the fluorescence. For the (–)z-direction, μa is insufficient, and μt≈ μs
(see above). In other words, .
Therefore, the attenuation of the exciting light which travels to depth z is
similar to Ref [17]. Optical isotropy of cardiac tissue allows considering the same μs value in all directions.
Emission in back direction
Emission collection at the fluorescence imaging in the back direction (Fig. 2 A) occurs within a small angle of 0.4º at a lens aperture of 6 mm. For the perpendicular direction (Fig. 2 B) and the same aperture, the emission collection angle was 1.7º. The emission beam leaving the tissue of refractive index of n = 1.4 [16] to the air (n = 1) changes its direction according to Snell’s law and deviates from the normal even more than in tissue. Estimation shows that to be trapped by the CCD camera via the lens, the emission beam should deviate from the normal by less than 0.3º or 1.2º at the distance of 45 or 20 cm, respectively. Therefore, we considered that in both setups shown in Fig. 2, the emission collection was perpendicular to the surface emitted the
fluorescence.
Because of the optical isotropy of the cardiac tissue, is a portion of the total fluorescence emitted from the point (x,y) at the depth z in stereo-angle Ω. In general, the fluorescence intensity is proportional the total absorption (1 – T) where T = 10-μz is the excitation light transmittance of the sample. In our case, this results in the expression:
, where μ+xy= μa(z) (μs is ignored because it does
not determine fluorescence) and ϕ is the quantum yield. As μa dz << 1, the approximation
[1-exp(-μa dz)] ≈ μa dz is correct. Respectively, we have
.
The angle Ω dependence can be skipped when the calibration measurements are performed under the same stereo conditions, or the same setup of image measurements is used for different
samples. The reabsorption of fluorescence by the dye is insignificant because the absorption and emission spectra overlap mostly in the wavelength range where the emission is cut off by the glass filter. Specular reflection and diffused reflectance of the 650 nm excitation light also do not contribute to the CCD camera signal because of the blocking by the cutoff filter.
Taking together the excitation and emission attenuation, the fluorescence intensity dF xy(z)
emitted from depth z at any point (x,y) on the slab surface in the back direction is:
(1) The total fluorescence emitted from the slab in the back direction should be an integral of
intensities emitted from all depths z:
(2)
If absorbance changes linearly with the depth, : and μs is a constant (see
below), then the following relationship holds:
(3)
F xy is an (x,y)-map of fluorescence intensity emitted in the back direction, i.e. is a fluorescence
image of the apex or base side of the slab as shown in Fig. 3b. Table 2 shows Eq. 3 related to various critical cases of depth H and light absorption of FS. Obviously, the heterogeneity of F xy
across the slab surface is determined by the heterogeneity of μa0zand βaz.
Emission perpendicular to the excitation beam
For the x-direction, the fluorescence originated in x cm from the cut side in Fig. 3c and emitted
from the slab in the perpendicular direction (setup in Fig. 2 B) is .
When fluorescence is collected in the perpendicular direction x as shown in Fig. 2 B, the fluorescence intensity originated from the depth x at any point (y,z), is:
(4) Total fluorescence originated from all depths x in the perpendicular direction and emitted from the slab at a certain coordinate y is a function of z:
(5)
where
(6)
The limit L may approach infinity for the semi-infinite slab. However, in practice L may be a distance, at which the slab may be considered as semi-infinite tissue in the x-direction (see Table 2).
Equation 5 describes the exponential reduction in the z-direction shown in Fig. 4. Obviously, the pre-exponential factor A in Table 1 is A = E 0ϕB/μs. The exponential factor α = μs indicates that
The two setups in Fig. 2 imply changes of emission intensity in two directions: x (perpendicular) and z (back). Directions x and y are equivalent as two independent axes on the slab surface. Therefore, all formulae related to the x-direction, are valid for the y-direction with the index or variable x replaced by the index or variable y.
Relationship between total emission and absorbance
From Eqs. 7 and 8 (Table 2), the total fluorescence is proportional to absorbance and, hence, concentration of fluorophore when the absorbance is constant (homogenous distribution of FS) through the slab depth.
When absorbance linearly depends on depth , the total emission is a
function of both absorbance at the surface μa0z, the slope β and the exponential coefficient μs (see
Eq. 9). The slope β may be presented as a function of absorbance at two sides of the slice:
, where μapand μbaare μa0zat apex and base sides, respectively. Let’s
consider β > 0 which means the increase of the absorbance from the apex to the base side μba >
μap. This does not depend on whether the apex or base side is excitation illuminated. At the apex
side illumination, Eq. 9 is valid, and F xy = F ap. With the base side illuminated, Eq. 9 should be
transformed to . A sum F ap + F ba gives, obviously:
(13)
This equation means that the mean absorbance μm of FS across the slab is proportional to the
sum of the normalized total emissions of FS in the slab excited from both sides.
Semi-infinite slab
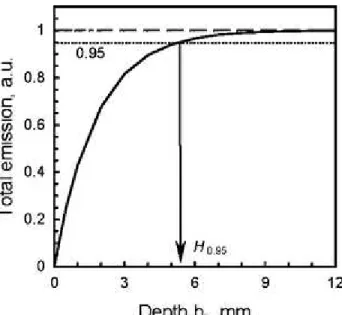
The normalized total emission approaches the unity at H → ∝ (Fig. 5). From the practical point of view, when the depth H has a real value, a reasonable question is what is the depth H, at which the slab might be considered as semi-infinite tissue. The criterion here is the error of the emission intensity measurement. When μa(z) = μa0z is constant, an error p (in %) determines the
equation: exp(-2μs H) = 0.01p. In other words, at the depth , the
tissue slab may be considered as a semi-infinite turbid medium with error of p%. At 5% error, H
0.95 varied from 4.5 to 8.3 mm (Table 1). These values are close to the light path length of
4.6 ± 0.7 mm [18] at 740 nm in rat heart perfused with neodymium chelate, which served as a light-absorbing chromophore. Therefore, the cardiac tissue slab may be considered as a semi-infinite medium when the total depth is less than 8–9 mm if the fluorescent microspheres are distributed homogeneously.
Fig. 5 Total emission in the back direction calculated with Eq. 7 and plotted versus depth hz
defined in Fig. 3d. Parameters in Eq. 7 were taken from Table 1 (ROI is B1) assigning A = E
0ϕμa0z. The emission was normalized to the asymptote value of A/(2 μs0). H 0.95 is the depth at
which the tissue slab may be considered as a semi-infinite turbid medium with accuracy of 95% (see text)
When , H 1-p may be obtained from the equation F/F 0 = 1 – 0.01p where F
is from Eq. 9 and F 0 is from Eq. 8 (Table 2). Although Eq. 8relates to the condition μa(z) = μa0z,
not to the linear distribution, within a thin surface layer in which the emission is maximal, we can assume the FS distribution is homogeneous.
Critical layer
Because F(z) reduces non-linearly with depth hz, the volume of fluorescent tissue, what is the
thickness of a critical tissue layer, which provides the most of the total emission? In Fig. 3d, such a critical layer occupies the upper part of each rectangle. The critical layer thickness H c can be
defined as the distance in z-direction (depth H c) at which the fluorescence intensity is reduced
by 2e-times: H c=2e= 1/μs. For α = μs from Table 1, the critical part of the total emission from
cardiac tissue originates from the layer of 3–5 mm (Table 2).
Both H 1-p and H c values depend on p and c, which are voluntary and may be chosen using the
criteria. Formally, H 1-p and H c differ only by a factor ln(100/p)/2. But, by the meaning, H c
relates to the quantity of total fluorescence emitted from the slab opposite to the direction of the excitation beam while H 1-p shows a limit, at which the slab may be considered as a semi-infinite
turbid medium. Obviously, these two parameters may have the same value H 1-p = H c, if p =
100/e2.
The equations in Table 2 may be used as an approach for a reconstruction of 3D fluorescence intensity distribution inside biological tissue employing experimental 2D images measured from the fluorescent surface.
It should be emphasized that light scattering and absorption properties of biological tissues are wavelength dependent. In our case, the excitation was monochromatic (653 ± 5 nm) while a cutoff filter in the emission collecting part of the instrument transmitted fluorescence of FS in the wide wavelength range related to the full range of the emission spectrum (>660 nm). Both H 1-p
and H c from Table 1 were obtained for emissions averaged over the emission spectrum of FS.
Acknowledgements This work was in part supported by a Manitoba Health Research Council grant. The authors thank Dr. V. Kupriyanov and Dr. J. Rendell, Institute for Biodiagnostics, NRC, Canada, for helpful discussion. Surgical staff of Institute of Biodiagnostics A. Turner, S. Germscheid, L. Gregorash and R. Mariash are greatly acknowledged.
References
1. Marcu L, Grundfest WS, Fishbein MC (2003) Time-resolved laser-induced fluorescence spectroscopy for staging atherosclerotic lesions. In: Mucek MA, Pogue BW (eds) Handbook of biomedical fluorescence. Marcel Dekker, New York, pp 397–430
2. Richards-Kortum R, Drezek R, Sokolov K et al (2003) Survey of endogenous biologicalfluorophores. In: Mucek MA, Pogue BW (eds) Handbook of biomedical fluorescence. Marcel Dekker, New York, pp 237–264
3. van Oosterhout MFM, Willigers HMM, Reneman RS et al (1995) Fluorescent microspheres to measure organ perfusion: validation of simplified sample processing technique. Am J Physiol Heart Circ Physiol 269:H725–H733
4. van Oosterhout MFM, Printzen FW, Sakurada S et al (1998) Fluorescent microsphrers are superior to radioactive microspheres in chronic blood flow measurements. Am J Physiol Heart Circ Physiol 275:H110–H115
5. Khoobehi B, Shoelson B, Zhang YZ et al (1997) Fluorescent microsphere imaging: a particle tracking approach to the hemodynamic assessment of the retina and choroids. Ophtal Surg Laser 28:937–947
6. Decking UKM, Pai VM, Bennett E et al (2004) High-resolution imaging reveals a limit in spatial resolution of blood flow measurements by microspheres. Am J Physiol Heart Circ Physiol 287:H1132–H1140.
organ blood flow in small laboratory animals. Am J Physiol Heart Circ Physiol 279:H2043– H2052
8. Chernomordik V, Hattery D, Gannot I et al (1999) Inverse method 3-D reconstruction of localized in vivo fluorescence—application to Sjogren syndrom. IEEE J Sele Top Quant Electron 5:930–935.
9. Paithankar DY, Chen AU, Pogue BW et al (1997) Imaging of fluorescent yield and life time reemitted from random media. Appl Opt 36:2260–2272.
10. Chang J, Graber HL, Barbour RL (1997) Imaging of fluorescence in highly scattering media. IEEE Trans Biomed Eng 44:810–822.
11. Mendez J (1960) Density and composition of mammalian muscle. Metabolism 9:1845–188
12. Farrell TF, Patterson MS (2003) Diffusion modeling of fluorescence in tissue. In: Mycek MA, Pogue BW (eds) Handbook of biomedical fluorescence. Marcell Dekker, New York, pp 29–60
13. Frangioni JV (2003) In vivo near-infrared fluorescence imaging. Curr Opin Chem Biol 7:626–634.
14. Sevic-Muraca EM, Houston JP, Gurfinkel M (2002) Fluorescence-enhanced, near infrared diagnostic imaging with contrast agents. Curr Opin Chem Biol 6:642–650.
15. Turchin VV (2007) Tissue optics: light scattering methods and instrumentation for medical diagnostics. SPIE, Bellingham
16. Bolin FP, Preuss LE, Taylor RC, Ference RJ (1989) Refractive index of some mammalian tissues using a fiber optic cladding method. Appl Opt 28:2297–2303.
17. Dunsby C, French PMW (2003) Techniques for depth-resolved imaging through turbid media including coherence-gated imaging. J Phys D Appl Phys 36:R207–R227.
18. Nighswander-Rempel SP, Kupriyanov V, Shaw RA (2005) Assessment of optical path length in tissue using neodymium and water absorption for application to near-infrared
spectroscopy. J Biomed Opt 10:024023.