Publisher’s version / Version de l'éditeur:
Proceedings of the 20th International Conference on Port and Ocean Engineering under Arctic Conditions, 2009-01-01
READ THESE TERMS AND CONDITIONS CAREFULLY BEFORE USING THIS WEBSITE. https://nrc-publications.canada.ca/eng/copyright
Vous avez des questions? Nous pouvons vous aider. Pour communiquer directement avec un auteur, consultez la première page de la revue dans laquelle son article a été publié afin de trouver ses coordonnées. Si vous n’arrivez pas à les repérer, communiquez avec nous à [email protected].
Questions? Contact the NRC Publications Archive team at
[email protected]. If you wish to email the authors directly, please see the first page of the publication for their contact information.
NRC Publications Archive
Archives des publications du CNRC
This publication could be one of several versions: author’s original, accepted manuscript or the publisher’s version. / La version de cette publication peut être l’une des suivantes : la version prépublication de l’auteur, la version acceptée du manuscrit ou la version de l’éditeur.
Access and use of this website and the material on it are subject to the Terms and Conditions set forth at
Development of a marine icing monitoring system
Gagnon, R.; Sullivan, M.; Pearson, W.; Bruce, W.; Cluett, D.; Gibling, L.; Li, L. F.
https://publications-cnrc.canada.ca/fra/droits
L’accès à ce site Web et l’utilisation de son contenu sont assujettis aux conditions présentées dans le site LISEZ CES CONDITIONS ATTENTIVEMENT AVANT D’UTILISER CE SITE WEB.
NRC Publications Record / Notice d'Archives des publications de CNRC: https://nrc-publications.canada.ca/eng/view/object/?id=3f0100ac-afbb-48ca-a9e4-2210a5aca6c2 https://publications-cnrc.canada.ca/fra/voir/objet/?id=3f0100ac-afbb-48ca-a9e4-2210a5aca6c2
National Research Council Canada Institute for Ocean Technology Conseil national de recherches Canada Institut des technologies oc ´eaniques
IR-2009-11
Institute Report
Development of a marine icing monitoring system
Gagnon, R.; Sullivan, M.; Pearson, W.; et el.
Gagnon, R.; Sullivan, M.; Pearson, W.; Bruce, W.; Cluett, D.; Gibling, L.; Li, L., 2009. Development of a marine icing monitoring system. 20th International Conference on Port and Ocean Engineering under Arctic Conditions, 9-12 June 2009, Luleå, Sweden POAC09-87 : 9 p.
POAC09-87
Development of a Marine Icing Monitoring System
R. Gagnon 1, M. Sullivan 1, W. Pearson1, W. Bruce2, D. Cluett2, L. Gibling 2 and L.F. Li2
1
Institute for Ocean Technology, National Research Council of Canada St. John's, NL, Canada
2
Faculty ofEngineering and Applied Science, Memorial University of Newfoundland St. John's, NL, Canada
ABSTRACT
A Marine Icing Monitoring System (MIMS) has been developed and deployed on a Marine Atlantic ferry and two offshore supply vessels. The MIMS is a visual based technology for monitoring marine icing accumulation on offshore rigs and vessels where icing poses operational and safety hazards. The system consists of a CPU connected to two high-resolution digital cameras that are positioned to view expansive areas, or smaller areas depending on requirements, where icing could occur when environmental conditions are within certain parameters. The system is stand-alone, requiring no maintenance and needing only a standard 110 VAC power source. All components of the system are weatherproofed so that installation can be anywhere on the deck or superstructure of a facility. The computer controls each camera so that pictures are taken at regular intervals (every 12 minutes) and stored on the computer’s large-capacity hard drive. Data are retrieved from the hard drive at the end of the icing season each year. The system has a satellite phone so that it can be checked and controlled from IOT. Thumbnail images can be quickly downloaded to monitor current conditions at the site, and the cameras can be controlled to zoom in or out. Visual data from the system’s deployments are presented along with some discussion of image analysis strategies, including real-time assessment of icing accumulation. Past and on-going development hurdles are also discussed.
INTRODUCTION
Marine icing is a serious hazard for vessels and offshore structures operating in the cold environments off the east coast of Canada and in the Canadian Arctic. Icing that results from the freezing of spray generated by wave collisions with the bow of a vessel, or components of a fixed or floating structure, can lead to instability in the case of large accumulations. Even in the case of relatively small accumulations safety and communications equipment is compromised and the level of production may be reduced as outside mobility of crew and equipment is impaired. Computer models that can forecast the onset and severity of marine icing events would be one avenue to help mitigate the problem by aiding avoidance and operational strategies that lessen the effects. Another approach is the use of physical monitoring systems to aid crews in real-time assessment of hazard. While single point monitoring devices are useful it is desirable to have more expansive information about icing since vessels and offshore structures are large and
POAC 09
Luleå, Sweden
Proceedings of the 20th International Conference on Port and Ocean Engineering under Arctic Conditions June 9-12, 2009 Luleå, Sweden
complex shaped objects. In the case of computer modelling and forecasting there is a need to have good quality data from actual icing events to validate the models. The present optically-based system addresses these needs by providing a means to acquire high-quality field data of marine icing events, that is, reasonably accurate time series records covering expansive areas. Furthermore the system has potential for use as a real-time warning system to aid crews.
MIMS Description
The Marine Icing Monitoring System (MIMS) is a visual-based technique for monitoring marine ice accumulation on offshore rigs and vessels where icing poses operational and safety hazards (Figure 1). The system consists of a CPU connected to two high-resolution digital cameras that are positioned to view expansive areas, or smaller areas depending on requirements, where icing could occur when environmental conditions are within certain parameters. The system is modular, so multiple units could be used to cover more sites on the rig/vessel. The system is completely stand-alone, requiring no maintenance and needing only a standard 110 VAC power source, and it draws about 300 Watts. All components of the system are weatherproofed so that installation can be anywhere on the deck or superstructure of a facility. When turned on, the computer controls each camera and causes the cameras to take pictures at regular intervals (e.g. every 12 minutes) that are downloaded immediately to the computer’s hard drive. Data are retrieved from the hard drive at the end of the icing season. The system has a satellite phone so that it can be controlled from IOT. Thumbnail images can be quickly downloaded to monitor current conditions at the site, and the cameras can be controlled to zoom in or out. Full size images may also be downloaded, however, several minutes are required to download an image, whereas thumbnail images can be retrieved in a matter of a few seconds.
The Marine Icing Monitoring System (MIMS) has been deployed on the Marine Atlantic Ferry Caribou (October 2003), then on an offshore supply vessel Atlantic Kingfisher (October 2005) (Figure 2), and its last deployment was on the supply vessel Atlantic Eagle (November 2007). These deployments of MIMS served two purposes. One was primarily intended as a ground-proofing and equipment development exercise for the system during actual winter seasons. The second was the collection of actual icing data that could be useful to researchers. The vessels served as convenient venues since equipment maintenance and data retrieval were relatively easy tasks to conduct at either of the Caribou’s two ports, Port-aux-Basques NL and North Sydney NS, and in St. John’s NL harbour for the two supply vessel deployments. All three vessels experience icing events from time to time, more so for the two supply vessels that are smaller than the Caribou Ferry and have decks closer to the water that are more susceptible to spray.
In its present configuration MIMS has two digital photo cameras and they were mounted on the port and starboard railings on the top deck above the bridge of the ships. Each camera viewed the foredeck of the vessel and a portion of the ocean ahead and beside the vessel to record sea state. The basic system was purchased from Erdman Video. Modifications and extensive ruggedization of the equipment were carried out at IOT prior to all three deployments.
The Globalstar satellite phone system is presently used for the MIMS since it provides faster data rates and a more reliable connection than the Iridium system originally used. However, connections with Globalstar have degraded over the past several months due to satellite problems and an alternative may be sought.
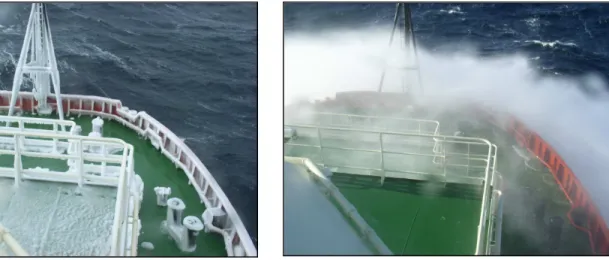
While icing images (Figure 3) are the main focus, occasionally wave impacts on the hull that produce spray are recorded and these are also useful for understanding the dynamics of the spray generation aspect of the marine icing process (Figure 4).
Data analysis method
At the end of a winter season the visual data are collected from the MIMS. The first type of analysis is to simply catalogue the data in terms of the occurrence and duration of icing events, significant spraying events, presence of wet and freezing snow, and equipment-related events such as icing up of windows. Of the icing events that were recorded to date, one was chosen to
16" 18" 8" 22.5" 7.5" 8"
26 lbs weight including camera
Total system weight, including cables, is approximately 132 lb
Aluminum or stainless steel camera housing
Marine Icing Monitoring System
Camera housing and mount
Total system power is approximately 250 Watts
CPU box 12" 14" 8" 110 VAC in 24 VAC out 20 lbs weight Transformer box 20 lbs weight 200 ft cable, 20 lb weight
Sat phone antenna
develop strategies for manual and automated analysis. This event occurred on Dec. 29, 2006 and began in the morning and progressed through ~ 8 hours so that images were acquired in daylight. Most images were of good quality and some were somewhat degraded by spray or poor contrast between the icing accumulations and the background. The latter images would serve as a test of the robustness of the automated image analysis methods.
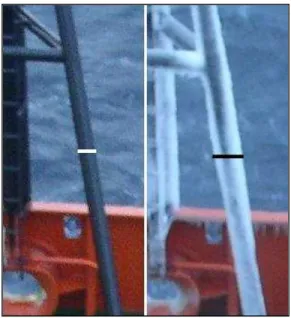
The manual analysis of images was fairly straightforward. A specific location on some structural component such as a rail or pole was chosen and the change in width of the ice-covered structure as ice accumulated was measured in pixels using basic image analysis software (Figure 5). The pixel data were then converted to actual width measurements using the known
dimensions of the structures as determined in ice-free conditions at dockside. The first sets of manual-type measurements looked reasonable and clearly showed the growth of icing at various locations during the event. Getting measurements for a large number of locations on the vessel’s structures would be rather tedious and time consuming, however, so an automated system of analysis would be much more desirable. With an automated system many locations could be interrogated in a systematic and fast way, while avoiding person-to-person bias that naturally arises when manual analysis techniques are applied to visual data. The following strategy was
Figure 2. MIMS installation on the Atlantic Kingfisher at dockside in St. John’s harbour. All components are attached to the railing on the top deck of the vessel. One of the camera housings is visible at the right and the power supply box and CPU box are visible at the center and left. The satellite phone antenna is visible at the far left.
Figure 4. Spray event on the deck of the Atlantic Kingfisher arising from a bow-wave impact event.
Figure 3. Marine icing accumulation on the deck and rail structures of the Atlantic Kingfisher.
therefore applied.
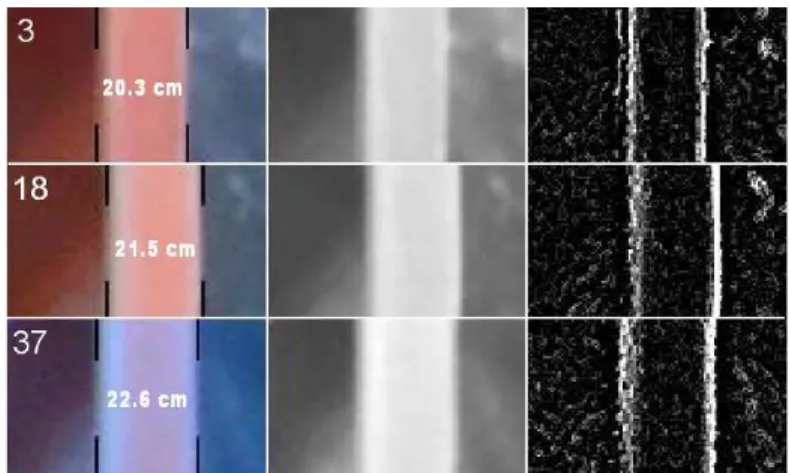
Seventeen locations were chosen for measurement on poles on the foreword mast, side rails and round deck structures (Figure 6). For each location a box was defined (60 x 60 pixels for the pole structure and 100 x 60 pixels for the rail structure). The image was rotated so that the linear features of the structure were vertical, to enhance edge-detection later. The rest of the image was cropped out and the analysis conducted on the box. Each box was converted to grey scale and then an edge detection routine was applied (Figures 7 and 8). Some filtering was also applied to enhance contrast and reduce noise at the grey scale and edge-detection phases. Then a routine was applied to the edge-detected image so that the edge locations at the right and left, corresponding to the edges of the icing accumulation, could be determined. The standard way this was done was by taking each of the vertical columns of pixels spanning the width of the image and summing the intensity values of all 60 pixels in each column. This would yield high numbers for columns that had many bright pixels in them and low numbers for dark columns. The icing edges on the right and left were found by finding the first column of pixels
that had distinctly high values (i.e. by at least a prescribed amount from the preceding columns) starting from the left side of the image and moving right, and then starting at the right side of the image and moving left. Each box was previously scaled using actual dimensions of the structures in the boxes. The width of the icing layer plus structure dimension (in pixels) was then converted to actual dimensions and the structure width subtracted to give the sum of the icing thickness on both sides. Dividing this by 2 would yield the average thickness of icing at that location on the structure.
The plotted thickness data from the automated analysis of the images
Figure 5. Example of an icing measurement obtained manually. The left image shows a structural component’s horizontal width at the measurement location (white line) and the right image shows the width including the ice layer during an icing event (black line).
Figure 6. Locations on the deck structures and rails of the Atlantic Kingfisher where automated icing thickness measurements were made.
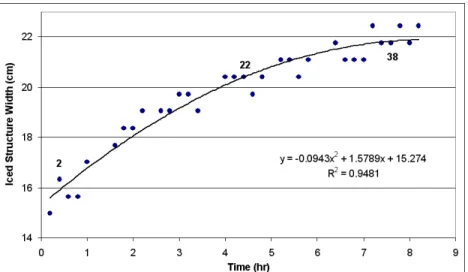
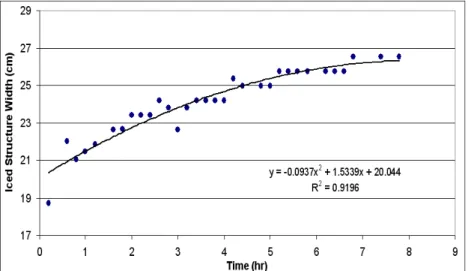
acquired during the icing event are shown for position 3 on a pole structure (Figure 9) and position 17 on the rail structure (Figure 10). In cases where it was obvious that the automated analysis was having trouble getting a measurement for a particular image, that is, where it could not find the right or left edge of the ice due to image quality problems, then that data point was not included in the plot. That is why Figure 9 shows a few more data points than Figure 10. The present analysis technique is not well-suited to the round structures (Figure 6) and produces only marginal results that consequently are not included here. The algorithm for the analysis of these structures will necessarily be different than that of the linear structures. The required analysis strategy will involve elliptical fits to the ice-covered tops of the round structures and this has not been implemented in the computer program code yet.
Figures 9 and 10 show fairly uniform increases in icing thickness for the duration of the icing event. The trend in Figure 9 shows a definite decreasing slope, and the mild decreasing slope in Figure 10 may be real. The ship’s log indicates that the air temperature (~ -3oC), wind speed (Beaufort 8) and direction (West) were fairly constant throughout the icing event (Gibling,
2007) and the ship maintained a near constant heading directly into the wind. This corroborates with the uniform trends in accumulation over time, that is, no sudden increases or decreases in growth rate. The decreasing rate of change of ice thickness in Figure 9 may be the result of the pole being a spray target that will accumulate icing more readily on its front portion that directly faces the bow spray. Its profile elongates in the spray-facing direction causing the side areas to ‘stretch’ in that direction while the amount of spray available at the sides has not changed, i.e. the growth rate decreases at the sides. We also note that the thickness of the icing
Figure 7. Composite images stacked vertically of position 3 on the pole structure at three times (image numbers at upper right in left boxes) in the icing event sequence. In each case the original image is in the box at the left, the grey scale enhanced version is at the center and the edge-detected image is at the right. Black vertical lines overlaying the original images indicate the calculated positions of the edges of the icing layers.
Figure 8. Composite images stacked vertically of position 17 on the rail structure at three times (image numbers at upper left in left boxes) in the icing event sequence. The rest of the figure layout follows the same format as in Figure 7.
is greater on the pole structure than the rail structure and that this is most likely due to the more forward position of the pole than the rail position, hence the pole gets more spray. Stronger evidence of this effect is seen if we look at the data for position 16 on the rail (Figure 11), which is more forward than position 17 and has the same structural shape and elevation. We can see from the graph that the icing accumulation is significantly greater than that at position 17 in Figure 10, as anticipated.
While the technique has not been ground-proofed with actual measurements of the icing thickness acquired on board the vessel during the events, it is reasonable to say the results, at least relatively speaking, are good since the scatter in the plots is not great. Indeed the scatter in the data is on the scale of the pixel size in the images. Furthermore it is reasonable to say that while the absolute values of all individual measurements could possibly suffer from some systematic error, the net change in width of structure and icing layer
from the beginning to the end of the event, that is from the bottom to the top of the fitted line on the plots, will be a good estimate for the actual icing accumulation over that time. Similarly, if the analysis yields reasonably accurate values for the widths of the structures when no ice is present than similar accuracy may be expected when ice begins to accumulate. When the lines fitted to the data in the graphs are extrapolated back a few images to the first indication of icing then a width value is obtained that is within 5% of the actual structural width. Field
Figure 9. Pole structure width, including icing layer, versus time at position 3. Image numbers, corresponding to the images in Figure 7, are placed directly above or below the data points associated with those images.
Figure 10. Rail structure width, including icing layer, versus time at position 17. Image numbers, corresponding to the images in Figure 8, are placed directly above or below the data points associated with those images.
measurements acquired with physical measurement devices such as large callipers oriented to take into account the camera view will be needed to ultimately validate the system’s accuracy.
We note that the graphs showing icing accumulation exhibit a pixilation effect. The thickness measurements tend to populate at discrete values, that is, the standard analysis routine finds a sufficiently bright column of pixels in the image box to consider it the edge of the icing for a few images until eventually a subsequent image causes the routine to decide that the next column of pixels has become sufficiently bright to consider it the new icing edge. This is an artefact of the resolution of the camera and the field of view. The best solution is to
use cameras with greater resolution or to increase local resolution by using the camera’s zoom capability. An alternate technique we used to reduce the effect was to divide the columns of pixels described above in the standard analysis method into several smaller columns, instead of just one column of 60 pixels. Whereas before the standard routine looked for the first full-box-height column of pixels that met the brightness criteria to consider it the ice edge, now the analysis looked for several smaller columns that each define the ice edge and that generally exhibit some variation in position. The average horizontal position of these small bright columns was taken as the ice edge, thereby achieving a sub-pixel measurement. Another method we used was to artificially increase the ‘resolution’ of the images by applying a resizing algorithm to the image to increase its size (i.e. more pixels) before the analysis was performed. While these techniques, utilized separately or combined, helped to somewhat reduce the pixilation effect the scatter in the data tended to increase as a side effect, so the benefit was questionable. However, a real and unexpected benefit arising from these modified techniques was that some images that the standard method failed to analyze, because it could not find one or both icing edges, now could be analyzed to yield the ice edge locations. So in cases where the standard method fails for several images then the other techniques can be applied to fill in the gaps for some of the images at least. That was the case with the images for position 16 on the rail structure (Figure 11) where several data points determined utilizing the alternate methods were combined with the data that came from the standard analysis method.
The computer program used for the automated image analysis was written in Python (2005), which is freely available on the Internet.
Figure 11. Rail structure width, including icing layer, versus time at position 16. Note that several data points included in the chart were generated using the alternate methods of image analysis.
Conclusions
A MIMS device has been assembled and deployed on three vessels to record icing events over expansive areas on the foredeck. Strategies for automated analysis of the images to yield icing accumulation over time for a variety of locations on the ships’ fore structures have been developed and shown to be almost as good as manual analysis by humans, but with potential to be much faster. A pixilation effect was noted in the data and techniques were used to smooth out the effect. A bi-product was that the techniques also helped increase the data yield from the set of images that was analysed from one vessel. Most images yielded good results. The only cases that were problematic occurred when the background behind the structure being analyzed or the foreground in front of the structure interfered with the analysis. For example light regions behind the structure, such as white caps or foam on the water, would prove challenging for the system, as would rain, snow or spray in front of the structure or on the camera window.
These results are the first detailed time series measurements of icing events recorded in the field for expansive areas on a vessel. Meteorological data from the ship’s log and ship heading data can be used for correlating icing data with ambient conditions. The potential for this technology is significant.
Three issues were identified during the deployments for future development. The first was that the internal heaters of the camera housings and peripheral ones on the windows were not adequate to prevent icing on the windows that obscured the view is several instances. Heated glass windows (BeclawatTM) will be installed in the summer of 2009. Secondly, there is inadequate lighting on the vessel at most times during the night, however we are attempting to get icing information from long camera exposures for these cases. Finally we note that the cameras have a limited lifetime of about 3-4 years in the manner they are used in the system. Hence, we will replace them routinely after no more than 3 years usage since they are relatively inexpensive and the resolution capabilities improve as newer models appear on the market.
Acknowledgements
The authors would like to thank the Program of Energy Research and Development (PERD) and IOT for their financial support of this research. Special thanks is given to Marine Atlantic as the owners and operators of the Caribou Ferry and to Petro-Canada for providing access to the two offshore supply vessels, Atlantic Kingfisher and Atlantic Eagle. We are also very grateful to the captains and crews of all three vessels who were very accommodating and helpful.
REFERENCES
Farr, J., 2004. Marine Icing Modifications (Phase 2). Laboratory Memorandum. Institute for Ocean Technology, National Research Council of Canada.
Gibling, L., 2007. Marine Icing Events: an Analysis of Images Collected from the Marine Icing Monitoring system (MIMS). Institute for Ocean Technology. SR-2007-07.
Python Imaging Library, 2005. Handbook reference.