Publisher’s version / Version de l'éditeur:
Leukos, 3, October 2, pp. 105-120, 2006-10-01
READ THESE TERMS AND CONDITIONS CAREFULLY BEFORE USING THIS WEBSITE.
https://nrc-publications.canada.ca/eng/copyright
Vous avez des questions? Nous pouvons vous aider. Pour communiquer directement avec un auteur, consultez la
première page de la revue dans laquelle son article a été publié afin de trouver ses coordonnées. Si vous n’arrivez pas à les repérer, communiquez avec nous à [email protected].
Questions? Contact the NRC Publications Archive team at
[email protected]. If you wish to email the authors directly, please see the first page of the publication for their contact information.
Archives des publications du CNRC
This publication could be one of several versions: author’s original, accepted manuscript or the publisher’s version. / La version de cette publication peut être l’une des suivantes : la version prépublication de l’auteur, la version acceptée du manuscrit ou la version de l’éditeur.
Access and use of this website and the material on it are subject to the Terms and Conditions set forth at
The Potential for demand responsive lighting in non-daylit offices
Newsham, G. R.; Mancini, S.
https://publications-cnrc.canada.ca/fra/droits
L’accès à ce site Web et l’utilisation de son contenu sont assujettis aux conditions présentées dans le site LISEZ CES CONDITIONS ATTENTIVEMENT AVANT D’UTILISER CE SITE WEB.
NRC Publications Record / Notice d'Archives des publications de CNRC:
https://nrc-publications.canada.ca/eng/view/object/?id=9f24d254-fa61-4a18-925e-b9bd545c32fc https://publications-cnrc.canada.ca/fra/voir/objet/?id=9f24d254-fa61-4a18-925e-b9bd545c32fc
T he Pot e nt ia l for de m a nd-re sponsive
light ing in non-da ylit offic e s
N R C C - 4 8 6 7 8
N e w s h a m , G . R . ; M a n c i n i , S .
A v e r s i o n o f t h i s d o c u m e n t i s p u b l i s h e d i n
/ U n e v e r s i o n d e c e d o c u m e n t s e t r o u v e
d a n s : L e u k o s , v . 3 , n o . 2 , O c t . 2 0 0 6 , p p .
1 0 5 - 1 2 0
The Potential for Demand-Responsive Lighting in Non-daylit
Offices
Guy R. Newsham and Sandra Mancini Institute for Research in Construction National Research Council Canada
Abstract – Participants (N=30) in an office laboratory had personal dimming control over lighting, and were then exposed to a simulated demand response (or “load shed”) involving dimming lighting by 2% per minute. Participants were given no expectation that the dimming would occur, and the principal measure used was the point at which participants intervened to restore light levels after the demand-response dimming began. Results showed that 20% of participants intervened by the time that desktop illuminance declined ~35% from their initial preferred level, and 50% of participants intervened by the time that desktop illuminance declined ~50%. Therefore, during a power supply emergency, dimming lights can contribute relatively large electricity demand reductions before lighting declines to a level where a substantial fraction of people would be motivated to seek a change.
Keywords – Demand Response, Load Shedding, Personal Control, Preferred Illuminance, Energy Management
1. INTRODUCTION
1.1 LOAD SHEDDING AND DEMAND-RESPONSIVE BUILDINGS
Buildings use a large amount of energy to create comfortable conditions. For example, in Canada space and water heating, cooling, ventilating, and lighting in buildings accounted for at least 28% of total energy use in 20031 [NRCan, 2005]. Of the secondary energy used by these buildings, 39% was delivered in the form of electricity. Demand for electricity in buildings in not constant, rather it varies according to daily and seasonal cycles. Peak demand tends to occur on hot summer afternoons, when demand for cooling in residential and commercial buildings is at its highest, which is added to (currently) relatively constant commercial loads, such as power for office equipment and lighting. Electrical utilities must have access to enough generating capacity to meet this peak demand, even though this capacity is not required for most hours of the year. This challenge is generally met on the supply side, in other words, the utility will start generators for peak time use only, or import power from other jurisdictions. These peak generators are often fossil-fuel powered, because of their start-stop flexibility, and thus introduce a greenhouse gas (GHG) burden. Further, the spot
1
This figure does not include the fraction of industrial energy that is used to condition industrial buildings rather than for industrial processes.
price for power imports during periods of peak demand may be very high. Even given these options, there is concern in some jurisdictions that the electrical utilities may not be able to access enough additional supply to meet peak demand, in such cases blackouts will occur.
As a result of this concern, there is growing interest in addressing this issue, at least partially, on the demand side [Piette et al., 2005; DRCC, 2006; Rowlands, 2005], in other words, reducing the peak demand for electricity at critical times by eliminating electricity use (“load shedding”), or shifting it to non-peak times. In principle, this is relatively straightforward to do, all one needs is control
equipment that can respond to some kind of prompt from the utility. In commercial buildings, this can be accommodated within a modern energy
management and control system (EMCS)2. On the thermal side, one strategy is pre-cooling, in which the building is over-cooled in the morning and the building thermal mass carries some of this “coolth” to the afternoon to delay the need for cooling during the hottest part of the day. Another strategy is simply to raise the thermostat setpoint [Piette et al., 2005]. Lighting, which constitutes 30-45% of electricity demand in commercial buildings [IEA, 2006] can also participate in such load shedding, by switching, or dimming.
However, these strategies create the potential for conditions to deviate from recommended temperature and lighting standards [e.g. ASHRAE 2004; IESNA 2000]. This may result in an indoor environment that is uncomfortable or
unacceptable to occupants, and might impair their performance. It would certainly be preferable if demand response strategies did not disrupt building occupants. Switching lighting will obviously be noticed by occupants, and may cause dissatisfaction [Boyce, 1984]. However, smooth changes in lighting characteristic of dimming systems may be much more acceptable. In this paper we examine the literature with respect to smooth temporal changes in light level, and present new data to guide practitioners on the magnitude of lighting load sheds that may be applied.
1.2 DETECTION OF TEMPORAL CHANGES IN LIGHT LEVEL
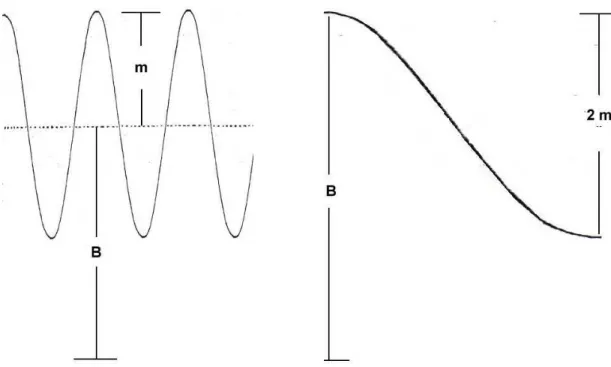
Detection of temporal changes at relatively high frequencies has featured in vision research for several decades. For example, in Kelly [1961] participants looked through an artificial pupil into a wide, almost uniform light field. The
luminance was varied sinusoidally above and below a base adaptation luminance (B), at various amplitudes (m), see Fig. 1. The experiment derived the threshold amplitude for detection, at various frequencies of the sine wave. Work of this type has generally been conducted at frequencies of 1 Hz and above [Watson, 1986], because the primary practical goal was detection of the critical fusion frequency (CFF), the frequency at which a “flickering” source, such as a
fluorescent lamp, would be perceived as a constant source (typically > 50 Hz, at common interior luminances). However, 1 Hz is still rapid compared to the changes that might occur in demand response. Kelly’s data show a tendency
towards frequency insensitivity below 1.6 Hz, with m ≈ 0.06-0.08, but it is not certain that a true plateau has been reached.
Akashi and Neches [2005] suggested that one could extrapolate Kelly’s data to predict the level of change that would go undetected by an average viewer when lighting is smoothly dimmed at rates more characteristic of demand response. Although not explicitly stated, they seemed to propose that such a unidirectional change could be considered as a half-cycle of a sine wave with a very low frequency, as shown in Fig. 1. However, because the variation is not cyclic around a mean luminance, the limit of detection could be considered as the “peak-to-peak” difference, equivalent to 2m from the base luminance (B), or about a 15% reduction in light level.
Fig. 1. Interpretation of detection of sinusoidal changes in light level. Nevertheless, real viewing conditions in a building undergoing
demand-responsive dimming will be somewhat removed from Kelly’s very artificial set-up. For example, the luminance field will not be uniform in a real setting, and the occupant may be less sensitive to changes in light level when occupied with a task. Several studies have explored sensitivity to temporal changes in light level under conditions more characteristic of demand response. For example,
Kryszczuk and Boyce [2002] asked participants (N=16) to fixate on a black cross-hair target against a white background, placed on a horizontal table in a
windowless office. The illuminance level on the target was reduced over periods of 3.33 to 120 seconds from 1090 lx or 475 lx, until participants indicated that they detected a change by pressing a button. In some trials participants simultaneously performed a mental distraction task (verbal subtraction calculations). The results showed that 50% of participants detected a 15%
change in light level with a starting value of 475 lx, and a 20% change with a starting value of 1090 lx. This conforms with the expected reduction in absolute sensitivity at higher adaptation levels [Watson, 1986]. Neither the rate of change of light level, nor the mental distraction, had an effect.
Akashi & Neches [2004] conducted a similar study in a small windowless office laboratory. Initial desktop illuminance was 500 lx, and illuminance was
decreased to either 451 lx, 408 lx, 368 lx, 332 lx, or 300 lx over 10 seconds; no-change trials were also included. Four different dimming curves were used: linear, or curves that decreased faster initially before flattening out. Participants (N=20) had two task conditions: no task with a free gaze around the room, or paper-based word puzzles on a horizontal desk. At the completion of each 10-second exposure participants were asked to indicate if they had perceived a change in illuminance. The results showed that 50% of participants detected a 15% change in light level. Neither the dimming curve, nor the mental distraction, had a significant effect. In cases where a change was detected, participants were asked if the change was acceptable. The results showed that 50% of participants found a reduction in light level of 40% to be acceptable, and that 80% of participants found a reduction in light level of 20-30% to be acceptable Akashi & Neches [2005] followed up with additional studies in the same
experimental space. In one study, initial desktop illuminance was 500 lx and illuminance was decreased to either 420, 340, 260, 180, 100 or 20 lx over 10 seconds; no-change trials were also included. Participants (N=20) conducted word puzzles on paper or computer screen at two font sizes (6- or 12-point font). At the completion of each 10-second exposure participants were asked to
indicate if they had perceived a change in illuminance. A second study followed the same basic procedure, except that initial desktop illuminance was 300 lx and illuminance was decreased to either 253, 206, 159, 112, 65 or 18 lx. Participants (N=26) conducted the same word puzzle tasks, but font size was not a variable. The results from both studies showed that 50% of participants detected a 15-25% change in light level. Neither the initial illuminance, nor the task font size, had an effect. However, participants were less sensitive to changes in light level when performing the VDT task, which the authors attributed to the relatively small effect of ambient lighting on the task luminance of a self-luminous computer screen. In cases where a change was detected, participants were asked if the change was acceptable. The results showed that 50% of participants found a reduction in light level of 55-80% to be acceptable, and that 80% of participants found a reduction in light level of 30-50% to be acceptable.
Shikakura et al. [2003], exposed participants in a windowless office laboratory to smooth lighting reductions from an initial desktop illuminance of 750 lx. The largest reduction presented was ~25%, and the reduction was carried out over periods of up to 16 seconds. In the initial experiment, participants (N=10) had no task to do during the lighting change, but in a second experiment participants conducted a paper-based task and an interview (N=14), and a computer-based
task (N=9). With no task, 50% of participants detected an 8% change in light level, and there was no effect of dimming rate. Conducting a task reduced the sensitivity to changing light levels: 50% of participants detected a 20% change in light level when the change took 8 seconds.
Tenner et al. [1997] studied participants (N=10) engaged in their own work for two 8-hour days in an experimental office. They used a variety of lighting
conditions, but of most relevance to this paper was the condition in which window blinds were completely closed excluding almost all daylight, and the maximum electric light level was 830 lx on the desktop. Participants set their initial
preferred light level. Fifteen minutes after the initial level was set, the light began to dim by 8% every 3 minutes; the lighting switched off if 20% of the maximum level was reached. The participants could intervene at any time, but after their intervention the automatic dimming would resume. The authors defined the point of intervention as the “acceptable” light level, and reported that a mean reduction of 13% was acceptable.
In all of the above studies participants were told by the experimenters that the lighting level might change in the short term. In a real demand-response situation this is unlikely to be true: building occupants might be informed that lighting may be dimmed sometime during the summer in response to a critical peak power situation, for example, but would likely not receive a notification seconds or minutes in advance. One hypothesis is that lack of awareness would reduce sensitivity to changes in electric lighting level. Newsham et al. [2002] conducted a pilot study which explored this. Participants (N=10) completed
various tasks and satisfaction questionnaires for 2.7 hours in a windowless office. Participants set the initial light level from 12 to 100% of maximum light output (desktop illuminance ~75 to 630 lx), and were able to adjust the level throughout the session. Twenty minutes after the start of the session, the experimenters dimmed the lights at the very slow rate of 1% of full output every 2 minutes. Similar to Tenner et al., the first intervention by participants to raise the light level was the outcome measure. Light levels fell by 13-80% before occupants
intervened, median ~48%. Occupants’ satisfaction did not appear to suffer as a result of the dimming.
In Newsham et al. [2006] two groups of participants (N=31 per group) completed various tasks and satisfaction questionnaires over a typical work day in a six-person office laboratory with little daylight. Participants in one group were
exposed to constant indoor environment conditions all day: desktop illuminance ~ 500 lx. The second group received the same illuminance conditions in the
morning, but just after lunch, and with no expectation given to participants, the experimenters dimmed the lights at 2% of full output every minute, to a minimum desktop illuminance of ~ 200 lx. Results suggested that occupants did not detect this 60% reduction in light level, and that there was no overall net effect on mood, satisfaction, or task performance.
Comparison of the intervention studies of Newsham et al. [2002] and Tenner et al. [1997] to other work depends on how the intervention is interpreted. If it is interpreted as the point of detection, then Tenner et al.’s [1997] finding is similar to that of most previous detection studies, whereas in Newsham et al. [2002] detection sensitivity was dramatically reduced, likely due to participants’ lack of prior expectation of dimming (supported by Newsham et al. [2006]). However, if intervention is interpreted as acceptance, or tolerance, of inferior conditions, then Newsham et al.’s [2002] finding is similar to Akashi & Neches [2004, 2005]
acceptance data and to Newsham et al. [2006], whereas Tenner et al.’s [1997] value is much lower3. It is perhaps tolerance which is more relevant to the demand response scenario. After all, in a real building light levels may change frequently, particularly in the presence of daylight. In such cases, the issue for occupant comfort is not detectability, but rather, are the changes large enough to stimulate an action to moderate them? The above review suggests that using intervention as a threshold to define acceptable load shedding scenarios in realistic situations, rather than detectability derived from artificial situations, would allow for larger lighting reductions. However, this is based on a limited number of studies. To explore this further we replicated Newsham et al.’s [2002] pilot study with a larger sample size, and a somewhat faster dimming rate. This experiment is described below.
3
An issue that remains unaddressed by prior work, and this study, is the effect of chromaticity change during dimming on the detection and acceptance of dimming levels.
Personal Lighting
Personal Air Nozzle
Fig. 2. Photograph of experimental space.
2. METHODS
The data described in this paper were derived from a larger laboratory study that addressed the effect of demand response on indoor environments, as well as various aspects of personal environmental control. Other elements from this larger study have been reported elsewhere [ACEEE, 2006].
2.1 SETTING
The experimental space was 12.2 m x 7.3 m x 2.7 m, with an exterior wall facing west. The exterior wall contained two small windows; Venetian blinds were drawn and closed over the upper two-thirds of these windows. The space
contained six typical “cubicle” offices of 2.83 m x 2.22, panel height 1.68 m. The space had a dedicated HVAC system, and air was delivered via 10 nozzles in the ceiling (one in each corner, and one per cubicle). Electric lighting was
on the perimeter; and 6 pairs (one pair per cubicle) of 3-lamp suspended direct-indirect luminaires, one lamp (up-light) was mounted above, and optically separated from, the other two lamps (down-light). All lamps used were 32W T8 3500K. The prismatic luminaires were dimmed to provide ~120 lx at floor level on the room perimeter. Fig. 2 shows a photograph of the space, and Table 1 shows the measured reflectances of the major surfaces.
TABLE 1. Measured reflectances of major surfaces [Houser et al., 1999]
Room Surface Material Colour Reflectance
Ceiling acoustical ceiling tile matte white 89.0
Desktop formica low gloss off-white 50.3
Floor carpet matte multi-colored 12.2
Furniture Panel fabric matte off-white 46.0
External Wall painted wallboard light neutral gray 62.7
2.2 PARTICIPANTS
Participants were recruited from a local temporary employment agency. Up to six people participated on a testing day, between 9 am and 4 pm. During the day participants completed a variety of satisfaction questionnaires and simulated office tasks; these activities were both computer- and paper-based. The day was divided into four sessions: T1, between morning arrival and mid-morning break; T2, between mid-morning break and lunch; T3, between lunch and mid-afternoon break; and T4, between mid-afternoon break and the end of the afternoon. Session T1 included on-screen instructions, questionnaires and practice tasks, the remaining sessions had very similar content, featuring questionnaires and the tasks that were practiced in T1. There were 31 participants (15 male, 12 female, 4 did not self-identify), ranging in age from 18 to 59 (2 did not self-identify).
2.3 EXPERIMENTAL CONDITIONS
On each day, one of four experimental conditions prevailed, of which only one is directly relevant to this paper.
When participants first entered the space, the direct component of the direct-indirect luminaire was set at a level that, in combination with the fixed perimeter and up-lighting, delivered a minimum of ~400 lx (mean ~490 lx) on the desktops. The corner air supply nozzle dampers were fully open, and the other nozzle dampers were at half-flow (total flow rate ~350 ls-1, ~25% outdoor air). Supply air temperature was 18oC, resulting in a room temperature of ~22.5oC. Participants were then given personal control over the air flow rate from the nozzle in their cubicle, and over the output of the down-lights in their cubicle, this control was exercised through an on-screen interface that was always available. The position of the nozzle damper in each cubicle had a minimal effect on mean air temperature in the cubicle, because of good air mixing in the larger space. However, control of the nozzle damper could vary the local air velocity between ~0.1 ms-1 to ~0.5 ms-1, with a substantial effect on local cooling sensation. Participants could choose a down-light output from 20 to 100%, resulting in a
desktop illuminance of ~200 lx to ~700 lx. The maximum effect of one person’s lighting choice on their neighbour was about 20 lx.
At the beginning of session T3 we imposed a degradation in indoor environment conditions typical of a demand response to a utility prompt several hours in advance of an expected critical peak. This is characteristic of one form of
demand response signal [Piette, 2005; IESO, 2006]. The down-light component of the direct-indirect luminaire was reduced by 2% of full output per minute, to a minimum 20% output; this persisted for one hour. The other electric lighting components were maintained at constant output to assure adequate minimum light levels throughout the space. To simulate the effect of reduced chiller operation, the supply air setpoint was raised from 18oC to 24oC in a single step; the supply air temperature reached 24oC ~30 minutes later. The air temperature in the test space increased by ~1.5oC over the following 2.5 hours4. The rate of change of temperature differed by ±0.3oC/hr depending on external climate and internal gains on the day. Note, the participants were not given any advance expectation that these changes in conditions were to be imposed.
2.4 DEPENDENT VARIABLES
In this paper, as in Newsham et al. [2002] and Tenner et al. [1997], the
participant’s intervention to raise electric lighting levels following the initiation of the simulated demand response was the basis of our principal outcome
measures.
There were three basic modes of intervention to the reduction in light level, as illustrated in Fig. 3. Tstart is defined as the time at which the automatic dimming
(simulated demand response) starts; Estart is the illuminance on the desktop at
Tstart, and depends on the individual choice made by each participant prior to
Tstart. Tint is defined as the time at which the participant intervened to raise the
illuminance. This may occur during the automatic dimming period, as in Fig. 3(a), in which case we define Eint as the desktop illuminance just before the
intervention, and Enew as the desktop illuminance just after the intervention5. In
some cases the participant intervened only after the minimum light level was reached, as in Fig. 3(b). In this case we define Eint as the minimum desktop
illuminance. Finally, there were cases in which the participant never intervened, as in Fig. 3(c). In this circumstance, the definition of Tint and Eint is problematic
and somewhat arbitrary. To provide a definition we assumed that the participant would have intervened eventually had they continued to occupy the space (after all, their initial preferred level Estart, was usually substantially above the
4 An alternative approach would be to adjust the room setpoint temperature up to 24 oC. If this is
done with a VAV system, the supply air temperature will stay the same and the airflow rate will be reduced, and the general room air temperature will rise. This might be a more common approach in practice, and may be perceived differently by occupants than the approach we took. However, from an experimental design point of view, we did not want to confound the effects of flow and temperature, and, from an ethical point of view, we did not want to risk exposing our participants to outside air flow rates lower than recommended practice.
minimum). In this case we again define Eint as the minimum desktop illuminance.
Tint could be any value beyond the end of the experimental session. We took the
most conservative assumption, that the participants would have intervened if the session had lasted just a few minutes longer, and set Tint to 210 minutes.
Estart Eint Tstart Tint Time Ill umin an ce Enew Estart Eint Tstart Tint Time Ill umin an ce Enew Time Il lu mi nance Estart Eint Tstart Tint Enew Time Il lu mi nance Estart Eint Tstart Tint Enew Time Illum inan c e Estart Eint Tstart Tint=? Time Illum inan c e Estart Eint Tstart Tint=?
(a) During dimming period
(b)After minimum illuminance reached
(c) No intervention Fig. 3. Modes of intervention and definition of dependent variables.
3. RESULTS & DISCUSSION
Thirty-one participants provided data for the experiment. However, the recorded desktop illuminance data were abnormally low for one participant – we speculate that this participant inadvertently covered the sensor with task materials – and therefore the data for this participant were removed from the analysis.
It should be noted that Fig. 3 shows the simple case with no effect of daylight. For the purposes of the larger experiment, small, highly-shaded windows were present in the exterior wall of the experimental space. The windows made a minimal contribution to the desktop illuminance in the four workstations not directly adjacent to the windows, but could contribute up to 200 lx for the adjacent workstations. However, the contribution was very dependent on weather and time of day. This adds some (not unrealistic) noise into the data. Nevertheless, an initial check showed no effect on average intervention level, and thus we grouped data from all workstations for the following analyses.
3.1 INTERVENTION MODES
Only three participants intervened during the demand-response dimming period (Fig. 3(a)), 14 intervened after the minimum illuminance level had been reached (Fig. 3(b)), and 13 did not intervene at all (Fig. 3(c)). To put this in context, the lighting controls were used by 23 participants during T1 (when the controls were first made available), but by only 9 participants during T2. This does suggest that the use of controls during and after the demand-response dimming period was higher than it would have been had lighting conditions remained constant. This
immediately suggests sensitivity to the dimming was low and slow, but not entirely absent.
3.2 PREFERRED ILLUMINANCES
Before looking further into the data on interventions, it is valuable to examine the preferred illuminances prior to the automatic dimming, and to compare this to existing recommended practice and prior research. The mean desktop
illuminance as a result of participants’ free control over the down-light component was 450 lx (s.d. 102 lx). This is remarkably similar to other studies of preferred luminous conditions where individual dimming was offered in non-daylit spaces, and which used different luminaire types. Newsham et al. [2004] found a mean preference of 452 lx (s.d. 241 lx), and Veitch & Newsham [2000] reported a mean preference of 445 lx (s.d. 147 lx) for participants at the start of a work day, and 400 lx (s.d. 155 lx) at the end of a work day. This is also consistent with
recommendations for office lighting made by the IESNA [2004].
3.3 ILLUMINANCE AT INTERVENTION
For those participants who intervened after the automatic dimming period, or did not intervene at all, Eint was simply the minimum desktop illuminance, which was
225 lx. For those who did intervene during the automatic dimming period, mean Eint was not substantially higher, at 241 lx. Therefore, even those who intervened
during dimming did not react until the illuminance was close to minimum. Using the definitions of Estart and Eint above, the mean percentage reduction in
illuminance before intervention is: 30
(
Σ
100 • (Estart – Eint) / Estart)
/ n (1)n=1
This calculation yields a value of 46.7% (s.d. 15.5%). This value is consistent with the findings of Newsham et al.’s [2002] pilot study. It is a much larger value than published research on detectability, and similar to Akashi & Neches [2004, 2005] value derived from acceptability. There are three obvious explanations for this. The first explanation is that intervention indicates a threshold for
acceptance or tolerance, rather than detection. In this case our results are consistent with Akashi & Neches [2004, 2005] and Newsham et al. [2006], but inconsistent with Tenner et al. [1997] in which the same response mechanism was used, but the mean illuminance reduction was only 13%. If intervention does indicate detection, then the second explanation is that the rate of automatic dimming we used was much slower than in almost all published research. The exception to this is again Tenner et al. [1997], which used a dimming rate similar to ours, and used the point of intervention as a measure, but found a mean illuminance reduction of only 13%. The third explanation is that in our study, unlike most other studies, participants were given no prior expectation that dimming would occur, and that lack of expectation, combined with realistic office tasks and furnishings, reduced sensitivity to changes in electric light level.
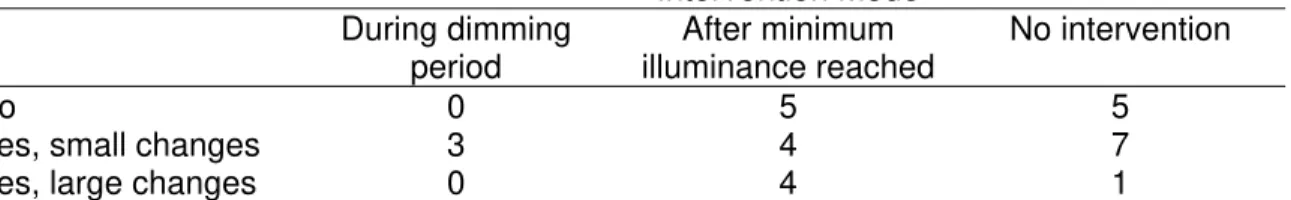
To explore this issue further, we looked at data from one of the questionnaires completed during each experimental session. Participants were asked “Have you noticed any changes in electric lighting level since the beginning of the
session?”. Table 2 shows a cross-tabulation of responses, by intervention mode; data shown are from the end of T3, the session during which the simulated
demand response was initiated. Table 2 shows that all three of the participants who intervened during dimming said they had noticed a change in light level during the session. A majority (8 of 13) of those who intervened after the minimum illuminance had been reached also said they had noticed a change; note, in two cases their intervention was conducted during T4. Interestingly, a majority (8 of 13) of those who never intervened said they had noticed a change. It is important to note that the question was not specific to where the change was coming from. Participants might have interpreted the question to mean the manual dimming of other participants, or even their own manual dimming, as well as the automatic demand response dimming. Additionally, they may have
attributed changes from daylight as changes in electric light. The data from those who did not intervene at all might suggest that changes were often
detected, but that these changes were not large enough to stimulate use of their personal lighting control, in other words, the change was acceptable, or tolerable. On the other hand, five people who did make a change after the minimum
illuminance had been reached said they had not noticed any change in light level, and therefore used their controls for other conscious reasons. However, the number of participants is too small, and the question not specific enough, to make more definite statements. Note that other aspects of the larger experiment [Newsham et al., 2006] suggested that dimming at 2% per minute was not
detected.
TABLE 2. Response to question: “Have you noticed any changes in electric lighting level since the beginning of the session?” (T3), by intervention mode.
Intervention Mode During dimming period After minimum illuminance reached No intervention No 0 5 5
Yes, small changes 3 4 7
Yes, large changes 0 4 1
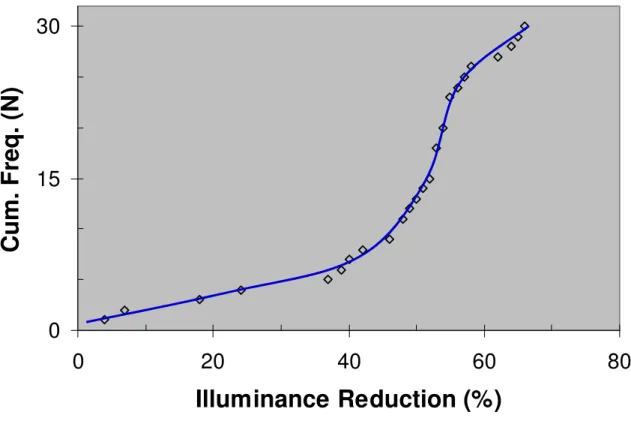
Fig. 4 is a cumulative frequency distribution for the individual values of percentage illuminance reduction at intervention. A line through the points
approximating a Sigmoid form (typical for cumulative frequency distributions) was fitted by eye to these points to aid interpretation. The point at which 50% of people respond to a stimulus has often been taken as an appropriate threshold for practice in this domain. Fig. 4 shows that 50% of participants (N=15) had intervened by the time that desktop illuminance had declined ~50% from their initial preferred level. Note that for most participants this intervention occurred after the minimum illuminance had been reached. However, for a practical demand response system we might want to recommend a more conservative
threshold. For example, 20% of participants (N=6) had intervened by the time that desktop illuminance had declined ~35%.
0
15
30
0
20
40
60
Illuminance Reduction (%)
Cum. Freq. (N)
80
Fig. 4. Cumulative frequency distribution for percentage illuminance reduction at intervention.
3.4 TIME TO INTERVENTION
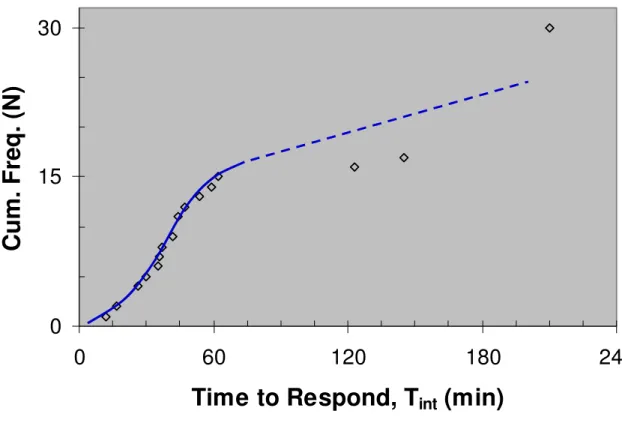
Fig. 5 is a cumulative frequency distribution for the individual values of Tint (as
defined earlier). Again, a line through the points approximating a Sigmoid form was fitted by eye to these points to aid interpretation. However, note that there are no actual interventions after 143 minutes, the points at 210 minutes are based on the somewhat arbitrary, conservative assumption for those participants who did not intervene. The shape of the curve on the right-hand side of the graph is therefore speculative, fortunately, it is the left-hand side that is of most interest. These data offer another way of looking at the issue: how long will people tolerate the imposed lower lighting levels before intervening? Fig. 5 shows that 50% of participants (N=15) intervened within ~60 minutes of the automatic dimming being initiated. For a more conservative threshold, 20% of participants (N=6) intervened within ~30 minutes. Remember that for most participants, Tint included time after the dimming had finished and lighting was at
the minimum level.
This result implies that to avoid dissatisfaction with an imposed lighting demand response the dimming should not persist for more than 30-60 minutes, and
therefore should not be triggered too far in advance of a predicted peak demand crisis. In a situation where occupants have override control, dissatisfaction could lead occupants to restore higher light levels, causing a “snap-back” during the peak demand period. This experiment provides data to assess the magnitude of this potential snap-back, by comparing Enew to Estart in the following equation:
30
(
Σ
100 • (Estart – Enew) / Estart)
/ n (2)n=1
Here, we define Enew for those who did not intervene as the minimum desktop
illuminance, because there was no increase of dimmer setting during the period of interest. This calculation yields a value of 32.0% (s.d. 31.2%). In other words, after intervention there are still savings compared to initial levels, but these savings are about one-third lower than the pre-intervention values (calculated with Eq. 1). This suggests that even if demand response dimming occurs too soon or persists for too long, there will still be an overall saving in lighting power demand, but it may not be as large as if the timing were optimized.
The issue of timing and dissatisfaction snap-back may only be a concern when demand response is prompted by a utility forecast an hour or more in advance of the predicted peak demand. There are other forms of demand response that may occur over shorter timescales. For example, utilities must maintain a certain amount of operating reserve power capacity to guard against the unexpected failure of a generating station. This operating reserve is typically at least equal to the capacity of the largest generator in the system [Kirby, 2003]. Traditionally, this operating reserve is met on the supply side, through starting up back-up generators, or guaranteed contracts to import power from other jurisdictions. Typically, utilities require that this reserve capacity can be brought on-line within a few minutes, and may only be required for 30 minutes, at which time other solutions become available [Kirby, 2003; Rebours & Kirschen, 2005].
Nevertheless, there is no reason in principle6 why reductions in demand could not contribute to operating reserve [Kirby, 2003]. In this context, dimming lights represents a good opportunity, in that substantial reductions can be achieved rapidly, and without likely dissatisfaction or snap-back within the 30 minute-timeframe.
The acceptability of demand-responsive dimming in practice is likely to depend on the perceived reason for dimming. Emergency demand response may be implemented to protect grid stability, whereas economic demand response may be implemented during periods of higher pricing when there is no immediate threat of grid instability, when the goal is to reduce utility bills and not to avoid blackouts. Most would expect that acceptability would be higher in the former situation than in the latter, but this remains to be demonstrated objectively. Such a study would most effectively be conducted in the field. A field study would also
be useful to confirm the findings in this paper, to examine whether the behaviour of occupants in an office laboratory during a single day is comparable to the behaviour of people in their own workplaces over the long term.
0
15
30
0
60
120
180
240
Time to Respond, T
int(min)
Cum. Freq. (N)
Fig. 5. Cumulative frequency distribution for time to intervention following the start of dimming due to the simulated demand response.
3.5 COST ISSUES FOR PRACTICE
It is clear that dimming lighting can make a substantial contribution to the
reduction of peak power demand in office buildings. However, dimming systems (as opposed to simple on-off systems) are still relatively rare in existing office buildings, and dimming ballasts represent only a few percent of all ballasts
shipped [AEC, 2002]. The main barrier to market penetration is first cost. Simple energy savings due to daylight harvesting [Lee & Selkowitz, 2006] and personal control [Newsham et al., 2004], although substantial, often result in long payback times, at current typical North American energy prices. However, many utilities now apply demand charges, which are based on peak demand during periods of high system-wide demand. In such cases demand-responsive dimming may reduce payback times substantially. Further benefits may accrue to electric utilities if generation costs are offset. For example, the Ontario Power Authority estimated the capital cost of new generation from conventional sources at around $1,000 – $3,000/kW, depending on the fuel type [OPA, 2005]. Assuming that the incremental cost of an individual dimming ballast is $60, that it controls 60W of
lighting, and can save 30%7 during demand response, the capital cost of shedding load using dimming ballasts falls just above the upper end of this range. Add in the cooling load reduction by reducing light output [Newsham et al., 1998], energy savings through daylight harvesting which are potentially available when dimming ballasts are used [Lee & Selkowitz, 2006], and the energy savings and satisfaction benefits to occupants if they are given access to dimming ballasts for personal control of lighting [Newsham et al., 2004], and the total cost-benefit equation for dimming ballasts may look attractive from a society point of view.
Nevertheless, the building owner/operator must see reduced first costs to stimulate purchase. There are two ways in which this can happen in the short term. First, Lee & Selkowitz [2006] have demonstrated that in volume
purchases, the cost of dimming ballasts can approach half the $60 assumption. Second, some utilities offer incentives for lighting system with dimming ballasts that recognize their benefits. For example the National Grid (a utility serving New England states) offers a $40/ballast rebate for dimming ballasts with daylight harvesting controls [National Grid, 2006], and PSE&G (a utility serving New Jersey) offers a $25/fixture rebate for luminaires with daylight harvesting controls [National Grid, 2006]. Incentive schemes could be broadened to fairly recognize the role of demand-responsive dimming in offsetting generation costs and grid stabilization.
4. CONCLUSIONS
This study examined occupant response to a simulated demand response involving the dimming of office lighting by 2% per minute. The conditions were more realistic than those in most other prior laboratory studies, in terms of the setting, tasks performed by the participants, and lack of expectation that the dimming will occur. The measure used was the point at which participants intervened with their override personal dimming control after the automated demand-response dimming began. Several interesting conclusions may be drawn from this study:
• 20% of participants intervened by the time that desktop illuminance declined ~35% from their initial preferred level, and 50% of participants intervened by the time that desktop illuminance declined ~50%.
• 20% of participants intervened within ~30 minutes of the automatic dimming being initiated, and 50% of participants intervened within ~60 minutes.
• Even after intervention, desktop illuminance, on average, was 32% lower than before the demand response began.
• The mean preferred desktop illuminance as a result of participants’ control over the down-light component before the simulated demand response began
7
Dimming level and power draw are not related in a one-to-one fashion in most commercial systems. Therefore we assume the 35% dimming potential quoted earlier translates into a 30% power reduction.
was 450 lx (s.d. 102 lx). This is consistent with other research and recommended practice.
It is apparent that during a power supply emergency, dimming lights can deliver relatively large electricity demand reductions over a relatively short period. However, the resulting light levels are substantially below those chosen by people under normal circumstances, and many act to reverse the changes, to some extent, when override control is available. Therefore, we recommend that such automatic dimming is done in response to genuine power supply
emergencies only, and not as a routine cost saving measure.
ACKNOWLEDGEMENTS
This work was sponsored by the National Research Council Canada (NRC), the Program on Energy Research & Development, and Public Works & Government Services Canada (PWGSC). The authors are grateful to Roger Marchand (NRC), William Lei (NRC), and Chantal Arsenault (NRC) for their technical
assistance in creating the experimental set-up. We would also like to thank Kate Charles (NRC) and Jennifer Veitch (NRC) for their contributions to the
experimental design, and Morad Atif (NRC) for his on-going support. We would also like to acknowledge the contributions of Karen Pero (PWGSC), Ed
Kutrowski (PWSGC) and Winston Hetherington (Bass Consulting).
REFERENCES
[AEC]. 2002. Demand responsive lighting systems
URL: http://www.archenergy.com/lrp/demandresp_lighting.htm(last access: 2006-07-28) Akashi Y, Neches J. 2005. Potential recommendations for illuminance
reductions by load shedding. Lighting Research & Technology, 37(2): 133-153. Akashi Y, Neches J. 2004. Detectability and acceptability of illuminance
redcution for load shedding. Journal of the Illuminating Engineering Society, 33: 3-13.
[ASHRAE] American Society of Heating, Refrigerating and Air-Conditioning Engineers. 2004. Thermal environmental conditions for human occupancy. Atlanta (USA). ANSI/ASHRAE Standard 55-2004.
Boyce PR. 1984. Lighting control: the user's point of view. Proceedings of the CEA/DBR Symposium, Ottawa (Canada): 69-85.
[DRCC]. 2006. United States Demand Response Coordinating Committee. URL: http://www.demandresponseinfo.org/ (last access: 2006-07-28)
Houser KW, Tiller DK, Pasini I. 1999. Toward the accuracy of lighting simulations in physically based computer graphics software. Journal of the Illuminating Engineering Society, 28(1): 117-129.
[IEA] International Energy Agency. 2006. Light’s labour’s lost: policies for energy-efficient lighting. Paris (France).
[IESNA] Illuminating Engineering Society of North America. 2000. Lighting handbook: reference and application (9th ed.). New York (USA).
[IESNA] Illuminating Engineering Society of North America. 2004. American national standard practice for office lighting. New York (USA). ANSI/IESNA-RP-1-04.
[IESO]. 2006. Ontario's Independent Electricity System Operator, Emergency Load Reduction Program (ELRP).
URL: http://www.ieso.ca/imoweb/elrp/elrp-index.asp (last access: 2006-07-28) Kelly DH. 1961. Visual responses to time-dependent stimuli. I. Amplitude and sensitivity measurements. Journal of the Optical Society of America, 51(4): 422-429.
Kirby BJ. 2003. Spinning reserve from responsive loads. Oak Ridge National Laboratory. Tennessee (USA). ORNL/TM-2003/19.
URL: http://certs.lbl.gov/pdf/spinning-reserves.pdf (last access: 2006-07-28) Kryszczuk KM, Boyce PR. 2002. Detection of slow light level reduction. Journal of the Illuminating Engineering Society, 31: 3-10.
Lee ES, Selkowitz SE. 2006. The New York Times Headquarters daylighting mockup: monitored performance of the daylighting control system. Energy and Buildings, 38(7): 914-928.
[National Grid]. 2006. National Grid’s lighting incentive and eligibility
requirements manual for Massachusetts and Nantucket customers, 2006 Design 2000plus Program.
URL: http://www.nationalgridus.com/non_html/shared_energyeff_lighting_newconst.pdf (last access: 2006-08-26)
Newsham GR, Mahdavi A, Mathew P, Cornick SM, Sander DM, Brahme R. 1998. Impact of the adoption of efficient electrical products and control technologies on office building energy use. ASHRAE Transactions, 104: 286-298.
Newsham GR, Marchand RG, Svec JM, Veitch JA. 2002. The effect of power constraints on occupant lighting choices and satisfaction: A pilot study.
Proceedings of the IESNA Annual Conference, Salt Lake City (USA): 115-131. Newsham G, Veitch J, Arsenault C, Duval C. 2004. Effect of dimming control on office worker satisfaction and performance. Proceedings of the IESNA Annual Conference, Tampa (USA): 19-41.
URL: http://irc.nrc-cnrc.gc.ca/pubs/fulltext/nrcc47069/
Newsham GR, Donnelly C, Mancini S, Marchand R, Lei W, Charles K, Veitch J. 2006. The effect of ramps in temperature and electric light level on office
occupants: a literature review and a laboratory experiment. Proceedings of the ACEEE Summer Study (Asilomar, USA).
URL: http://irc.nrc-cnrc.gc.ca/ie/lighting/office/demand_e.html
[NRCan] Natural Resources Canada. 2005. Energy use data handbook. Gatineau (Canada).
URL: http://oee.nrcan.gc.ca/corporate/statistics/neud/dpa/data_e/handbook05/datahandbook2005.pdf
[OPA] Ontario Power Authority. 2005. Supply mix advice report.
URL: http://www.powerauthority.on.ca/Report_Static/157.htm (last access: 2006-07-28) Piette MA, Watson DS, Motegi N, Bourassa N. 2005. Findings from the 2004 fully automated demand response tests in large facilities. Report for the PIER Demand Response Research Center. LBNL Report Number 58178.
URL: http://drrc.lbl.gov/pubs/58178.pdf.
[PSEG]. 2006. New Jersey Smart Start Buildings Program.
URL: http://www.njsmartstartbuildings.com/main/equip_inc.html (last access: 2006-08-26) Rebours Y, Kirschen D. 2005. A survey of definitions and dpecifications of reserve services. University of Manchester.
Rowlands IH. 2005. Ontario demand response scenarios. CANMET Energy Technology Centre – Varennes, Natural Resources Canada. CETC 2005-139,. URL: http://cetc-varennes.nrcan.gc.ca/fichier.php/codectec/En/2005-139/2005-139e.pdf
Shikakura T, Morikawa H, Nakamura Y. 2003. Perception of lighting fluctuation in office lighting environment. Journal of Light & Visual Environment, 27: 15-22. Tenner AD, Begemann SHA, van den Beld GJ. 1997. Acceptance and
preference of illuminance in offices. Lux Europa’97, Proceedings of the 8th European Lighting Conference, Amsterdam (The Netherlands): 131–143.
Veitch JA, Newsham GR. 2000. Exercised control, lighting choices, and energy use: an office simulation experiment. Journal of Environmental Psychology, 20(3): 219-237.
Watson AB 1986. Temporal sensitivity, Chapter 6 in Handbook of Perception and Human Performance [eds. Boff, Kaufman & Thomas], Wiley (USA).