Publisher’s version / Version de l'éditeur:
LD+A Magazine, 44, 12, pp. 54-56, 2014-12-01
READ THESE TERMS AND CONDITIONS CAREFULLY BEFORE USING THIS WEBSITE. https://nrc-publications.canada.ca/eng/copyright
Vous avez des questions? Nous pouvons vous aider. Pour communiquer directement avec un auteur, consultez la première page de la revue dans laquelle son article a été publié afin de trouver ses coordonnées. Si vous n’arrivez pas à les repérer, communiquez avec nous à PublicationsArchive-ArchivesPublications@nrc-cnrc.gc.ca.
Questions? Contact the NRC Publications Archive team at
PublicationsArchive-ArchivesPublications@nrc-cnrc.gc.ca. If you wish to email the authors directly, please see the first page of the publication for their contact information.
NRC Publications Archive
Archives des publications du CNRC
This publication could be one of several versions: author’s original, accepted manuscript or the publisher’s version. / La version de cette publication peut être l’une des suivantes : la version prépublication de l’auteur, la version acceptée du manuscrit ou la version de l’éditeur.
Access and use of this website and the material on it are subject to the Terms and Conditions set forth at
Unlocking the potential energy savings from shorter time delay
occupancy sensors
Dikel, Erhan E.; Newsham, G. R.
https://publications-cnrc.canada.ca/fra/droits
L’accès à ce site Web et l’utilisation de son contenu sont assujettis aux conditions présentées dans le site LISEZ CES CONDITIONS ATTENTIVEMENT AVANT D’UTILISER CE SITE WEB.
NRC Publications Record / Notice d'Archives des publications de CNRC: https://nrc-publications.canada.ca/eng/view/object/?id=9de16357-d013-41c3-a944-8e5d119f2170 https://publications-cnrc.canada.ca/fra/voir/objet/?id=9de16357-d013-41c3-a944-8e5d119f2170
UNLOCKING THE POTENTIAL ENERGY SAVINGS
FROM SHORTER TIME DELAY OCCUPANCY SENSORS
Erhan E. Dikel
,Guy R. Newsham
NRC Construction, Ottawa, ON, Canada
erhan.dikel@nrc-cnrc.gc.ca
Linking occupancy sensors to switches or dimmers is a well-established strategy yielding substantial lighting energy savings. Indeed the technology is considered proven enough that it is now mandated for many space types in most commercial buildings via all major energy codes. Current codes typically require a maximum 30-minute timeout or delay following the last detected occupancy before switching lights off. New codes may reduce this timeout to 20 minutes, promising more savings. It has been long recognized that reducing timeouts further, to 5 minutes or less, will deliver even greater savings [1, 2]. So, why aren’t energy codes more aggressive in mandating shorter timeouts? There are two principal answers to this: (1) prevailing sensor technology is not reliable enough to detect occupancy at such short timescales; (2) even if the sensors were reliable, shorter timeouts would mean more frequent switching, potentially reducing the lifetime of fluorescent lamps to an uneconomical degree. In this article we re-evaluate the potential energy savings of shorter timeout periods with two datasets, and discuss how such timeouts might be viable with LED technology.
Single occupancy sensors are limited in their field of view and sensitivity, so a lengthy timeout period is invoked to ensure that the space is truly empty before lights are switched off. Most of us have experienced occasions when this doesn’t work, and we have to wave our arms vigorously to bring the lights back on in a room that has suddenly gone dark! (In technical terms, the control system has registered a “false negative”.) Combined signals from multiple sensors provide more accuracy [3]. In the past, multiple sensors to control the lighting in a single space would have been cost-prohibitive. Today, the cost of sensors is coming down rapidly; our work suggests that multiple cheap sensors can be more accurate than a single high quality sensor. Further, with the recent developments in solid-state lighting technology, there are many LED luminaires on the market with built-in occupancy (and other) sensors as standard, offering the potential of multiple sensors per space that may be leveraged for advanced control. Such a sensor network also raises the possibility of controlling luminaires within an open-plan space based on the occupancy of individual workstations, an occupancy-based control scenario not currently required by energy codes.
We modelled an idealized lighting control system using a large number of sensors to enable very short time delays to illustrate its energy saving potential. We did this in the context of an office space with six workstations (1.8 m by 2.4 m (6 ft by 8 ft)) clustered in a windowless room. We calculated the energy savings based on two sets of occupancy data we measured in real office spaces which are more representative of current office use than the data collected in Neida et al.’s [1] and Richman et al.’s [2]. The first set of data was recorded in a partitioned open office area every five minutes by individual passive infrared occupancy sensors located above the center of each workstation [4]. The second data set was collected from 28 open and private office spaces every 15 seconds, using a pressure-sensitive floor mat to indicate
2
occupancy. Comparison of the two datasets suggested they were very similar in their overall occupancy patterns. We selected the occupancy data of six workstations and offices in each data set from 10 non-contiguous days between 7:00 A.M. and 7:00 P.M. The choice of six workstations and offices matched the number of workstations in the simulated space, and 10 days provided a reasonable variety of occupancy patterns.
We explored three basic control scenarios. Our initial lighting renderings suggested that each workstation required a lighting power density (LPD) of 13.5 W/m2 (1.25 W/ft2), using workstation-specific luminaires and with the LPD calculated only within the area of the workstation itself, to achieve recommended light levels.
SIMULATION SCENARIOS
Scenario 1, timer control: Typical of current lighting practice in older commercial buildings when all luminaires are centrally controlled, all the lights are turned on in the morning before the first occupant is expected to arrive and turned off in the evening after the last occupant is expected to leave (lights are on for 12 hours, 7:00 A.M. and 7:00 P.M). Therefore, the energy use over 10 days is 7.2 kWh. This scenario serves as a benchmark. See Table 1 for this and other results.
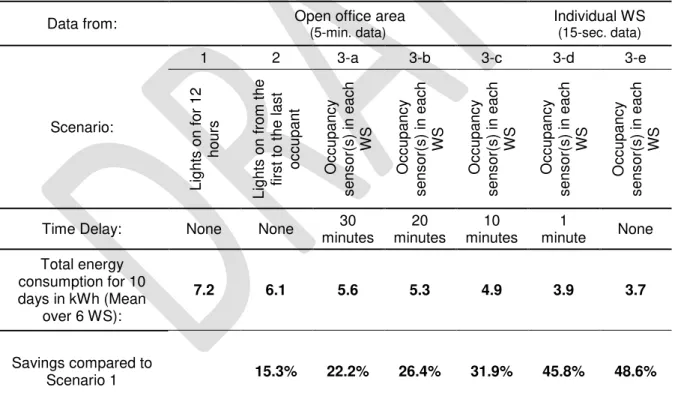
Table 1. Energy consumption calculations for three scenarios during 10 workdays in six workstations (WS).
Data from: Open office area
(5-min. data) Individual WS (15-sec. data) Scenario: 1 2 3-a 3-b 3-c 3-d 3-e Li g ht s on for 1 2 hour s Li g ht s on fr om t he fi rs t t o t he las t oc c upant O c c upanc y s ens or (s ) i n eac h WS O c c upanc y s ens or (s ) i n eac h WS O c c upanc y s ens or (s ) i n eac h WS O c c upanc y s ens or (s ) i n eac h WS O c c upanc y s ens or (s ) i n eac h WS
Time Delay: None None 30 minutes 20 minutes 10 minutes 1 minute None Total energy consumption for 10 days in kWh (Mean over 6 WS): 7.2 6.1 5.6 5.3 4.9 3.9 3.7 Savings compared to Scenario 1 15.3% 22.2% 26.4% 31.9% 45.8% 48.6%
Scenario 2, adaptive central control: In a 12-hour window, all lights are on from the arrival of the first occupant to the departure of the last occupant, with a 10-minute time delay after the last occupant leaves. This scenario represents an adaptive centrally-controlled system or a system with a single occupancy sensor for the entire space that aims to minimize unnecessary energy
3
consumption at the start and end of the day. This could be also achieved with disciplined manual control.
Scenario 3, one or more occupancy sensor(s) for each workstation with various timeouts: In all cases, lighting is switched on in a workstation when occupancy is detected within it. The shorter timeout periods would require multiple sensors per workstation to achieve the necessary detection accuracy. Scenario 3-a (30-minute time delay) represents the upper limit of the timeout requirement in the prevailing energy codes. Compared with Scenario 1, a time delay of 30 minutes yields 22.2% savings. It is likely that existing sensor technology could be reliably adjusted to shorter time delays [5] and 20 minutes (Scenario 3-b) might be the upper time delay limit in the next generation of energy codes. This saves 26.4%, higher than Scenario 3-a, but not dramatically so. Scenario 3-c (10-minute time delay) represents an aggressive setting for existing single sensor technology and saves 31.9% compared to Scenario 1. Scenario 3-d, multiple sensors (impervious to false negatives) with a 1-minute timeout, has energy use 45.8% lower than Scenario 1. In Scenario 3-e, multiple sensors (impervious to false negatives), without time delay, yields 48.6% compared to the baseline; this is the theoretical maximum saving for the offices studied.
Overall, Scenario 3-d seems like the best overall balance between maximizing savings, with some protection against false negatives. It represents a saving of 26.4% compared to Scenario 3-b (with 20-minute timeout), reflective of the latest energy code provisions. However, a detailed cost analysis and human factors study of the acceptance of such frequent switching are necessary before commercial application.
OPERATING CYCLES AND TOTAL RUNTIME
Even if accurate sensors allowed more frequent switching for energy savings, doing so with fluorescent lamps might detrimentally affect lamp life. The standard operating cycle of a fluorescent lamp defined by the IESNA is 180 minutes on and 20 minutes off. We calculated the number of on-off cycles of the lighting systems in our simulation model, extrapolating the 10 days of data to 250 work days in a year (Table 2).
Table 2. The estimated number of on-off cycles of six workstations for 250 days.
Scenario 1 3-a 3-b 3-c 3-d Standard Test Time Delay (minutes) N/A 30 20 10 1 N/A Average for 6 WS 250 533 725 1175 2505 1000
It is noteworthy that the 20-minute timeout scenario requires fewer cycles than the standard lifetime test assumption, however, with a 1-minute timeout the number of cycles is greatly increased. Again, LED technology might be the solution, as switching is not a determining factor in LED life [6]. Nevertheless, a shorter lamp life for fluorescents might be acceptable if the shorter run time implied by the savings means a longer period in the socket between replacements. The calculated run time for each of our scenarios is shown in Table 3.
Table 3. The estimated total runtime of light sources for 250 days
4
Average 3000 2195 2096 1938 1607 2750
Translating these various effects into overall cost-benefit for fluorescents is not straightforward. There are also diverse economic factors such as energy costs and labour costs for relamping. See studies like Maniccia et al.’s for an example of the factors to consider in a detailed cost analysis, many of which rely on local conditions and are not generalizable [7].
This article only scratches the surface of the potential value of a higher resolution sensor network associated with LED luminaires. On the lighting side one can also imagine extracting more daylight harvesting savings with a high density of photosensors across a space, each controlling its own luminaire. If LED technology leads to smaller light sources in a space, then advanced sensors may locate the occupant within a workstation, and even the type of task they are doing, and thus dim lighting in parts of the workstation where task lighting is not needed, for even greater savings. A high-resolution motion sensor network may also be leveraged for advanced HVAC control, safety and security applications, and to provide information to real estate providers on space utilization. We look forward exploring these opportunities for many years to come!
Acknowledgements
This study is a product of the NRC project A1-002833, Solid-state Lighting: Enhancing Energy Efficiency and Ensuring Market Acceptance, which is part of the High Performance Buildings program. Financial support was provided by the EcoEnergy Innovation Initiative (managed by Natural Resources Canada), Natural Resources Canada - Office of Energy Efficiency, Ontario Power Authority, and the National Research Council Canada. The authors thank colleagues Jennifer Veitch for her overall project management, guidance and advice, Anca Galasiu for her assistance with occupancy data and lighting simulations, and Trevor Nightingale for his support.
5 REFERENCES
1. Neida, B.V., D. Maniccia, and A. Tweed, An analysis of the energy and cost savings potential of occupancy sensors for commercial lighting systems. Journal of Illuminating Engineering Society, 2001. 30(2): p. 111-122.
2. Richman, E.E., A.L. Dittmer, and J.M. Keller, Field analysis of occupancy sensor operation: parameters affecting lighting energy savings. Journal of the Illuminating Engineering Society, 1996. 25(1): p. 83-92.
3. Guo, X., Tiller D. K., Henze, G.P., Walters, C.E., Analytical methods for application to sensor networks for lighting control. LEUKOS - Journal of Illuminating Engineering Society of North America, 2009. 5(4): p. 297-311.
4. Galasiu, A.D. and G.R. Newsham. Energy Savings due to Occupancy Sensors and Personal Controls: A Pilot Field Study. in Lux Europa 2009, 11th European Lighting Conference. 2009. Istanbul, Turkey.
5. U.S. Department of Energy, Energy savings for occupancy based control (OBC) of variable air volume (VAV) Systems, 2013, Pacific Northwest National Laboratory: Richland, WA.
6. U.S. Department of Energy. Lifetime of White LEDs. 2009; Available from:
http://apps1.eere.energy.gov/buildings/publications/pdfs/ssl/lifetime_white_leds.pdf. 7. Maniccia, D., et al., The Effects of Changing Occupancy Sensor Timeout Setting on Energy
Savings, Lamp Cycling and Maintenance Costs. Journal of Illuminating Engineering Society, 2001. 30(2): p. 97-110.