Publisher’s version / Version de l'éditeur:
Metallurgical and Materials Transactions A, 42, 7, p. 1854, 2011-07-01
READ THESE TERMS AND CONDITIONS CAREFULLY BEFORE USING THIS WEBSITE.
https://nrc-publications.canada.ca/eng/copyright
Vous avez des questions? Nous pouvons vous aider. Pour communiquer directement avec un auteur, consultez la
première page de la revue dans laquelle son article a été publié afin de trouver ses coordonnées. Si vous n’arrivez pas à les repérer, communiquez avec nous à [email protected].
Questions? Contact the NRC Publications Archive team at
[email protected]. If you wish to email the authors directly, please see the first page of the publication for their contact information.
NRC Publications Archive
Archives des publications du CNRC
This publication could be one of several versions: author’s original, accepted manuscript or the publisher’s version. / La version de cette publication peut être l’une des suivantes : la version prépublication de l’auteur, la version acceptée du manuscrit ou la version de l’éditeur.
For the publisher’s version, please access the DOI link below./ Pour consulter la version de l’éditeur, utilisez le lien DOI ci-dessous.
https://doi.org/10.1007/s11661-011-0666-3
Access and use of this website and the material on it are subject to the Terms and Conditions set forth at Solidification analysis of an Al-19%Si alloy using in-situ neutron diffraction
Kasprzak, W.; Sediako, D.; Walker, M.; Sahoo, M.; Swainson, I.
https://publications-cnrc.canada.ca/fra/droits
L’accès à ce site Web et l’utilisation de son contenu sont assujettis aux conditions présentées dans le site LISEZ CES CONDITIONS ATTENTIVEMENT AVANT D’UTILISER CE SITE WEB.
NRC Publications Record / Notice d'Archives des publications de CNRC:
https://nrc-publications.canada.ca/eng/view/object/?id=97330385-36ad-4b25-8995-18ebf4e9eddf https://publications-cnrc.canada.ca/fra/voir/objet/?id=97330385-36ad-4b25-8995-18ebf4e9eddf
SOLIDIFICATION ANALYSIS OF AN Al-19%Si ALLOY USING IN-SITU NEUTRON DIFFRACTION
W. Kasprzak1, D. Sediako2, M. Walker3,M. Sahoo1, I. Swainson2
1
CANMET-MTL, Natural Resources Canada 180 Longwood Ave South, Hamilton, ON, Canada
(*Corresponding author: [email protected])
2
National Research Council, Canadian Neutron Beam Centre Chalk River, ON, Canada
3
General Motors Corporation, Research and Development Center, Warren, MI, USA
ABSTRACT
In-situ neutron diffraction and thermal analysis techniques were used simultaneously to evaluate the kinetics of the non-equilibrium solidification process of an Al-19%Si binary alloy. Feasibility studies concerning the application of neutron diffraction for advanced solidification analysis were undertaken to explore its potential for high resolution phase analysis coupled with fraction solid/liquid analysis of phase constituents. Neutron diffraction patterns were collected in a stepwise mode during solidification between
710ºC and 520 ºC. The variation of intensity of the diffraction peaks were analysed and
compared to the results of conventional cooling curve analysis. Neutron diffraction was capable of detecting nucleation of the Si phase (primary and eutectic), as well as the Al phase during Al-Si eutectic nucleation. Moreover, neutron diffraction indicated the possibility to detect the presence of Si peaks at near liquidus temperature and pre-mature nucleation of α-Al prior to Al-Si eutectic temperature. The solid and liquid volume fractions were determined based on the change of intensity of neutron diffraction peaks over the solidification interval. Overall, the volume fraction determined was in good agreement with the results of the cooling curve thermal analysis, as well as calculations using the FactSage software. The potential of neutron diffraction for high resolution melt
analysis required for advanced studies of grain refining, eutectic modification, etc. has been illustrated. This study will help to better understand the solidification mechanism of Al-Si alloys used for various casting component applications.
Keywords: Aluminium alloys, solidification, neutron diffraction, thermal analysis, phase transformation
1. INTRODUCTION
The hypereutectic Al-Si alloys (about 16-23% Si) are recognized as excellent materials for high performance automotive cast component applications. Important examples include linerless engine blocks for passenger vehicles, motorcycle cylinder blocks cast using high pressure die casting (HPDC), and pistons using low pressure permanent mold
(LPPM) casting processes [1-6]. Figure 1 shows a cross-section of a 250cm3 motorcycle
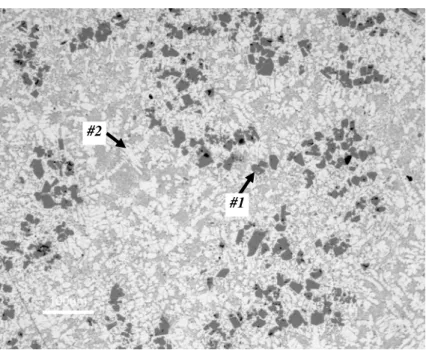
engine with a hypereutectic Al-20%Si cylinder block cast using the vacuum HPDC process. Such components could be heat treated using T5 or T6/T7 tempers for better in-service performance. Figure 2 shows its microstructure in the T6 heat treated condition. The primary Si crystals (#1- dark) with an average equivalent diameter of 20.6±5.9μm and the non-equilibrium α aluminum dendrites (#2 - gray) are visible.
The molten hypereutectic Al-Si alloys are recognized to have a heterogeneous distribution of Si atoms (clusters) with a short range atomic order [3, 7, 8] at near-liquidus temperatures. Most of these heterogeneities act as solidification sites and facilitate primary Si nucleation [7]. Most likely they exist in the liquid state well above the liquidus temperature. For this reason, the as-cast microstructure is highly dependent on liquid alloy processing parameters such as melt and pouring temperatures, as well as solidification rate. These parameters have to be precisely controlled during industrial practice to achieve castings with controlled size and distribution of primary Si crystals. Moreover, the industrial practice shows heterogeneous primary Si (#1 - dark) distribution
within casting’s sections containing primary α-Al dendrites (#2 - gray) most likely pre-maturely nucleated above Al-Si eutectic temperature (Figure 2) [1, 5, 7].
Due to the complex solidification process, including the tendency for a heterogeneous distribution of alloying elements at near-liquidus temperatures, hypereutectic Al-19%Si binary alloys were selected for advanced studies using neutron diffraction and thermal analysis techniques. Thermal analysis techniques are conventionally used for evaluation of the solidification process under near-equilibrium conditions [3-5, 11]. Recent
advancements in hardware and software development [9] allowed for better control of solidification parameters, including a wide range of melting and solidification rates, and melt environment control (vacuum, inert/active, elevated pressure). The direct effect of a minor addition of alloying elements at the parts-per-million level can still be difficult to quantify using cooling curve thermal analysis. Various attempts have been undertaken to characterize the solidification process using methods other than thermal analysis. Among other studies K. Nogita et al [12] used electron backscattered diffraction technique for analysis of eutectic solidification in Al-Si alloy. Two different modes of eutectic growth have been identified in 319 type alloy. In the unmodified alloy, the eutectic grew from the primary phase while in the 70-ppm strontium modified alloy the eutectic grains nucleated and grew separately from the primary Al dendrites.
The search for improved phase identification and detection capabilities has resulted in an attempt to utilize the neutron diffraction technique for solidification analysis. The
advantage of using neutrons lies in the highly penetrating nature of radiation that ensures that the scattering observed is representative of the bulk of a test sample. The feasibility of neutron diffraction to provide direct and independent phase assessment, as well as quantification of the solid and liquid fraction during the alloy solidification process has also been evaluated. In general there is limited number of publications concerning application of neutron diffraction for solidification analysis [13, 14, 15]. For example N. Iqbal et al., [13] carried out time-dependent neutron diffraction measurements on the microstructure evolution of pure Al and Al-0.3Ti-0.02B (wt.%) alloy for different
cooling rates. The evolution of the static structure factor S(Q) has been monitored during liquid to solid phase transformation as a function of the cooling rate. It was reported that for the aluminum alloy with addition of 0.3Ti-0.02B the grain growth is
three-dimensional and its rate is observed to be decreased by an order of magnitude compared to the growth rate observed for pure aluminum. Recently, W. Kasprzak, D. Sediako et al., [15] demonstrated the applicability of neutron diffraction for solidification analysis of a binary hypereutectic Al-19%Si alloy using step-wise cooling. Beside qualitative analysis the authors showed the potential to quantify the volume fraction of primary Si and Al and Si in the eutectic phase using diffraction signals from liquid and solid phases as they evolved during solidification.
The objective of this paper is to continue the assessment of the suitability of neutron diffraction techniques for advanced solidification analysis of a hypereutectic Al-19%Si binary alloy, with particular emphasis on primary Si, Al-Si eutectic and fraction
solid/liquid analysis.
2. EXPERIMENTAL PROCEDURE
2.1. Alloy Chemical Composition and Test Sample Configuration
A hypereutectic Al-19%Si alloy was used in the present study. The binary alloy chemistry (Table 1) was intentionally selected to minimize the effect of other alloying elements on neutron diffraction and thermal analysis signals. Such an approach allows for better validation of the suitability of neutron diffraction techniques for solidification analysis. Typically, commercial hypereutectic alloys, such as 390, besides containing 16-19% Si, also contains additions of Cu up to 4%, and Mg up to 1%. A phosphorus
addition of up to 0.1% is used for primary Si refinement. Such alloys, as well as its modified versions, are used for a variety of high performance castings; e.g., engine blocks and pistons manufactured using HPDC and LPPM technologies [1-6].
2.2. Thermal Analysis and Neutron Diffraction during the Alloy Solidification Process
Thermal analysis during the melting and solidification cycles was carried out using the UMSA (Universal Metallurgical Simulator and Analyzer) Technology Platform [9]. The experiments were performed using cylindrical-shaped test samples with an outer
diameter (OD) of 16 mm and a length (L) of 18 mm. The samples were heated to 785±0.2 ºC and isothermally kept at this temperature for a period of ten minutes to stabilize the melt temperature and homogeneity. Next, the test samples were solidified at about a 0.5 ºC/s average cooling rate, calculated between the non-equilibrium liquidus (start of the solidification process) and the non-equilibrium solidus (end of solidification
process) temperatures, 672 and 543 ºC, respectively. To analyze the phase transformation
temperatures for the Al-19%Si alloy, the first-derivative-vs.-temperature and the fraction solid (FS) curves were automatically calculated and plotted. The detailed methodology is described elsewhere [3, 4]. Thermal analysis experiments were verified by phase diagram calculations using the FactSage software package [10].
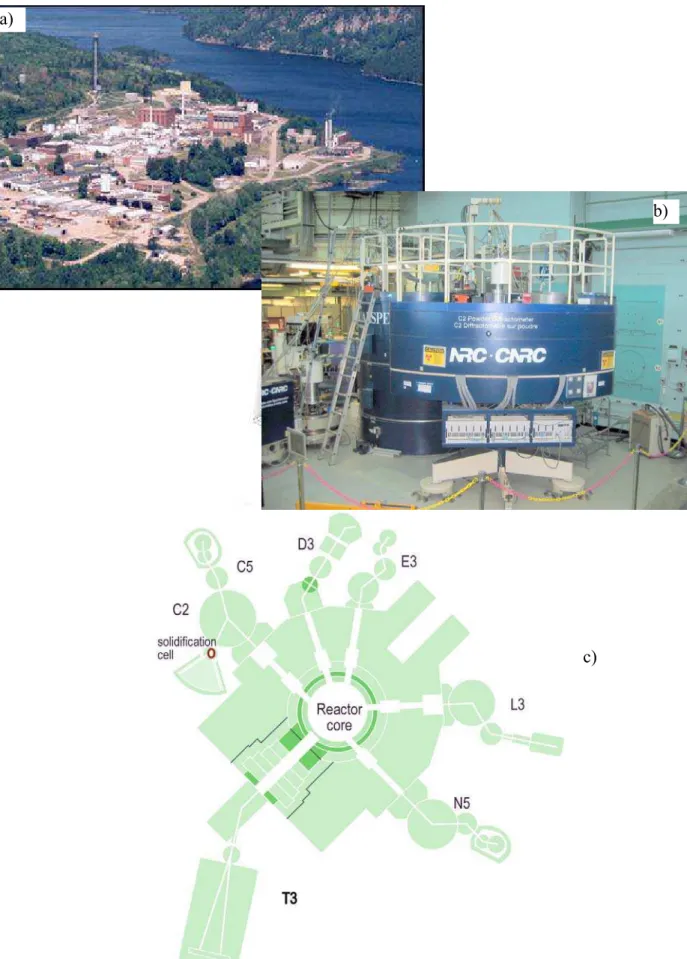
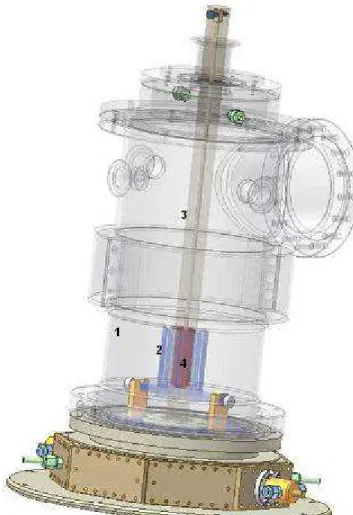
The C2 neutron powder diffractometer at the Canadian Neutron Beam Centre (Figure 3) as well as the High-Resolution Powder Diffractometer installed at High Flux Isotope Reactor (HFIR) in Oak Ridge National Laboratories were used in this study. A solidification cell was designed and built to carry out controlled melting and
solidification experiments under the simultaneous exposure to neutron radiation (Figure 4). The crucible containing the analysed alloy (Figure 4, point #4) was placed inside the open titanium tubing filled with Argon to prevent oxidation at higher temperatures (Figure 4, point #3). The sample material was heated with the tungsten heater (#2) that was housed within the aluminum vacuum chamber (#1). The thermocouples were calibrated based on the melting temperature of pure Al (99.9%), with a precision of ±0.5
º
C. The thermocouple insertion depth into the melt was limited to 6.5 mm, to prevent its contribution to the diffraction pattern. The crucible inner diameter was 15 mm, the total
height was 55 mm (sample material height 50 mm), the sample volume was 14 cm3, and its weight was about 32 grams. The neutron beam height in this setup was 50 mm to eliminate effect of gravity segregation and insure that the diffraction pattern represents the entire sample volume. The test sample temperature was computer controlled based on the K-type sensor and PID circuit. The solidifying Al-19%Si test sample, within a
temperature range of 710 to 520 ºC, was irradiated with monochromatic thermal neutrons.
Diffraction patterns were collected isothermally (by holding for 30 minutes at the following temperatures: 710, 677, 672, 667, 662, 655, 625, 595, 565, 555, 540, and 520
º
C. The measurements were taken in terms of scattered intensity vs. diffraction angle 2Θ
(where Θ is the Bragg angle). The neutron wavelength used for these experiments was
0.154 nm and the analysed scattering angle ranged from 20 to 120 degrees.
3. EXPERIMENTAL RESULTS AND DISCUSSION 3.1. Thermal Analysis during the Solidification Process
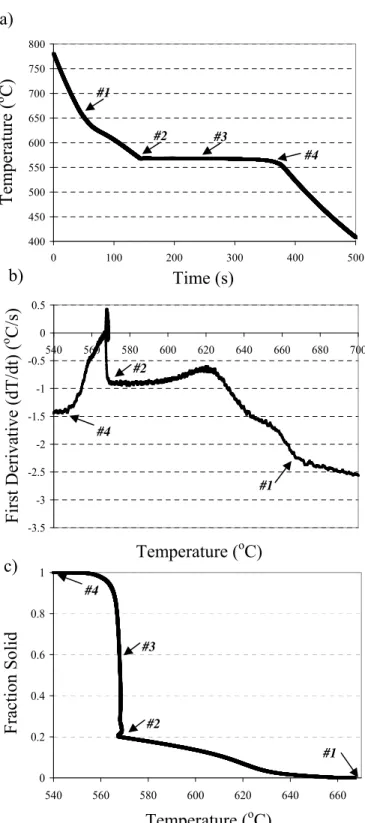
Thermal analysis of the Al-19%Si binary alloy solidified at about a 0.5 ºC/s cooling rate
(instantaneous 2.5 ºC/s in the liquid state) revealed the liquidus temperature to be at 672.4
º
C (see Figure 5 and Table 2). At this temperature, the first primary Si crystals nucleated from the melt. Evolved latent heat caused the temperature of the surrounding melt to rise. This point was clearly visible as a sudden change occurring in the first derivative curve (point #1 in Figure 5b). As the solidification process continued, the primary Si crystals
continued to grow. At 568.9 ºC, the next abrupt change in the first derivative curve
corresponding to the nucleation and growth of the Al-Si eutectic (point #2 in Figure 5b). This was manifested by the positive value of the first derivative peak (see Figure 5b).
Solidification was completed at 542.7 ºC, which corresponded to the solidus temperature
(point #4, Figure 5b). The FS vs. temperature curve for an average solidification rate of
0.5 ºC/s is presented in Figure 1c. A temperature of 672.4 ºC signifies the nucleation of
crystals as a function of temperature is linear up to 20.5%, which corresponds to the
temperature of 568.9 ºC at which the Al-Si eutectic starts to nucleate. The approximate
20% FS at this point can be considered to be the volume fraction of primary Si, since this is the only phase that nucleates from the liquid within the temperature range of 672.4 -
568.9 ºC (see Figure 5c, Table 2). The temperature interval for the development of the
primary Si crystals was very wide - about 103 ºC. As expected, the nucleation and growth
of the Al-Si eutectic took place under an almost constant temperature of about 569 ºC and
the rate of evolution of FS was linear. For example, at 50% progression of the Al-Si eutectic reaction, the overall FS in the investigated alloy was about 64% (including both primary and eutectic Si) (see Table 2).
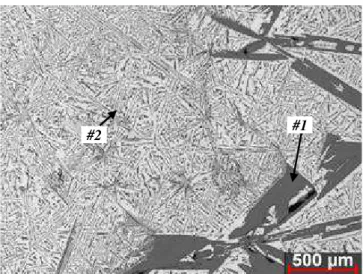
Metallographic observations of the binary Al-19%Si test sample that solidified under an
average cooling rate of 0.5 ºC/s revealed coarse, unrefined primary Si and unmodified
Al-Si eutectic (see Figure 6). The length of the primary Al-Si crystals was found to be up to 500 µm. It was observed that the microstructure of such a slowly solidified test sample was highly heterogeneous, caused by the lack of primary Si refinement and the tendency of primary Si to float due to its lower density.
3.2. Phase Diagram Calculations for the Solidification Process
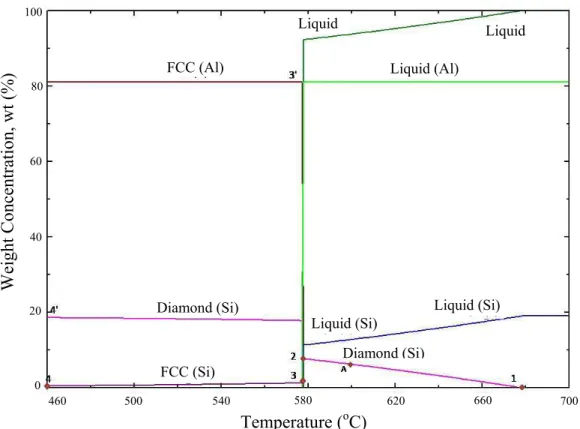
FactSage [10] thermodynamic calculations reveal that the thermodynamic liquidus
temperature, manifested by nucleation of primary Si (diamond-phase), is at 677 oC with
corresponding 0% fraction solid (Figure 7, point #1). Using Scheil’s approximation, the
volume fraction of primary Si at 595 oC is approximately 5% (Figure 7, point #A) and
evolves to approximately to 7.7% at the eutectic formation temperature of 578 oC (Figure
7, point #2).
Aluminum crystals (FCC-Face Centered Cubic phase) evolve during eutectic formation
that starts at 578 oC and consists of FCC aluminum (Figure 7, point #3') as well as solid
solution of Si in FCC Al (Figure 7, point #3). Concentration of FCC Si gradually reduces
FCC Si transforms from the Al-Si solid solution into the diamond phase (Figure 7, point #4').
In overall, the findings from FactSage calculations were in good agreement with thermal analysis experiments (Figures 5 and 7). As it will be shown further, these findings are also in a good agreement with results of neutron diffraction studies.
3.3. Neutron Diffraction during the Solidification Process
The neutron diffraction experiment began with a no-sample furnace set-up to retrieve the “background” present in all measurements. For the selected neutron wavelength, several diffraction peaks observed in the “background” pattern can be attributed to various crystallographic planes reflections of titanium and steel used to build the solidification cell. Subtraction of the background data from the original raw-data patterns collected for the set-up with the sample metal typically results in a clearer “sample-only” diffraction pattern.
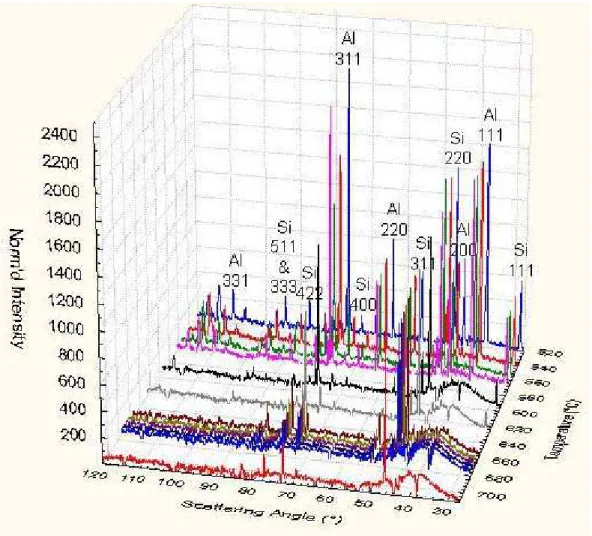
Figure 8 presents diffraction patterns received throughout the experiments as the Al-19%Si melt temperature was reduced in the stepwise mode from 710, 677, 672, 667, 662,
655, 625, 595, 565, 555, 540, and finally, to 520 ºC. As expected, no new peaks were
observed in the pattern received for the molten alloy at temperatures above 710 ºC, but
the diffraction intensity through the entire range of the scattering angle was increased due
to inelastic (or liquid diffuse) scattering in the melt. The curved shape of the 710 ºCline
(as compared, for example, to the 520 ºCline) suggests that it represents a pattern
received for a liquid sample [16]. Other diffraction patterns in Figure 8 show peaks that represent diffraction by several crystallographic planes of the solid Al and/or Si crystals through the solidification interval. This clearly confirmed the presence of two major phase constituents, i.e., primary Si and Al-Si eutectic as already shown in thermal
analysis experiments (Figure 5) and FactSage calculations (Figure 7). Integrated intensity
of the peaks received at 520 ºC represents 100% fraction solid (FS).
Analysis of the diffraction pattern for the Al-19%Si melt at 710 ºC appears to indicate
0.154 nm the diffraction peak on Figure 8 that exists at about 46 degrees can be
attributed to the 220 reflection of Si. It is to be noted that 710 ºC is about 38 ºC higher
than the liquidus temperature established from the thermal analysis experiments and 33
º
C higher than predicted from the thermodynamic calculation. Similar observations were
made in the previous studies [15] for Si 111 peak that was recorded 23oC above liquidus
and were possibly related to presence of silicon clusters. It was concluded in this study that such clusters were expected to be small, likely several nm in length. These should show up as very broad peaks, not sharp Bragg peaks. Yet the “primary” peaks observed appear to be fairly narrow, which may indicate that primary Si forms in clusters
(agglomerates) of a significant size. Further in-depth experiments are needed to confirm and explain these observations.
Analysis of neutron diffraction data showed in Figure 8 also revealed detectable
scattering intensity from following crystallographic planes Al 111, 200, 220, 311 and 331
recorded for temperature range between 667 to 655oC (Figure 8). This could indicate that
α-Al crystals nucleated prior to Al-Si eutectic, which contradicts the existing paradigm that α-Al starts to nucleate simultaneously with Si while forming eutectic phase at
approximately 569oC (Figures 5 and 7). Aluminum phase was not detected at 625 and
595oC that indicates that nucleation started at 667 was discontinued at 625oC and
re-started again at the Al-Si eutectic temperature (~569oC). Microstructural analysis of
components made from the hypereutectic Al-Si alloys cast using permanent die casting technology typically shows randomly distributed α-Al dendrites as presented in Figure 2. Up to date traditional techniques such as thermal analysis or rapid melt quenching are not capable to detect premature nucleation of α-Al crystals.
Based on the intensity of various diffraction peaks relative to the peak intensity at 520 ºC,
the FS of a specific phase in the melt at the given temperature could be subsequently quantified. Correspondingly, by collecting the diffraction patterns for the semisolid alloy for various temperatures within the solidification interval, one can retrieve valuable information on the dynamics of non-equilibrium solidification; for example, FS of Al and FS of Si vs. temperature of the melt.
3.4 Analysis of Fraction Liquid using Neutron Diffraction
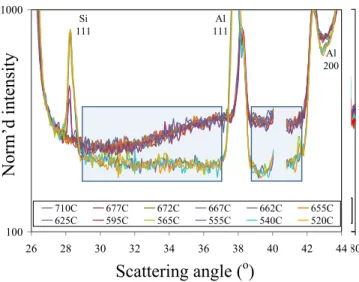
Direct fitting of Gaussian functions into the diffraction peaks during solid phase analysis ignores the sample background underlying these peaks. However the sample background contains valuable information that can be extracted. It was reported [16] that there is decrease in the background intensity underlying the solid phase peaks, corresponding to the reduction in scattering from the liquid phase, as it transforms to solid. A correction was required to account for the drop in the level underneath the peaks that would cause a systematic understatement of the solid phase content as a function of temperature. This also implies that, if care is taken, then neutron diffraction is capable of simultaneously being an independent monitor of the proportions of both liquid melt and solid inside the solidifying test sample. Figure 9 shows the diffraction patterns received for the Al-19%Si
alloy at temperatures between 710 to 520 oC. There is a clear difference in the intensity
of the background signal for all between-the-peaks areas that originates from the reduction in fraction liquid in the course of alloy solidification. Thus it is possible to separate melt and solid scattering. This separation is done by performing an integration of scattering intensity over the range in which the change in the scattering pattern is only due to the change in the proportion of liquid [16]. The regions of the diffraction pattern immediately beyond the solid-alloy peaks can therefore be used as an indicator of liquid content in the sample volume. Two such regions are identified in Figure 9 from 29 to about 42 degrees of the scattering angle. Normalization was done in such a way that the initial liquid content at 710 ºC was 100%, and the liquid content at 520 ºC was 0%. The results of this analysis are shown in Figure 10, along with two lines that represent the non-equilibrium solidus and liquidus temperatures determined from the thermal analysis carried out during the Al-19%Si binary alloy solidification process (see Figure 5 and Table 2).
It can be seen that all three curves obtained from the neutron data analysis are in reasonably good agreement. The fraction liquid is about 97~95% at about 10 ºC below the non-equilibrium liquidus temperature, and most of the solid phase evolves at the later
stage of solidification. It can be concluded from Figure 10 and Figure 5c that most of eutectic phase evolves between about 569 ºC and 560 ºC, and down to 543 ºC.
3.5 Analysis of Fraction Solid using Neutron Diffraction
Figures 11 (a) and (b) depict the Si 111 and Al 220 peak evolution over the solidification interval between 710 and 520 ºC. The integral intensity of the diffraction peaks is clearly increasing as each peak becomes higher and wider. The angular position of the peaks also changes as the temperature decreases corresponding to thermal contraction of the solid metal (i.e., a reduction in the lattice plane spacing reflected by the shift in Bragg’s peak position). Similar to the liquid phase analysis, by performing a simple integration of the peak’s normalized intensity over the angular range that covers the width of the peak, one can retrieve the relative FS for the selected temperatures within the solidification interval of the alloy. The basic approach taken in this study was to prorate the integral
intensity from zero at 0% solid (above Tliquidus) to 1 at 100% solid (below Tsolidus).
Figure 12a beside Solid Analysis (i.e., cumulative Si+Al) presents selected fraction solid data received from the Liquid Analysis (as FS = 1 - FL). The Al-19%Si alloy
solidification range and FS vs. temperature curve determined by thermal analysis are also marked on the graph. The good correlation between neutron results from Solid and Liquid analysis is clearly visible and follows the fraction solid development as derived from thermal analysis experiments.
The results of separate Solid Analysis calculations performed for the integrated signal from Si and Al are presented in Figure 12b together with fraction solid curve from thermal analysis. An important observation from Figure 12b is that solid Si starts evolving in the melt sooner than solid Al, which is in agreement with the solidification
sequence for the studied alloy. The presence of Si crystals was detected at 662oC that was
10oC below the liquidus temperature (FSSi about 3%) and rapidly evolved to
approximately 20% at the Al-Si eutectic nucleation temperature, i.e., 568.9oC.
On the other hand, solid Al evolves very slowly as the metal temperature decreases,
visible on thermal analysis curves [4, 5]. Aluminum nucleation accelerates rapidly at
temperatures of 565 oC (FSAl about 91%) reaching its maximum at the solidus
temperature (543oC). This observation corresponds well with the earlier results of
thermal analysis (see Figure 5) and liquid phase analysis (see Figure 10), which indicated
that most of the alloy solidifies as eutectic within the temperature range of 570-560 oC,
followed by the end of solidification at about 543 oC.
Moreover, Figure 12b shows clearly the individual fraction solid of Al and Si during solidification process. This is typically not achievable when using conventional thermal analysis techniques. The good precision of this technique is confirmed by the point A marked at the Solid Analysis (Si) line in Figure 12b. This point of ~4.5% fraction solid
received for Si at 595 oC coincides well with the value received earlier in the FactSage
calculations (point A in Figure 7).
Regardless of the “classical” use of neutron diffraction for studies of solid metals in metallurgical research, the results presented show the potential of applying neutron diffraction for high resolution analysis of liquid and semi-solid alloy. It will be
particularly interesting to explore further the pre-mature nucleation of α-Al prior Al-Si
eutectic, since neutron data revealed Al signal above the eutectic nucleation temperature established by thermal analysis. Moreover, the clustering of Si atoms prior to the start of the solidification process is not fully understood and requires further clarification, since it significantly affects primary Si size and distribution in cast components. This
understanding can result in new characterization capabilities for detailed studies of grain refining, eutectic modification, etc. This outcome will contribute to better understanding of the solidification behaviour of the Al-Si hypereutectic alloys during casting processes such as HPDC, LPPM and sand casting.
4. CONCLUSIONS
The following characteristics of the Al-19%Si binary alloy solidification process were revealed in this research based on neutron diffraction and thermal analysis:
1. Thermal analysis revealed the liquidus temperature at 672 oC followed by nucleation
of Al-Si eutectic at 569 oC and completion of solidification process at 543 oC resulting
in alloy solidification range of 129 oC.
2. Thermal analysis and microstructural evaluation also revealed that the growth of
fraction solid as a function of temperature is linear up to 20.5%. This fraction solid
corresponds to a temperature of about 569 oC, at which the Al-Si eutectic begins to
nucleate. Most of the solid phase evolves as eutectic at the last stage of solidification
within a very short temperature range below 569 oC.
3. Neutron diffraction indicated that there is solid Si present above the non-equilibrium
liquidus temperature of 672 oC and could indicate the agglomeration of Si clusters in
the melt.
4. There was an indication of presence of solid Al at 667~672 oC in the neutron
diffraction data that is significantly above the Al-Si eutectic nucleation temperature. The Al fraction solid at these temperatures was detected at about 1.0~1.5%. The
solid-aluminum scattering, however, disappears at lower temperatures (655 to 595 oC).
5. It was confirmed that the intensity of neutron scattering by the liquid metal can be
used as an independent indicator of fraction liquid in the melt, while integral intensity of the diffraction peaks can be used for evaluation of fraction solid in the melt.
6. Fraction solid analysis by neutron diffraction showed that individual fractions of Al
and Si during solidification process could be determined. That is not feasible when using conventional thermal analysis techniques.
ACKNOWLEDGEMENTS
The authors would like to thank Renata Zavadil B. Sc. Eng. and Marta Aniolek M. Sc. Eng. from CANMET-MTL for assistance with for metallographic work and cooling curve analysis. The authors would like to acknowledge the support of the Advanced Structural Materials for Next Generation Vehicles (ASM-NGV) Program of Natural Resources Canada. The work at ORNL's High Flux Isotope Reactor was sponsored by the Scientific User Facilities Division, Office of Basic Energy Sciences, U. S.
Department of Energy. U.S. DOE. ORNL is operated by UT-Battelle, LLC for the U.S. DOE under Contract No. DE-AC05-00OR22725. Studies completed at the Canadian Neutron Beam Center were partially sponsored by grant from Natural Sciences and Engineering Research Council of Canada.
REFERENCES
[1] J. L. Jorstad, “The Progress of 390 Alloy: From Inception until Now”, AFS
Transactions, 2009, 241-249.
[2] Y. P. Telang, “Process Variables in Al-21Si Alloys Refinement”, AFS
Transactions, vol. 71, 232-240 (1963).
[3] W. Kasprzak, J. H. Sokolowski, H. Yamagata, M. Sahoo, H. Kurita, “The Effect
of the Melt Temperature and the Cooling Rate on the Microstructure of the Al-20%Si Alloy used for Monolithic Engine Blocks”, International Journal of Metalcasting, vol. 3, Issue 3, Summer 2009, 55-73.
[4] H. Yamagata, H. Kurita, M. Aniolek, W. Kasprzak, J. H. Sokolowski, “Thermal
and Metallographic Characteristics of the Al-20%Si High-Pressure Die-Casting Alloy for Monolithic Cylinder Blocks,” Journal of Materials Processing
Technology, vol. 199, no. 1-3, 84-90 (2008).
[5] H. Yamagata, W. Kasprzak, M. Aniolek, H. Kurita, J. H. Sokolowski, “The
Effect of Average Cooling Rates on the Microstructure of the Al-20%Si High Pressure Die Casting Alloy used for Monolithic Cylinder Blocks”, Journal of Materials Processing Technology, vol. 203, 333-341 (2008).
[6] J. L. Jorstad, D. Apelian, “Hypereutectic Al-Si Alloys: Practical Casting Considerations”, International Journal of Metalcasting, vol. 3, Issue 3, Summer 2009, 13-43.
[7] G. I. Eskin, D. G. Eskin, “Some Control Mechanism of Spatial Solidification in
Light Alloys”, Zeitschrift fur Metallkunde, vol. 95, no. 8 (2004).
[8] W. Wang, X. Bian, J. Qin, S. Syliusarenko, “The Atomic-Structure Changes in
Al-16 Pct Si Alloy above the Liquidus“, Metall. Mater. Trans. A 31 (9), 2163– 2168, 2000.
[9] M. Kasprzak, W. Kasprzak, W. T. Kierkus, J. H. Sokolowski, (U.S. Patent No.
7,354,491) (Canadian Patent No. 2,470,127).
[10] http://www.factsage.com.
[11] D. Sediako, W. MacDonald, S. Hibbins, “Mould Thermal Analysis in
Direct-Chill Casting of Magnesium Alloys”, The Minerals, Metals & Materials Society, TMS, New Orleans, LA, March 2008, Magnesium Technology 2008, 215-219.
[12] K. Nogita, A. K. Dahle, “Eutectic Solidification in Hypoeutectic Al–Si Alloys:
Electron Backscatter Diffraction Analysis”, Materials Characterization, 46 (2001) 305-310.
[13] N. Iqbal, N.H. van Dijk, V.W.J. Verhoeven, W. Montfrooij, T. Hansen, L.
Katgerman, G.J. Kearley, “Experimental Study of Ordering Kinetics in
Aluminum Alloys during Solidification”, Acta Materialia 51 (2003) 4497-4504.
[14] N. Iqbal, N.H. van Dijk, V. W .J. Verhoeven, T. Hansen, L. Katgerman, G. J.
Kearley, “Periodic Structural fluctuations during the Solidification of Aluminum Alloys Studied by Neutron Diffraction”, Materials Science and Engineering A 367 (2004) 82-88.
[15] W. Kasprzak, D. Sediako, M. Sahoo, M. Walker, I. Swainson, “Characterization
of Hypereutectic Al-19%Si Alloy Solidification Process using In-Situ Neutron Diffraction and Thermal Analysis Techniques”, Proceedings of TMS 2010, Supplemental Proceedings: Volume 1, Materials Processing and Properties, pp. 93-104.
[16] I. P. Swainson, E. M. Schulson, “A Neutron Diffraction Study of Ice and Water
within a Hardened Cement Paste during Freeze-Thaw”, Cement and Concrete Research, 31, 2001, 1821-1830.
Figure 2. LOM micrograph (100x) of the hypereutectic cylinder block from Figure 1. Note the primary Si crystals (#1 dark) with an average ED of 20.6±5.9μm and the non-equilibrium α aluminum dendrites (#2 grey) [5].
Figure 1. Cross-section of the motorcycle engine with 250
cm3 water-cooled cylinder block (#1) made from the
hypereutectic DiASilTM alloy
(Al-20%Si-3.5%Cu-0.5%Mg) using the vacuum assisted HPDC process (Photo: Courtesy of Yamaha Motor Co. Ltd.).
#1
#1 #2
Table 1. Average Chemical Composition of the Hypereutectic Al-19%Si Alloy (wt%). Si Cu Mg Fe Mn P 19.1 0.01 0.01 0.1 0.01 <0.01
Fig. 4. Schematic drawing of the solidification cell used for neutron diffraction experiments. The major system components are as follows:
#1: Aluminum vacuum chamber. #2: Tungsten heater.
#3: Titanium tubing.
#4: Stainless steel crucible for analyzed material housing.
a)
Figure 3. a) Overall view of the NRU nuclear reactor site at Chalk River, Ontario, Canada,
b)
Fig. 4. Schematic drawing of the solidification cell used for neutron diffraction experiments. The major system components are as follows:
#1: Aluminum vacuum chamber. #2: Tungsten heater.
#3: Titanium tubing.
#4: Stainless steel crucible for analyzed material housing.
Figure 5. Cooling curve analysis results obtained for Al-19%Si binary alloy solidified at
an average cooling rate of about 0.5 oC/s.
a) Temperature vs. time curve.
b) First derivative (dT/dt) vs. temperature curve. c) Fraction solid vs. temperature curve.
Note: The numbered arrows correspond to the metallurgical reactions and are outlined in Table 2. The corresponding microstructure is presented in Figure 6.
0 0.2 0.4 0.6 0.8 1 540 560 580 600 620 640 660 Temperature (oC) -3.5 -3 -2.5 -2 -1.5 -1 -0.5 0 0.5 540 560 580 600 620 640 660 680 700 First Deriva tive (dT/d t) ( o C/s) Temperature (oC) #1 #2 #4 Time (s) Tem p er at ur e ( o C) #1 #2 #4 #3 a) b) c) Fraction Solid #2 #4 #1 #3 400 450 500 550 600 650 700 750 800 0 100 200 300 400 500 #1 #2 #4 #3
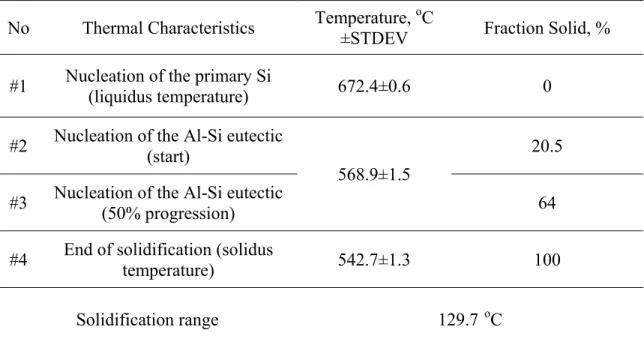
Table 2. Non-Equilibrium Thermal Characteristics of the Al-19%Si Binary Alloy
Obtained during the Solidification Process.
No Thermal Characteristics Temperature,
o
C
±STDEV Fraction Solid, %
#1 Nucleation of the primary Si
(liquidus temperature) 672.4±0.6 0
#2 Nucleation of the Al-Si eutectic
(start)
568.9±1.5
20.5
#3 Nucleation of the Al-Si eutectic
(50% progression) 64
#4 End of solidification (solidus
temperature) 542.7±1.3 100
Figure 6. Optical micrographs (50x) of the Al-19%Si binary alloy test sample solidified
at an average cooling rate of about 0.5 oC/s. Note unrefined primary Si crystals up to 500
μm long (#1) and unmodified Al-Si eutectic (#2).
Figure 7. Al-19%Si binary alloy phase (FactSage Software). The liquidus (677oC)
and Al-Si eutectic nucleation (578oC) temperatures corresponds with data
obtained from thermal analysis experiments (see Table 2).
100 80 60 40 20 0 Weight Concentration, wt (%) 460 500 540 580 620 660 700 Diamond (Si) Diamond (Si)
FCC (Al) Liquid (Al)
Liquid Liquid Liquid (Si) Liquid (Si) FCC (Si) Temperature (oC)
Figure 8. Neutron diffraction pattern of the Al-19%Si binary alloy solidification
process collected at various temperatures, ranging from 710 oC (38 oC above the
equilibrium liquidus temperature) to 520 oC (23 oC below the solidus
temperature). Note that the wave length employed in the experiments was 0.154 nm.
100 1000
20 30 40 50 60 70 80
710C 677C 672C 667C 662C 655C
625C 595C 565C 555C 540C 520C
Figure 9. Neutron diffraction pattern collected during the Al-19%Si binary alloy solidification process. Selected no-peak areas were used for the fraction liquid analysis.
100 1000 26 28 30 32 34 36 38 40 42 44 710C 677C 672C 667C 662C 655C 625C 595C 565C 555C 540C 520C Al 111 Si 111 Al 200 Scattering angle (o) Norm’d in te nsity
Figure 10. Fraction liquid curve obtained from neutron diffraction analysis of the Al-19%Si binary alloy solidification process.
0.0 0.2 0.4 0.6 0.8 1.0 540 560 580 600 620 640 660 680 700 720 740 Fraction Liquid (FL) Temperature (oC)
Solidification range from TA
Figure 11. Diffraction intensity change in the neutron diffraction experiments recorded
during the Al-19%Si binary alloy solidification process between 740 and 400 oC, for the
following phases: a) Silicon 111, b) Aluminum 220.
Norm’d In te nsity Scattering Angle (o) a) b) 200 300 400 500 600 700 800 900 1000 1100 63.4 63.6 63.8 64 64.2 64.4 710C 677C 672C 667C 662C 655C 625C 595C 565C 555C 540C 520C Aluminum 220 200 300 400 500 600 700 800 900 27.5 27.75 28 28.25 28.5 28.75 29 710C 677C 672C 667C 662C 655C 625C 595C 565C 555C 540C 520C Silicon 111
Figure 12. Fraction solid evolution obtained during neutron diffraction and thermal analysis of the Al-19%Si binary alloy solidification process.
a) Neutron diffraction data from i) Solid Analysis (Al 111, 200, 220, 311 + Si 111, 311, 511 and 333 reflections), ii) Liquid Analysis (background signal), iii) thermal analysis. Note good correlation between presented results.
b) Neutron data from Solid Analysis for i) integrated signal from Si (111, 311, 511, and 333 planes), ii) integrated signal from Al (111, 200, 220 and 311 planes), iii) thermal analysis. Note that neutron data provides specific content of Al and Si phases at given temperature during solidification process.
0.0 0.1 0.2 0.3 0.4 0.5 0.6 0.7 0.8 0.9 1.0 540 560 580 600 620 640 660 680 700 720 740 Neutron - Solid Analyis (Al) Neutron - Solid Analysis (Si) Thermal Analysis (Al+Si)
b) Fraction Solid (FS) Temperature (oC) A a) Fraction Solid (FS) Temperature (oC)
Solidification range from TA
Solidus Liquidus 0.0 0.1 0.2 0.3 0.4 0.5 0.6 0.7 0.8 0.9 1.0 540 560 580 600 620 640 660 680 700 720 740 Neutron - Solid Analysis Neutron - Liquid Analysis Thermal Analysis