13 © The Author 2014. Published by Oxford University Press on behalf of the European Orthodontic Society. All rights reserved.
For permissions, please email: [email protected]
Original article
Assessing the length of the mandibular ramus
and the condylar process: a comparison of
OPG, CBCT, CT, MRI, and lateral cephalometric
measurements
Goran Markic
*
,†, Lukas Müller
*
,†, Raphael Patcas
*
, Malgorzata Roos
**
,
Nina Lochbühler
***
, Timo Peltomäki
****
, Christoph A. Karlo
***
,*****
,
Oliver Ullrich
******
and Christian J. Kellenberger
***
*Clinic for Orthodontics and Paediatric Dentistry, Center of Dental Medicine, University of Zurich, Zurich, Switzerland, **Division of Biostatistics, ISPM, University of Zurich, Switzerland, ***Department of Diagnostic Imaging, University Children’s Hospital, Zurich, Switzerland, ****Dental and Oral Diseases Outpatient Clinic, Oral and Maxillofacial Unit, Tampere University Hospital and Department of Otolaryngology, University of Tampere, Finland, *****Institute of Diagnostic and Interventional Radiology, University Hospital Zurich, Switzerland, ******Institute of Anatomy, Faculty of Medicine, University of Zurich, Switzerland
†These authors contributed equally to the accomplishment of the manuscript.
Correspondence to: Goran Markic, Clinic for Orthodontics and Pediatric Dentistry, Center of Dental Medicine, University of Zurich, Plattenstrasse 11, 8032 Zurich, Switzerland. E-mail: [email protected]
Summary
Background/Objectives: To compare different imaging procedures [cone beam computed
tomography (CBCT), computed tomography (CT), magnetic resonance imaging (MRI), orthopantomography (OPG), and lateral cephalometry (LC)] for assessing the mandibular height [ramus height (RH)] and condylar process (CondProc) length as they reflect mandibular growth.
Materials/Methods: The RH and CondProc of eight cadaver heads (each side separately) were
measured using CBCT, CT, MRI, OPG, and LC. They were measured twice by two independent observers parallel to the posterior border of the mandibular ramus. An intraclass correlation coefficient (ICC) was used to assess the inter- and intraobserver reliability. The coefficient of variation was used to elucidate precision. Bland–Altman (BA) plots were used to assess the agreement between the procedures and the intra- and interobserver measurements.
Results: All procedures, with the exception of LC, showed good intra- and interobserver agreement
(maximum range of agreement: 5.3 mm) and excellent reliability (ICC > 0.9). The BA plot analysis for the CondProc and RH showed similar ranges of agreement between MRI, CT, and CBCT (maximum 6.4 mm) but higher ranges for OPG and LC. The MRI and OPG values were generally smaller.
Conclusions/Implications: All 3D imaging procedures yielded nearly equal results when used to
measure the CondProc and RH. MRI is recommended because it avoids ionizing radiation and has higher sensitivity in the detection of inflammation. A 2-year threshold for detecting growth in the follow-up period should be taken into account for all 3D imaging methods. Measuring the RH is recommended for the follow-up of condylar growth because reference values for annual increments are published.
doi:10.1093/ejo/cju008 Advance Access publication 25 August 2014
Introduction
The condylar cartilage is a major growth site of the mandible, which makes it a crucial factor for treatment success in young orthodontics patients. Changes in the lengths of the mandibular ramus and con-dylar process (CondProc) either reflect mandibular growth (1–4) or pathological processes in the temporomandibular joint (TMJ) (5).
Juvenile idiopathic arthritis (JIA) is the most common rheumatic disease in childhood (6), with a prevalence of 1 in 1000 children worldwide (7). Thus, most orthodontic practices can expect to encounter a JIA patient every 3–4 years. JIA can severely damage all involved joints and can cause short- and long-term disabilities (8). All synovial joints, including the TMJ, can be affected (9–12, 5). The rate of TMJ involvement in patients with JIA varies from 17 to 87 per cent depending on the examination method and the population being studied (10, 13, 14). Recent studies based on magnetic reso-nance imaging (MRI) have shown TMJ involvement rates of 63–75 per cent, and these results were usually found in patients without clinical symptoms (15, 16).
TMJ arthritis leads to both masticatory dysfunction and man-dibular growth disturbances (17–21), resulting in craniofacial dys-morphology and dental malocclusion (22–25), including posteriorly rotated retrognathic mandibles with overall small dimensions, usually in combination with a dental angle Class II/1 with increased overjet and an anterior open bite (21, 23, 26–28). Unilateral TMJ arthritis occurs at a rate of 40–50 per cent (9, 11) and can result in facial and dental asymmetries (11, 29) that increase with longer disease dura-tions (11, 29–32). Because TMJ arthritis shows few or no clinical symptoms, orthodontists may be the first to detect JIA and subse-quently take part in the interdisciplinary treatment of these patients.
Condylar growth is an important indicator for therapeutic suc-cess. It has recently been shown that not only inflammatory pro-cesses but also some treatment strategies, such as intra-articular corticosteroid injections, may potentially reduce or stop condylar growth (33). The CondProc and ramus heights (RHs) of JIA patients have been measured using different radiographic techniques (30, 33– 36), all of which expose patients to ionizing radiation. Computed tomography (CT) is considered to be the gold standard for bony measurements but involves the highest radiation exposure, which should be avoided in growing individuals due to the increased risk of developing cancer (37–42).
MRI, however, does not expose patients to ionizing radiation and is considered to be the gold standard for the early diagnosis of TMJ arthritis and deformation with high sensitivity compared to radiog-raphy (16, 43, 44), making it an adequate tool for both the initial assessment and follow-up of children with JIA, especially because these patients show few or no clinical symptoms.
The aim of this study was to compare the following imaging procedures for measuring the lengths of the mandibular ramus and CondProc: cone beam computed tomography (CBCT), CT, MRI, orthopantomography (OPG), and lateral cephalometry (LC). Our hypothesis was that MRI is an adequate method to replace radio-graphic procedures for RH and CondProc measurements.
Materials and methods
Materials
Eight intact cadaveric human heads (five women, three men; age range 65–95 years) were acquired through a voluntary body dona-tion program of the local anatomical institute on the basis of informed consent in accordance with state and federal regulations,
the Convention on Human Rights and Medicine (45), and the rec-ommendation of the National Academy of Medical Science. Within 4 days after death, perfusion of the cadaveric heads was performed with a fixation liquid consisting of two parts alcohol (70 per cent), one part glycerine, and 2 per cent almudor (containing 8.1 per cent formaldehyde, 10 per cent glyoxal, and 3.7 per cent glutaraldehyde). Image data acquisition
For each cadaveric head, digital CBCT, CT, MRI, and OPG data sets were obtained, and an analogue lateral cephalogram was taken. If necessary, the procedure was repeated until good quality was achieved.
The CT data were obtained on a commercially available 40-detector-row CT system (Brilliance CT 40, Philips Healthcare, Eindhoven, the Netherlands) with the following scan parameters, which were identical for all specimens and correspond to typical clinical settings: tube voltage, 120 kV; tube current time product, 70 mAs; slice collimation, 20 × 0.625 mm; pitch, 0.68; reconstruction slice thickness, 0.67 mm; reconstruction increment, 0.33 mm; win-dow level setting, 2000/500 HU; voxel size, 0.39 mm (x), 0.39 mm (y), and 0.67 mm (z); exposition time, 4.5 seconds; and the bone window device preset.
The CBCT data were acquired using a KaVo 3D eXam (KaVo Dental AG, Brugg, Switzerland) with the following scan param-eters: tube current, 5 mA; tube voltage, 120 kV; field of view (FOV), 100 mm, landscape mode; reconstruction slice thickness, 0.4 mm; reconstruction increment, 0.4 mm; isotropic voxel size, 0.4 mm (x, y, z); exposition time, 4 seconds; and the window settings were auto-matically adjusted by the device. These settings are also routinely used and show a good balance between exposure to ionizing radia-tion, image quality, and resolution for this field of view size.
Each TMJ MRIs was performed on a commercially available 1.5 Tesla scanner (Signa HDx, General Electric, Milwaukee, Wisconsin, USA) with a commercially available TMJ surface coil. Sagittal oblique T1-weighted 3D fast-spoiled gradient echo sequences were acquired separately for each side (i.e. left and right) parallel to the respective mandibular ramus with the following imaging parameters: flip angle, 20 degrees; repetition time, 11.6 ms; echo time, 4.1 ms; bandwidth, 15.63 kHz; number of excitations, 3; FOV, 10 cm2; matrix, 256 × 192;
slice thickness, 2 mm; spacing, 1 mm; and the window settings were automatically adjusted by the device.
The OPG was produced using Cranex 3+ (SOREDEX, Tuusula, Finland) with the following settings: tube current, 6 mA; tube volt-age, 65 kV; exposition time, 20 seconds at 50 Hz; inherent filtration, 1.8 mm Al; and total filtration, 2.7 mm Al.
The lateral cephalograms were taken on a custom-made X-ray unit (COMET, 3175 Flamatt, Switzerland) with the following set-tings: tube current, 250 mA; tube voltage, 67 kV; tube current time product, 10 mAs; and exposition time, 0.04 seconds. The position of the head with the Frankfort plane parallel to the floor was fixed using ear rods and a nasal pointer. The focus–median plane distance was 200 cm, and the film–median plane distance was 15 cm (7.5 per cent enlargement).
Image data analysis
From the 3D data sets (CT, CBCT, and MRI), projection images of the mandibular ramus and condyle were reconstructed with commer-cially available image processing software using maximum-intensity projection for the CT and CBCT data and minimum-intensity pro-jection for the MRI data. The orientation of the propro-jection images was standardized to intersect the centre of the CondProc, the
coronoid process, and the gonial angle (Figure 1). The slice thick-ness was defined as the smallest thickthick-ness of the most cranial con-dylar point, the most caudal gonial point, and the deepest point of the incisura mandibulae (Figure 1). The resulting projection images, as well as the unchanged 2D image of the OPG, were analysed on a high-resolution diagnostic workstation (dx IDS5, Sectra PACS, Linköping, Sweden).
The analogue lateral cephalograms were hand traced using a 0.3 mm lead on a sheet of 0.10 mm matte acetate tracing paper.
An example of the right side of the same specimen in all imaging methods is shown in Figure 2.
Two observers traced the LCs and obtained and measured the projection images (CK and NL for MRI and CT; LM and GM for CBCT and LC). Each measurement was performed twice with an interval of at least 3 weeks to minimize the learning effect. The observers were blinded for all other first and second tracings, images, and measurements.
Measurements
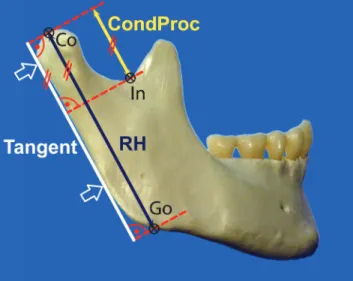
For every image and every side, three points (Co, Go, and In) were defined, and two linear measurements were performed parallel to the tangent at the posterior border of the ramus (Figure 3):
Ramus height: Measured parallel to the tangent at the posterior border of the ramus between the most cranial point of the condyle (Co) and the intersection point with the lower border of the ramus mandibulae [the gonial point (Go)]. The intersection with the lower border of the ramus mandibulae was obtained using a line parallel to the tangent at the posterior border of the ramus that ran through the most cranial point of the condyle (Co). Height of the CondProc: Measured parallel to the tangent at the posterior border of the ramus between the most cranial point of the condyle (Co) and the most caudal point of the incisura mandibulae (In).
The calibration, construction of reference lines, landmark definition, and distance measurements of all CBCT, CT, MRI, and OPG images were performed digitally.
The same construction lines and landmarks were defined on the LC tracings. The landmarks on LC were digitized using the tablet digitizer NumonicsAccuGrid (Numonics, Landsdale, Pennsylvania, USA) with a resolution of 1 mil. The distances were computed and corrected for enlargement using Excel 2010 (version 14.0.6112.5000, Microsoft, Redmond, Washington, USA).
Statistical analysis
The standard statistical software packages SPSS version 20.0.0 (Chicago, Illinois, USA), STATA version 10.1 (College Station, Texas, USA), and MedCalc version 12.2.1.0 (64 bit; Mariakerke, Belgium) were used for statistical analysis. To assess and compare the preci-sion of the measurements, the coefficient of variation was separately computed for the RH and CondProc. The formula of the CoeffVar was CoeffVar = SD/mean.The computation of the means and SD were based on the four linear measurement values (two measure-ments by each of the two observers).
The descriptive statistics for the CoeffVar with respect to the RH and CondProc were computed separately. The CoeffVar estimates for each imaging method were visualized by means of box plots. The Shapiro–Wilk and Kolmogorov–Smirnov tests were used to check normality assumptions. Differences in the mean CoeffVar between imaging methods were assessed using one-way analysis of variance with Scheffé post hoc after log-transformation to ensure a normal distribution. Differences between the RH and CondProc were sepa-rately evaluated using a two-sample t-test for each imaging method. To quantify the agreement between the imaging methods and the intra- and interobserver measurements for each measurement type, Bland–Altman plots (BA plots) (46, 47) with 95 per cent limits of agreement extended by a 95 per cent confidence interval for differ-ences between the means (paired t-test) were computed. Additionally, to facilitate interpretation, the ranges for the 95 per cent limits of agree-ment (upper–lower) were provided. All values (two measureagree-ments from each observer) were used in the assessment of agreement between the imaging methods. This method resulted in 64 values (left and right sides together) per linear measurement (RH and CondProc separately) with the exception of the LC values. Because the left and right side could not be distinguished for LC, the mean of the left and right side values were taken, resulting in only 32 values per measurement type. Measurements on the left and right side were considered to be independent.
Figure 1. Example of a 3D computed tomography data set visualized using maximum-intensity projection and multiplanar reformatting with three orthogonal
planes (a–c). The orientation of slice (c), used for the linear measurements, was standardized to intersect the centre of the coronoid process (1), the condylar process (2), and the gonial angle (3). The thickness (4) of the slice (c) was defined as the smallest thickness at which the most cranial condylar point (5), the most caudal gonial point (6), and the deepest point of the incisura mandibulae (7) were included.
The intra- and interobserver reliability were assessed using an intraclass correlation coefficient (ICC) based on the separate results of the procedure ‘xtreg’ in STATA for each imaging method.
Results of the statistical analysis with P-values less than 0.05 were considered to be statistically significant.
Results
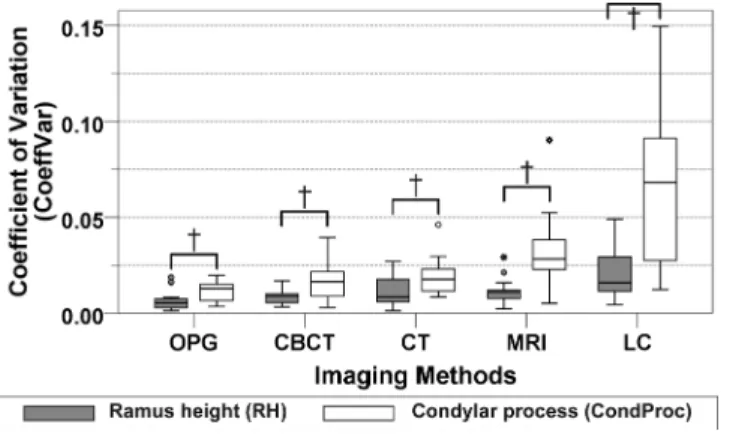
Measurement precision [judged in terms of CoeffVar for both meas-urements (RH and CondProc)] showed the highest precision for OPG followed, in descending order, by CBCT, CT, MRI, and LC (Table 1 and Figure 4). For the RH, only LC was significantly less precise, and for the CondProc, both LC and MRI were significantly less precise (Table 1). LC was significantly less precise than MRI for the CondProc measurements.
The precision, judged in terms of the intra- and interobserver agreement (Table 1 and Supplementary Figures 1 and 2), showed significant differences in the mean for only the interobserver
values of LC (RH: 1.2 mm and CondProc: 1.4 mm) and CT (RH only: 0.5 mm). The interobserver ranges of agreement were in gen-eral larger than the intraobserver ranges of agreement. However, this was not always the case, and the differences were not large (≤1.2 mm), with the exception of the LC values for the RH (2.8 mm). The ranges of agreement were generally smaller (mean: −1.2 mm) for CondProc than for RH, with the exception of the interobserver MRI and LC. The intraobserver agreement for the RH for the 3D imaging methods showed similar ranges of agreement at 4.1 mm or less, with differences of 0.4 mm or less between the ranges. For the 3D imaging methods, the interobserver agreement for the RH was below 5.3 mm, with differences of 0.5 mm between CT and MRI and 1.5 mm between CBCT and CT.
The intra- and interobserver reliability (Table 1) showed excel-lent agreement (ICC > 0.90) for all procedures with the exception of LC. The highest ICC values were computed for OPG, which was closely followed by CBCT, CT, and MRI. The ICC values for the CondProc and interobserver ICC were generally smaller. The LC
Figure 2. Example of the right side of the same specimen for all imaging methods. CBCT, cone beam computed tomography; CT, computed tomography; LC,
values for the CondProc (intraobserver ICC: 0.79, interobserver ICC: 0.59) and interobserver ICC for the RH (0.82) were far below those of all other methods.
The agreement between imaging methods, judged in terms of a BA plot analysis (Table 2 and Supplementary Figure 3), showed similar ranges of agreement between MRI, CT, and CBCT for the CondProc and RH: MRI and CT RH (6.0 mm) and CondProc (2.3 mm), MRI and CBCT RH (5.9 mm) and CondProc (6.0 mm), and CT and CBCT RH (6.4 mm) and CondProc (5.2 mm). The MRI and OPG measure-ments for the RH and CondProc were significantly smaller than the
measurements obtained using all other imaging methods. The OPG measurements were significantly smaller than those obtained via MRI. The mean differences between the MRI and CT measurements (MRI minus CT) were −1.4 mm for the RH and −1.2 mm for the CondProc. The mean differences between the MRI and CBCT measurements (MRI minus CBCT) were −1.9 mm for the RH and −1.1 mm for the CondProc. OPG and LC showed the least agreement for measurements based on the 3D data sets and showed the widest limits of agreement.
Discussion
The aim of the study was to determine if MRI could adequately replace radiographic procedures for the assessment of mandibular growth. Our results show that measurements of the mandibular ramus and CondProc with MRI are comparable to those of CT and CBCT in terms of precision, intra- and interobserver reliability, and agreement. For JIA patients with TMJ arthritis, we therefore suggest using MRI to quantitatively follow condylar growth by measuring the RH and CondProc length, which are important indicators for long-term therapeutic success (2, 3, 13, 15, 48). Using only MRI for the follow-up of children with JIA could reduce costs and avoid exposure to ionizing radiation, which can potentially harm growing children (41, 42). Our results are in concordance with a recently published study observing equally and highly precise quantitative measurements via MRI, CT, and CBCT (49).
When following growth longitudinally, the measurement preci-sion defines the threshold for growth detection. The gold standard would be to compare the measurements of the various imaging methods with the anatomical truth. The resulting limits of agree-ment could be used to define the threshold for detecting growth in 95 per cent (±1.96 SD) of the cases. However, the construction and measurement protocols are difficult to simulate on an anatomical specimen, thus complicating the acquisition of comparable meas-urements. Additionally, specimen measurements also have limits of agreement. Therefore, when defining a threshold for the detection Table 1. Descriptive statistics (mean ± SD, 95% CI) of the CoeffVar for both linear measurements (RH and CondProc) and all imaging
methods. CBCT, cone beam computed tomography; CI, confidence interval; CondProc, condylar process; CT, computed tomography; ICC, intraclass correlation coefficient; LC, lateral cephalometry; MRI, magnetic resonance imaging; OPG, orthopantomography; RH, ramus height; SD, standard deviation
CoeffVar Bland–Altman analysis ICC
Mean ± SD
95% CI
Intraobserver Interobserver Intraobserver Interobserver
Lower Upper RH OPG 0.007a ± 0.005 0.004 0.010 0.2 (2.8: 1.6, −1.3) 0.1 (2.5: 1.3, 1.2) 0.99 0.99 CBCT 0.009a ± 0.004 0.007 0.011 −0.1 (3.7: 1.8, −1.9) −0.1 (3.3: 1.6, −1.7) 0.99 0.99 CT 0.011a,b ± 0.008 0.007 0.016 0.3 (3.7: 2.2, −1.5) 0.5* (4.8: 2.9, −1.9) 0.98 0.97 MRI 0.012a,b ± 0.007 0.008 0.016 0.1 (4.1: 2.1, −2.0) 0.2 (5.3: 2.9, −2.4) 0.95 0.92 LC 0.021b ± 0.014 0.014 0.028 −0.4 (6.1: 2.7, −3.4) 1.2* (8.9: 5.6, −3.3) 0.93 0.82 CondProc OPG 0.012a ± 0.005 0.009 0.014 0.0 (1.0: 0.5, −0.5) 0.1 (1.3: 0.7, −0.6) 0.99 0.99 CBCT 0.017a ± 0.011 0.011 0.023 −0.1 (2.2: 1.0, −1.2) −0.1 (1.8: 0.8, −1.0) 0.98 0.98 CT 0.019a,b ± 0.010 0.014 0.024 0.2 (1.9: 1.1, −0.8) 0.0 (2.5: 1.2, −1.3) 0.98 0.97 MRI 0.033b,c ± 0.019 0.023 0.043 0.1 (4.1: 2.2, −1.9) 0.0 (4.0: 2.0, −2.0) 0.93 0.93 LC 0.065c ± 0.039 0.044 0.086 0.0 (6.9: 3.5, −3.4) 1.4* (7.9: 5.3, −2.6) 0.79 0.59
Distinct letters (a, b, c) indicate significant differences of imaging methods according to Scheffé post hoc test. P-values from analysis of variance showed P < 0.001. Bland–Altman analysis shows mean differences (mm), range of 95% limits of agreement (mm), and 95% limits of agreement (mm) for intra- and inter-observer agreement per imaging method. ICC shows intra- and interinter-observer reliability per measurement type and imaging procedure.
*Significant intra- and interobserver differences of mean according to paired t-test (P < 0.05).
Figure 3. The constructions and both linear measurements [ramus height
(RH) and condylar process (CondProc)] were performed parallel to the tangent at the posterior border of the ramus: RH: Measured between the most cranial point of the condyle (Co) and the intersection point with the lower border of the ramus (Go). CondProc: Measured between the most cranial point of the condyle (Co) and the most caudal point of the incisura mandibulae (In).
of longitudinal changes, the precision judged in terms of intra- and interobserver limits of agreement is most accurate.
For all 3D imaging methods (CT, CBCT, and MRI), the intra- and interobserver range of agreement was similar, with a maximum range of agreement of 5.3 mm. In a growing individual, an uncertainty of 5.5 mm corresponds to at least 2 years of growth when assuming a mean condylar growth of 2 –3 mm per year (1, 50). Therefore, a longitudinal follow-up of at least 2 years for all 3D imaging methods is necessary for conclusive information about condylar growth. In JIA cases, MRI has two main advantages over radiologic procedures. The first is that MRI does not expose patients to ionizing radiation; the second is that MRI shows high sensitivity for the detection of inflammation (16, 43, 44). When comparing the BA plots from dif-ferent imaging methods, the range of agreement of all 3D imaging methods (CT, CBCT, and MRI) was similar, with a maximum range of agreement of 6.4 mm. This range is only insignificantly wider than the corresponding intra- and interobserver measurements. It should be noted that all four measurements (two measurements from each observer) have been included in the BA plot analysis. This approach enabled the inclusion of the entire variation, thus making the limits of agreement wider and depicting a more realistic situation in which measurements were performed by multiple raters.
Measurements made with MRI were generally smaller than those made with CT (RH: −1.4 mm; CondProc: −1.2 mm) or CBCT (RH: −1.9 mm; CondProc: −1.1 mm). This difference should be taken into consideration when MRI measurements are compared with data and reference values based on other imaging procedures (30,
33–36). Therefore, these imaging methods (CT, CBCT, and MRI) are interchangeable but not directly comparable without correcting for length differences. Due to the different mode of operation and data acquisition, MRI depicts different structures than the 3D radio-graphic methods (CT and CBCT) (51).
Bone remodelling should be taken into consideration when measuring the RH and CondProc. Bone remodelling occurs both at the gonial angle and the incisura mandibulae and affects both the RH and CondProc. The RH as an outcome parameter may mimic condylar growth due to appositional processes at the gonial angle. JIA patients with TMJ arthritis often show a growth pattern with posterior rotation, which is associated with bony apposition at the gonial angle and antegonial notching (27, 28, 52). Therefore, the differences in the RH should be interpreted with caution. Similarly, the measuring of the CondProc is influenced not only by condy-lar growth but also by the physiological bony apposition at the incisura mandibulae (1, 52, 53). Nevertheless, annual increments
Figure 4. CoeffVar box plots for both measurements (ramus height and condylar process) and all imaging methods. The bottom and top lines of the box indicate
the first and third quartiles (25 and 75%), and the band inside the box indicates the second quartile (50%, the median). Therefore, the box height represents the interquartile range (IQR). The ends of the whiskers represent the lowest value within 1.5 IQR below the first quartile and the highest value within 1.5 IQR above the third quartile. The values between the 1.5 and 3 IQR (below the first and above the third quartile) are indicated by small circles, whereas the values outside of this range are defined as extreme outliers and are indicated by small asterisks. †Significant differences according to a two-sample t-test.
Table 2. Mean differences (upper value minus left value; mm), range of 95% limits of agreement (mm), and 95% limits of agreement (mm)
for CondProc (upper right) and RH (lower left). CBCT, cone beam computed tomography; CondProc, condylar process; CT, computed to-mography; LC, lateral cephalometry; MRI, magnetic resonance imaging; OPG, orthopantoto-mography; RH, ramus height
CondProc RH OPG CBCT CT MRI LC OPG 3.1* (8.3: 7.3, −1.0) 3.2* (5.9: 6.2, 0.3) 2.1* (6.4: 5.3, −1.1) 4.1* (7.6: 7.9, 0.3) CBCT −6.6* (7.5: −2.8, −10.3) 0.1 (5.2: 2.7, −2.5) −1.1* (6.0: 1.9, −4.1) 1.0* (6.5: 4.2, −2.3) CT −6.1* (6.5: −2.8, −9.3) 0.5* (6.4: 3.7, −2.7) −1.2* (2.3: 0.4, −2.7) 0.9* (6.3: 4.0, −2.3) MRI −4.3* (5.0: −1.8, −6.8) 1.9* (5.9: 4.8, −1.1) 1.4* (6.0: 4.4, −1.6) 2.0* (6.9: 5.5, −1.4) LC −6.6* (6.4: −3.4, −9.8) 0.0 (9.3: 4.6, −4.7) −0.5 (9.4: 4.2, −5.2) −2.5* (6.8: −0.9, −5.9)
for the RH from 3 to 16 years have been published for girls (2) and boys (3) and clearly demonstrate that growth is measurable using the RH. To the knowledge of the authors, reference values for the CondProc have not yet been published in the literature.
Although OPG provides the best precision and most reliable data, it shows poor agreement with the 3D procedures (CT, CBCT, and MRI). The cause for this discrepancy is most likely due to the study protocol and demonstrates a limitation of our study. All 2D images and 3D data sets were generated only once, and all further processing was based on these data. Therefore, technically speaking, the measurement was per-formed twice on the same image (and 2D and 3D data sets) and not on the same ramus or condyle. However, for the 3D imaging and lateral cephalometric images, the positioning of the specimen has very little effect. However, the OPG is highly sensitive to positioning issues that can lead to the magnification of errors and disproportional enlarge-ment (54–59). Vertical measurements appear to be more accurate than horizontal or angular measurements. However, vertical measurements remain prone to misrepresenting the anatomical truth (60). In our study, the position of the specimen in the OPG machine was adjusted until images of good quality were produced. Therefore, constructions and landmark definitions unambiguously led to very high precision and reliability. Although this limitation due to positioning is a weak-ness of this study, it shows that this portion of the protocol (measuring the same image or data set twice) can be performed with very high precision and reproducibility. However, when assessing the agreement between the OPG and 3D imaging measurements, the distortion/posi-tioning issue became evident, and the agreement was poor (the widest limits of agreement). Moreover, all measurements were significantly smaller. Additionally, variation in the magnification between the OPG devices is also a known issue (60). The variation due to repeated posi-tioning and picture recording could not be evaluated with our study protocol. Unfortunately, when the OPG data were evaluated, the speci-mens had already been dissected for further investigations and were therefore no longer usable for a repeated OPG study.
The lateral cephalogram measurements showed the worst results for precision, and these results were statistically and clinically signifi-cant. The intra- and interobserver reliability were far below those for all other imaging methods, especially for the CondProc. The limits of agreement showed a highly heterogeneous picture with frequently very wide limits of agreement with the 3D imaging methods. In con-trast with the 3D imaging techniques, the lateral cephalogram is a classical 2D radiograph in which the 3D structures are projected onto a 2D plane. This method makes it difficult and often nearly impossi-ble to distinguish between sides and complicates landmark definitions due to overprojecting structures. This problem is especially true for the condylar point and the deepest point of the incisura mandibulae.
A limitation of our study is the small sample size. Because the voluntary body donation programme of the local university has limited material and provides preparations for various teaching and research projects, no more than eight unmitigated cadaveric heads could be obtained for our study. However, although the power of the study may be reduced, the results provided are conclusive for the hypothesis tested.
Conclusions
1. All 3D imaging procedures were nearly equal in their ability to measure the CondProc and RH, with differences in agreement and precision below clinical relevance. MRI is recommended not only because it is a comparable alternative for CT and CBCT but also because it avoids ionizing radiation and has higher
sensitiv-ity in the detection of inflammation (16, 43, 44), which is espe-cially important for JIA patients.
2. The maximum range of the limits of agreement for all 3D imag-ing procedures for the RH and CondProc corresponds to approxi-mately the length difference of the average condylar growth over a period of 2 years (1, 50, 53). Therefore, a 2-year threshold for detecting growth in the follow-up should be taken into considera-tion for all 3D imaging methods.
3. Because reference values for annual increments are published for the RH (3, 2) but not for the CondProc, the RH is recommended for following up condylar growth.
4. The MRI measurements were generally smaller than those obtained via CT and CBCT, which makes them not directly com-parable. This difference should be taken into consideration when comparing MRI to data based on other imaging procedures. 5. The susceptibility of OPG to head positioning leads to poor
agreement with the 3D imaging procedures, and the overall poor results of LC make it impossible to accurately and reliably meas-ure the RH and CondProc using this method.
Supplementary material
Supplementary material is available at European Journal of Orthodontics online.
References
1. Buschang, P.H., Santos-Pinto, A. and Demirjian, A. (1999) Incremental growth charts for condylar growth between 6 and 16 years of age. Euro-pean Journal of Orthodontics, 21, 167–173.
2. Tracy, W.E. and Savara, B.S. (1966) Norms of size and annual increments of five anatomical measures of the mandible in girls from 3 to 16 years of age. Archives of Oral Biology, 11, 587–598.
3. Savara, B.S. and Tracy, W.E. (1967) Norms of size and annual increments for five anatomical measures of the mandible in boys from three to sixteen years of age. Archives of Oral Biology, 12, 469–486.
4. Riolo, M.L. and Michael, L. (1974) Atlas of Craniofacial Growth Cepha-lometric Standards from the University School Growth Study. University of Michigan, Center for Human Growth and Development, Ann Arbor, MI.
5. Pirttiniemi, P., Peltomaki, T., Muller, L. and Luder, H.U. (2009) Abnor-mal mandibular growth and the condylar cartilage. European Journal of Orthodontics, 31, 1–11.
6. Gare, B.A. (1996) Epidemiology of rheumatic disease in children. Current Opinion in Rheumatology, 8, 449–454.
7. Schneider, R. and Passo, M.H. (2002) Juvenile rheumatoid arthritis. Rheu-matic Disease Clinics of North America, 28, 503–530.
8. Weiss, J.E. and Ilowite, N.T. (2005) Juvenile idiopathic arthritis. Pediatric Clinics of North America, 52, 413–442.
9. Pedersen, T.K., Jensen, J.J., Melsen, B. and Herlin, T. (2001) Resorption of the temporomandibular condylar bone according to subtypes of juvenile chronic arthritis. The Journal of Rheumatology, 28, 2109–2115. 10. Ronning, O., Valiaho, M.L. and Laaksonen, A.L. (1974) The involvement
of the temporomandibular joint in juvenile rheumatoid arthritis. Scandi-navian Journal of Rheumatology, 3, 89–96.
11. Twilt, M., Mobers, S.M., Arends, L.R., ten Cate, R. and van Suijlekom-Smit, L. (2004) Temporomandibular involvement in juvenile idiopathic arthritis. The Journal of Rheumatology, 31, 1418–1422.
12. Still, G.F. (1897) On a form of chronic joint disease in children. Medico-Chirurgical Transactions, 80, 47–60.9.
13. Kuseler, A., Pedersen, T.K., Herlin, T. and Gelineck, J. (1998) Contrast enhanced magnetic resonance imaging as a method to diagnose early inflammatory changes in the temporomandibular joint in children with juvenile chronic arthritis. The Journal of Rheumatology, 25, 1406– 1412.
14. Mayne, J.G. and Hatch, G.S. (1969) Arthritis of the temporomandibular joint. Journal of the American Dental Association, 79, 125–130. 15. Weiss, P.F., Arabshahi, B., Johnson, A., Bilaniuk, L.T., Zarnow, D., Cahill,
A.M., Feudtner, C. and Cron, R.Q. (2008) High prevalence of temporo-mandibular joint arthritis at disease onset in children with juvenile idi-opathic arthritis, as detected by magnetic resonance imaging but not by ultrasound. Arthritis & Rheumatism, 58, 1189–1196.
16. Muller, L., Kellenberger, C.J., Cannizzaro, E., Ettlin, D., Schraner, T., Bolt, I.B., Peltomaki, T. and Saurenmann, R.K. (2009) Early diagnosis of tem-poromandibular joint involvement in juvenile idiopathic arthritis: a pilot study comparing clinical examination and ultrasound to magnetic reso-nance imaging. Rheumatology, 48, 680–685.
17. Stabrun, A.E. (1991) Impaired mandibular growth and micrognathic development in children with juvenile rheumatoid arthritis. A longitudi-nal study of lateral cephalographs. European JourA longitudi-nal of Orthodontics, 13, 423–434.
18. Ronning, O., Barnes, S.A., Pearson, M.H. and Pledger, D.M. (1994) Juve-nile chronic arthritis: a cephalometric analysis of the facial skeleton. Euro-pean Journal of Orthodontics, 16, 53–62.
19. Kjellberg, H. (1995) Juvenile chronic arthritis. Dentofacial morphology, growth, mandibular function and orthodontic treatment. Swedish Dental Journal Supplement, 109, 1–56.
20. Ronchezel, M.V., Hilario, M.O., Goldenberg, J., Lederman, H.M., Faltin, K., Jr, de Azevedo, M.F. and Naspitz, C.K. (1995) Temporomandibular joint and mandibular growth alterations in patients with juvenile rheuma-toid arthritis. The Journal of Rheumatology, 22, 1956–1961.
21. Bache, C. (1964) Mandibular growth and dental occlusion in juvenile rheumatoid arthritis. Acta Rheumatologica Scandinavica, 10, 142–153. 22. Karhulahti, T., Ylijoki, H. and Ronning, O. (1993) Mandibular condyle
lesions related to age at onset and subtypes of juvenile rheumatoid arthri-tis in 15-year-old children. Scandinavian Journal of Dental Research, 101, 332–338.
23. Larheim, T.A. and Haanaes, H.R. (1981) Micrognathia, temporoman-dibular joint changes and dental occlusion in juvenile rheumatoid arthritis of adolescents and adults. Scandinavian Journal of Dental Research, 89, 329–338.
24. Ronning, O. and Valiaho, M.L. (1981) Progress of mandibular condyle lesions in juvenile rheumatoid arthritis. Proceedings of the Finnish Dental Society, 77, 151–157.
25. Svensson, B., Larsson, A. and Adell, R. (2001) The mandibular condyle in juvenile chronic arthritis patients with mandibular hypoplasia: a clini-cal and histologiclini-cal study. International Journal of Oral and Maxillofacial Surgery, 30, 300–305.
26. Barriga, B., Lewis, T.M. and Law, D.B. (1974) An investigation of the dental occlusion in children with juvenile rheumatoid arthritis. The Angle Orthodontist, 44, 329–335.
27. Jamsa, T. and Ronning, O. (1985) The facial skeleton in children affected by rheumatoid arthritis--a roentgen-cephalometric study. European Jour-nal of Orthodontics, 7, 48–56.
28. Kreiborg, S., Bakke, M., Kirkeby, S., Michler, L., Vedtofte, P., Seidler, B. and Moller, E. (1990) Facial growth and oral function in a case of juvenile rheumatoid arthritis during an 8-year period. European Journal of Ortho-dontics, 12, 119–134.
29. Karhulahti, T., Ronning, O. and Jamsa, T. (1990) Mandibular condyle lesions, jaw movements, and occlusal status in 15-year-old children with juvenile rheumatoid arthritis. Scandinavian Journal of Dental Research, 98, 17–26.
30. Kjellberg, H., Fasth, A., Kiliaridis, S., Wenneberg, B. and Thilander, B. (1995) Craniofacial structure in children with juvenile chronic arthritis (JCA) compared with healthy children with ideal or postnormal occlusion. American Journal of Orthodontics and Dentofacial Orthopedics, 107, 67–78.
31. Stabrun, A.E., Larheim, T.A., Hoyeraal, H.M. and Rosler, M. (1988) Reduced mandibular dimensions and asymmetry in juvenile rheumatoid arthritis. Pathogenetic factors. Arthritis & Rheumatism, 31, 602–611. 32. Twilt, M., van der Giesen, E., Mobers, S.M., ten Cate, R. and van
Suijlekom-Smit, L.W. (2003) Abrupt condylar destruction of the mandibula in juvenile idiopathic arthritis. Annals of the Rheumatic Diseases, 62, 366–367.
33. Stoustrup, P., Kristensen, K.D., Kuseler, A., Gelineck, J., Cattaneo, P.M., Pedersen, T.K. and Herlin, T. (2008) Reduced mandibular growth in experimental arthritis in the temporomandibular joint treated with intra-articular corticosteroid. European Journal of Orthodontics, 30, 111–119. 34. Twilt, M., Schulten, A.J., Nicolaas, P., Dulger, A. and van Suijlekom-Smit,
L.W. (2006) Facioskeletal changes in children with juvenile idiopathic arthritis. Annals of the Rheumatic Diseases, 65, 823–825.
35. Stoustrup, P., Kuseler, A., Kristensen, K.D., Herlin, T. and Pedersen, T.K. (2013) Orthopaedic splint treatment can reduce mandibular asymmetry caused by unilateral temporomandibular involvement in juvenile idi-opathic arthritis. European Journal of Orthodontics, 35, 191–198. 36. Kjellberg, H., Ekestubbe, A., Kiliaridis, S. and Thilander, B. (1994)
Condy-lar height on panoramic radiographs. A methodologic study with a clinical application. Acta Odontologica Scandinavica, 52, 43–50.
37. Einstein, A.J. (2012) Effects of radiation exposure from cardiac imaging: how good are the data? Journal of the American College of Cardiology, 59, 553–565.
38. Preston, D.L., et al.et al. (1994) Cancer incidence in atomic bomb survi-vors. Part III. Leukemia, lymphoma and multiple myeloma, 1950-1987. Radiation Research, 137, 68–97.
39. Cardis, E., et al.et al. (2005) Risk of cancer after low doses of ionising radiation: retrospective cohort study in 15 countries. BMJ, 331, 77. 40. Boice, J.D., Jr, Preston, D., Davis, F.G. and Monson, R.R. (1991) Frequent
chest X-ray fluoroscopy and breast cancer incidence among tuberculosis patients in Massachusetts. Radiation Research, 125, 214–222.
41. Pearce, M.S., et al.et al. (2012) Radiation exposure from CT scans in childhood and subsequent risk of leukaemia and brain tumours: a retro-spective cohort study. The Lancet, 380, 499–505.
42. Claus, E.B., Calvocoressi, L., Bondy, M.L., Schildkraut, J.M., Wiemels, J.L. and Wrensch, M. (2012) Dental x-rays and risk of meningioma. Can-cer, 118, 4530–4537.
43. Kuseler, A., Pedersen, T.K., Gelineck, J. and Herlin, T. (2005) A 2 year fol-lowup study of enhanced magnetic resonance imaging and clinical exami-nation of the temporomandibular joint in children with juvenile idiopathic arthritis. The Journal of Rheumatology, 32, 162–169.
44. Pedersen, T.K., Kuseler, A., Gelineck, J. and Herlin, T. (2008) A prospec-tive study of magnetic resonance and radiographic imaging in relation to symptoms and clinical findings of the temporomandibular joint in chil-dren with juvenile idiopathic arthritis. The Journal of Rheumatology, 35, 1668–1675.
45. Council of Europe (2002) Additional Protocol to the Convention on Human Rights and Biomedicine Concerning Transplantation of Organs and Tissues of Human Origin Strasbourg, 24.1.2002. Council of Europe, Strasbourg, France.
46. Bland, J.M. and Altman, D.G. (1986) Statistical methods for assessing agreement between two methods of clinical measurement. The Lancet, 1, 307–310.
47. Bland, J.M. and Altman, D.G. (1999) Measuring agreement in method comparison studies. Statistical Methods in Medical Research, 8, 135– 160.
48. Abramowicz, S., Cheon, J.E., Kim, S., Bacic, J. and Lee, E.Y. (2011) Magnetic resonance imaging of temporomandibular joints in children with arthritis. Journal of Oral and Maxillofacial Surgery, 69, 2321– 2328.
49. Gaudino, C., Cosgarea, R., Heiland, S., Csernus, R., Beomonte Zobel, B., Pham, M., Kim, T.S., Bendszus, M. and Rohde, S. (2011) MR-Imaging of teeth and periodontal apparatus: an experimental study comparing high-resolution MRI with MDCT and CBCT. European Radiology, 21, 2575–2583.
50. Bjork, A. (1968) The use of metallic implants in the study of facial growth in children: method and application. American Journal of Physical Anthropology, 29, 243–254.
51. Gore, J.C., Emery, E.W., Orr, J.S. and Doyle, F.H. (1981) Medical nuclear magnetic resonance imaging: I. Physical principles. Investigative Radiol-ogy, 16, 269–274.
52. Bjork, A. and Skieller, V. (1983) Normal and abnormal growth of the mandible. A synthesis of longitudinal cephalometric implant studies over a period of 25 years. European Journal of Orthodontics, 5, 1–46.
53. Bjork, A. (1963) Variations in the growth pattern of the human mandible: longitudinal radiographic study by the implant method. Journal of Dental Research, 42, 400–411.
54. McDavid, W.D., Tronje, G., Welander, U. and Morris, C.R. (1981) Effects of errors in film speed and beam alignment on the image layer in rotational pano-ramic radiography. Oral Surgery, Oral Medicine, Oral Pathology, 52, 561–564. 55. Updegrave, W.J. (1971) Visualizing the mandibular ramus in panoramic
radiography. Oral Surgery, Oral Medicine, Oral Pathology, 31, 422–429. 56. Yeo, D.K., Freer, T.J. and Brockhurst, P.J. (2002) Distortions in panoramic
radiographs. Australian Orthodontic Journal, 18, 92–98.
57. Habets, L.L., Bezuur, J.N., van Ooij, C.P. and Hansson, T.L. (1987) The orthopantomogram, an aid in diagnosis of temporomandibular joint
problems. I. The factor of vertical magnification. Journal of Oral Reha-bilitation, 14, 475–480.
58. Schulze, R., Krummenauer, F., Schalldach, F. and d’Hoedt, B. (2000) Pre-cision and accuracy of measurements in digital panoramic radiography. Dentomaxillofacial Radiology, 29, 52–56.
59. Schulze, R., Schalldach, F. and d’Hoedt, B. (2000) Effect of positioning errors on magnification factors in the mandible in digital panorama imag-ing. Mund-, Kiefer- und Gesichtschirurgie, 4, 164–170.
60. Van Elslande, D.C., Russett, S.J., Major, P.W. and Flores-Mir, C. (2008) Mandibular asymmetry diagnosis with panoramic imaging. American Journal of Orthodontics and Dentofacial Orthopedics, 134, 183–192.