Functional magnetic resonance imaging is a non-invasive method for the detection of focal brain activity at high spatial resolution. Acoustic stimulation leads to a blood oxygenation level dependent signal change in the plane of the superior temporal gyrus. The dependence of this response in the auditory cortex on binaural, monaural left and monaural right acoustic stimulation for 10 healthy subjects and five monaural deaf patients is described. Acoustic stimulation consists of 1000 Hz pulsed sine tones at a pulse rate of 6 Hz and a sound pressure level of 95 dB. For monaural stimulation, normal-hearing subjects revealed a strong lateralization of cortical response towards the contralateral hemisphere. The lateralization ratios between left and right hemispheric response areas were 3.4–5.2 for monaural stimulation and nearly balanced for binaural stimulation. Additionally, the sum of cortical activation volumes induced by monaural left and right stimulation was∼30% smaller than for binaural stimulation, indicating either inhibitory mechanisms or neuronal facilitation within the auditory pathways. For monaural deaf subjects the lateralization ratio between left to right response was just 1.3 towards the contralateral hemisphere of the healthy ear, which is comparable to binaural responses of normal-hearing subjects. This observation seems to indicate a plasticity or a reorganization of auditory pathways of monaural deaf patients.
Introduction
In the early 1920s, Boring proposed that each ear may be represented in the auditory cortex by different populations of cortical units (see Boring, 1926). This hypothesis was sub-sequently confirmed by a number of neuroimaging techniques that compared the effects of bilateral, contralateral and ipsilateral auditory stimulation. Evoked potential studies as well as magnetoencephalography (MEG) techniques demonstrated that bilateral stimulation in man produced a larger evoked response in a given hemisphere than ipsilateral or contralateral stimulation (Tiihonen et al., 1989; Di and Barth, 1993; Kelly and Judge, 1994; Loveless et al., 1994).
Anatomical and autoradiographic studies also demonstrated that neurons of the auditory pathways cross to the contralateral hemisphere at the level of the brainstem (Fitzpatrick and Imig, 1980; Zenner, 1994), suggesting a transmission of electrical potentials caused by monaural left acoustic stimulation to the right hemisphere and vice versa. This basic principle of cross-linking is also known for the sensomotoric and visual system and for somatosensoric perception. Due to the existence of both crossing and non-crossing fibers in the ascending pathways of the mammalian auditory system, its representation in the sensory cortex is not nearly as contralateral as in vision and touch. The extent of auditory processing contralaterality on healthy humans and monaural deaf patients has not been well quantified to date. We have therefore investigated the response of the auditory cortex of normal-hearing and monaural deaf subjects on binaural and monaural acoustic stimulation with functional magnetic resonance imaging (fMRI).
fMRI is a new non-invasive method for brain mapping using the paramagnetic and diamagnetic properties of deoxyhemo-globin and oxyhemodeoxyhemo-globin respectively. The basic principle of this method is the blood oxygenation level dependent (BOLD) signal change. Focal neuronal activation within the cerebral cortex leads to an increase in regional cerebral blood f low which entails an increase in the concentration of oxyhemoglobin in the capillaries and venous system (Fox and Raichle, 1984, 1986). Because of the diamagnetic properties of oxyhemoglobin the decreased magnetic susceptibility will increase the signal intensity in T2*-weighted MR images. This BOLD signal change
can thus be detected with high-resolution T2*-sensitive MRI
(Ogawa et al., 1990; Bandettini et al., 1992; Frahm et al., 1993). fMRI studies of the auditory system are hampered by technical difficulties since the acoustic stimulus is superimposed on the noise of the MRI scanner. In particular, rapid echo planar imaging (EPI) sequences, which are characterized by an extremely fast switching of gradients, produce a high sound level of∼90 dB SPL (Sound Pressure Level) inside the scanner (Hedeen and Edelsrein, 1997). The use of EPI sequences is, however, mandatory for a comprehensive analysis of the whole auditory cortex in order to obtain high-resolution, T2*-weighted
multislice images.
In order to minimize the acoustic disturbance induced by the MR scanner we have developed a measuring protocol consisting of a short scanning period of 1.8 s and a long rest period of 13.2 s (Bilecen et al., 1996). A minimum rest period of
∼10 s was established in control experiments to guarantee a reproducible quantitative excitation in consecutive paradigms. A pneumatic sound system was used to deliver the pulsed sine tone stimuli for bi- and monaural excitation. The stimulus paradigm consisted of alternating ON–OFF cycles.
The purpose of this study was twofold: firstly, we measured and quantified the activation of the primary auditory cortex with BOLD fMRI for binaural, monaural left and monaural right acoustic stimulation of 10 healthy volunteers. Secondly, we investigated five monaural deaf patients. A significant difference in the activation pattern of monaural deaf patients and monaurally stimulated volunteers was detected which might indicate a plastic reorganization of the auditory cortex or a modification of the central part of the auditory pathways. Materials and Methods
Subjects
Ten healthy volunteers (two female, eight male) aged between 21 and 32 years were assessed. Threshold audiometry and neurological exam-inations revealed normal findings. Eight out of 10 volunteers were right-handed. The subjects were recruited on a voluntary basis and gave written consent. In addition, five monaural deaf patients were examined. All patients revealed a complete hearing loss on one side. The cause of the unilateral deafness was congenital in two patients and acquired due to
Auditory Cortical Responses in Hearing
Subjects and Unilateral Deaf Patients as
Detected by Functional Magnetic
Resonance Imaging
K. Scheff ler, D. Bilecen, N. Schmid1, K. Tschopp1and J. Seelig
MR Center and Biocenter, University of Basel,
Klingelbergstrasse 70, 4056 Basel and1ENT Department, Kantonsspital Liestal, 4410 Liestal, Switzerland
infection, sudden hearing loss and postoperative deafness in one patient each. The duration of the unilateral deafness was 6 weeks in the patient with sudden hearing loss, and several years in all other patients with acquired hearing loss.
MRI Measurements
A ll anatomical and functional data were acquired on a 1.5 T Siemens VISION scanner using a standard CP-head coil. In a first step 10 slices of
T1-weighted images (TE= 14 ms, TR= 300 ms) were measured in sagittal
orientation. This imaging series was used to visualize the anterior and posterior commissure of the brain, a landmark for the further positioning of the functional imaging slices and the corresponding anatomical,
T1-weighted images. For functional imaging, a single shot gradient
recalled, echo planar sequence (EPI) with a decreasing excitation order was used, allowing the acquisition of nine slices within 1.8 s. The slice thickness was 4 mm and hence the nine slices covered a slab of 3.6 cm in cranio-caudal extension. The echo time TEwas adjusted to 70 ms and the
acquisition of the nine slices was repeated every 15 s. The rectangular field of view was 211 × 250 mm at a matrix size of 108 × 128 pixels. The pixel volume therefore was 1.95 × 1.95 × 4.0 mm or 15.2 mm3. The functional EPI slices were positioned such that the seventh EPI slice (numbered superior to inferior) cut through the anterior and posterior commissure (AP-plane).
Acoustic Stimulation and Scanning Procedure
The subject was placed in supine position in the MR magnet with eyes closed and the light in the scanner room extinguished. The head was tightly fixed with two stabilizers on both temporal sides of the skull. The proper positioning of the headphones was checked prior to scanning by determining the hearing threshold. Acoustic stimulation was generated by a pulsed sine tone of 1000 Hz recorded on a digital audio tape. The sine tone was gated with a rate of 6 Hz. A piezoelectric sound transmitter mounted at the bottom of the patient table was used as acoustic source. The sound was conducted via a plastic tube of 9 mm diameter to a combination of insert earphones and headphones. At a distance of 0.5 m from the acoustic source the plastic tube was split with a Y-connector into two tubes of 1.5 m length each, ending in two headphones. The two tubes had exactely the same length to prevent phase shifts and amplitude differences between the right and left headphone. Oscillographic measurements showed minimal distortion of the signals by the pneumatic system. Unilateral left and unilateral right stimulation was achieved by disconnecting the corresponding tube from the Y-connector and replacing it with a dummy tube of the same length. However, a complete isolation of the unilateral acoustic stimulus to the contralateral ear was not possible. For instance, weak cortical activation could be detected when stimulating the completly deaf ear of a patient. Residual transmission of sound via bone conduction prevents stimuli from being completely shielded from the other ear.
In contrast to visual or sensomotoric stimulation, auditory stimulation requires the attenuation of the scanner noise as much as possible. As verified in control experiments, the sound and vibration of the rapidly swiched gradients cannot be totally supressed by head phones. We therefore introduced a resting period of 13.2 s between consecutive scans to significantly reduce the scanner duty cycle and to decrease the background noise-to-sound ratio.
The mean stimulus amplitude of the acoustic sound was 95 dB SPL at the distal end of the pneumatic system as verified by sound pressure measurements. The background scanner noise due to gradient switching was∼90 dB SPL (Hedeen and Edelsrein, 1997), attenuated by headphones and earplugs by∼25 dB SPL. The mean background noise remained constant during both the OFF (baseline) and the ON (activation) periods. During the acoustic stimulation paradigm a series of 315 echo planar images was acquired within the OFF–ON cycle paradigm (OFF– ON–OFF–ON–OFF–ON–OFF) as depicted in Figure 1. In the OFF period, no acoustic stimulation was presented and subjects were only exposed to the attenuated scanner noise. The corresponding images were used as control (baseline) images. During the ON period the pulsed sine tone was presented and activation images were acquired simultaneously. Within each ON or OFF period five image series with nine slices each were collected. The time span between consecutive image series was 15 s and
the complete paradigm therefore lasted 8 min 45 s. The complete measuring session consisted of a binaural, an unilateral right and an unilateral left acoustic stimulation. The order of stimulation paradigms was fixed for all subjects. Between consecutive stimulation paradigms a resting period of 2 min was introduced. The total session, including
T1-weighted images, lasted for∼40 min.
Data Analysis
The stimulation-induced signal change in T2*-weighted EPI sequences
amounts to∼2–8% of the total signal intensity. Several statistical methods are available to detect such small changes and to correlate them with the stimulation pattern. We used the t-test analysis (Bronstein and Semendjajew, 1979) to calculate the functional activation map, a method similar to the correlation technique proposed by Bandettini et al. (1993). A t-test was carried out on each pixel within the nine functional slices. To differentiate between activated and non-activated pixels a significant threshold of t > 3.5 was used, corresponding to a significance level of P < 0.001. In addition, a clustering algorithm was applied on the resulting activation pattern which rejects stand-alone pixels. Activation volumes were calculated by counting all significant pixels within the right and left hemisphere and multiplying the result by the pixel volume of 15.2 mm3.
fMRI data sets are ver y sensitive to head movements, cardiac and respirator y movements as well as to inf low artifacts caused by large vessels (Frahm et al., 1994). The latter can be excluded for single-shot EPI sequences with a repetition time of 15 s and a decreasing slice excitation order as used in our protocol. Motion-correction algorithms were not applied since they may produce additional artifacts, especially for thin oblique slabs (Hajnal et al., 1994). Therefore, involuntary head movements were examined by calculating the center of mass (or gray values) of each EPI image of the functional series. In the present study we detected head movements between 0.2 and 4.7 mm within the scanning period of 8 min 45 s. Functional MR images which showed movements of >0.7 mm were discarded and repeated in a new scanning session (∼25% of all cases).
Results General
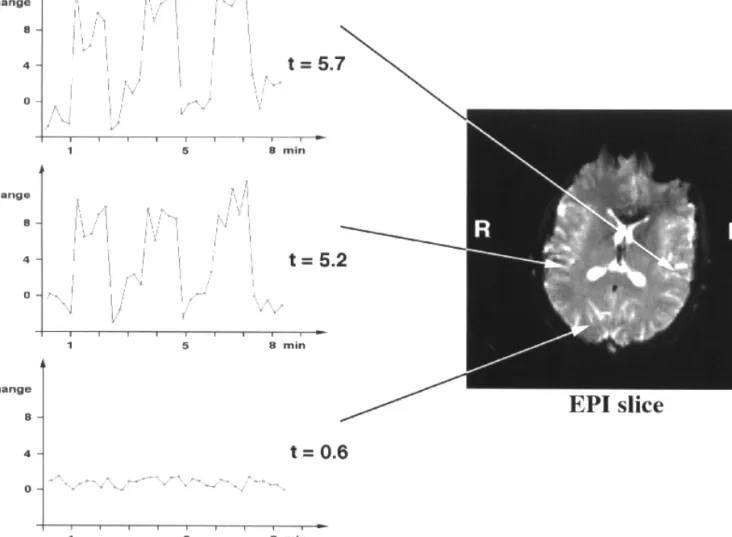
All subjects revealed a cortical BOLD response within the plane of the superior temporal gyrus. Typical time courses of the intensity changes caused by binaural pulsed sine tone stimulation are shown in Figure 2. The fMRI response within the activated area of the auditory cortex (top and middle in Fig. 2) is in good agreement with the rectangular excitation pattern of the ON–OFF cycle depicted in Figure 1. In addition, the time course of a non-activated cortical area of the brain (right occipital lobe) is shown in the bottom row representing essentially the noise level. The BOLD response followed the sine tone stimulus, as indicated by the shape of the response function, and was maximal in the auditory cortex. The number of slices revealing activated voxels varied from individual to individual and ranged between two and seven slices, covering a cranio-caudal extension of 0.8–2.8 cm. The present study investigates the Figure 1. Timing of acoustic stimulation and fMRI measurements. Black bars indicate
EPI measurements consisting of nine slices within 1.8 s followed by a resting period of 13.2 s. After five baseline series (OFF period of 75 s) acoustic stimulation is switched on for the next five image series (ON period). The complete paradigm is finished after 3.5 alternating OFF–ON cycles (OFF–ON–OFF–ON–OFF–ON–OFF) and has a total duration of 8 min 45 s.
BOLD response on binaural and monaural acoustic excitation for 10 healthy volunteers and five monaural deaf patients. The results obtained for these two groups are treated seperately.
Healthy volunteers
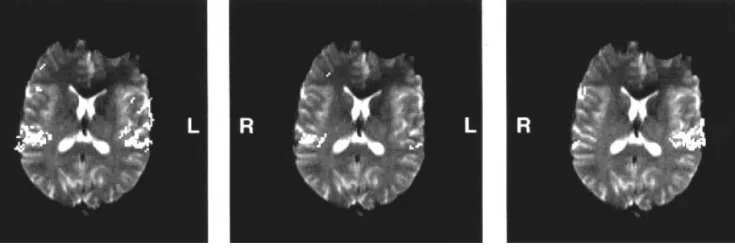
All 10 volunteers showed significant activation of both temporal lobes of the primar y auditory cortex. Figure 3 qualitatively depicts the cortical response on binaural, monaural left and monaural right stimulation for subject no. 3 and slice no. 5. For binaural stimulation, predominance of the left hemisphere activation was observed in 7 of 10 subjects (nos. 1–6, 8). The ratio of left to right activation volumes was 1.0–2.7. Three out of 10 volunteers revealed a preference of the right hemisphere with ratios of 0.6–0.8 (left:right). The mean lateralization ratio was 1.3 ± 0.66. The activation volumes for binaural stimulation are shown in Figure 4a for each volunteer.
For monaural left stimulation all 10 volunteers revealed a significant shift of cortical activation volumes towards the contralateral right hemisphere. The lateralization ratio (right:left) of activation volumes was 1.1–10.0; the mean ratio was 5.2 ± 3.1 (t = 3.9 > t0.005,18compared to binaural
lateral-ization ratio). Figure 4b depicts the results for monaural left stimulation for each single subject.
The BOLD response to monaural right stimulation also showed a clear contralateral, left-sided activation for all subjects. The lateralization ratio between left and right activation volumes was 1.6–8.9, resulting in a mean ratio of 3.4 ± 1.9 (t = 3.3, t0.005,18
compared to binaural lateralization ratio). The results are shown in Figure 4c. A comparison of total activation volumes for bi- and monaural stimulation is shown in Figure 4d for the three stimulation modalities. Figure 4d depicts the total activation volume at binaural stimulation (right plus left volume) and the sum of monaural left and monaural right activation volumes (right and left volumes for monaural left stimulation plus right and left volumes for monaural right stimulation).
Figure 2. Representative intensity time courses and corresponding t-values of three different pixels within the functional image series induced by binaural, pulsed sine tone
stimulation. Left and right pixels are located in Heschl’s gyrus and show a nearly rectangular BOLD signal change following the OFF–ON stimulation paradigm. The bottom row represents a typical non-significant time course.
Table 1
Mean lateralization ratios (left to right volumes for binaural and monaural right stimulation, right to left for monaural left stimulation) and mean relative cortical activation volumes (% monaural volumes of binaural volumes) for 10 normal-hearing subjects
Stimulation paradigm Lateralization ratio Cortical activation volume (%) Binaural 1.3 ± 0.66 defined to 100
Monaural left 5.2 ± 3.1 38 ± 21 sum: 70 ± 17 Monaural right 3.4 ± 1.9 32 ± 19
The sum of activation volumes for the monaural stimulations was significantly smaller than for binaural stimulation for nine subjects. Subject no. 5 shows comparable results for bi- and monaural stimulation. For binaural stimulation the mean excitation volume was 1.3 ± 0.5 ml and for the sum of monaural left and right stimulation we measured a cortical activation of
0.86 ± 0.31 ml. This corresponds to a loss of cortical activation of
∼30% and a significance level of P < 0.04 (t = 2.36 > t0.04,18). The
cortical activation volumes for monaural stimulation were only 38 and 32% of the binaural stimulation volumes, for left and right stimulation respectively. The lateralization ratio and the reduction of activated volumes are summarized in Table 1. Figure 3. Example of cortical response upon binaural and monaural stimulation (volunteer no. 3, slice no. 5). The images present an overlay of functional t-test maps (bright white
pixels) and the corresponding EPI slice. Binaural stimulation, left image, leads to a bitemporal activation. Monaural left stimulation gives rise to a predominant activation of the right hemisphere (middle image), monaural right stimulation produces a predominant left-sided activation (right image).
Figure 4. (a) Activation volumes for binaural acoustic stimulation with 1kHz sine tone, pulsed at 6 Hz. Black bars, right activation volume; white bars, left activation volumes. (b)
Activation volumes for monaural left stimulation. All subjects show a higher activation of the contralateral, right hemisphere. (c) Activation volumes for monaural right stimulation. (d) Cortical activation volumes of both hemispheres. Black bars represent the total (left + right) activation volume upon binaural acoustic stimulation, white bars show the sum of total activation volumes upon monaural left (L) and right (R) stimulation.
Patients with Unilateral Deafness
Five monaural deaf patients were examined with the same experimental setup and stimulation paradigms as used for healthy volunteers. The complete measuring session again consisted of a binaural, an unilateral right and an unilateral left stimulation. Binaural stimulation means simultaneous acoustic stimulation of the deaf and the healthy ear. All patients revealed a strong cortical response in both hemispheres comparable to
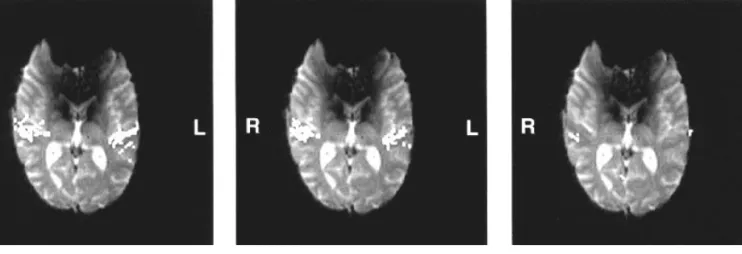
the activation volumes of healthy volunteers. Figure 5 shows a typical example of cortical response on binaural, monaural left and monaural right stimulation for a right-sided deaf patient (no. 5, slice no. 6). When compared to Figure 3, a clear difference between normal-hearing subjects and unilateral deaf patients can be observed. Monaural stimulation of the healthy ear reveals no contralateral activation pattern as for normal-hearing subjects. The detailed results are summarized in Figure 6. Total Figure 5. Cortical response upon binaural and monaural stimulation (patient no. 5 with unilateral right deafness, slice no. 6). The images present an overlay of functional t-test maps
(bright white pixels) and the corresponding EPI slice. Binaural stimulation, left image, leads to a bitemporal activation as well as monaural left stimulation of the healthy ear (middle image). Monaural right stimulation (deaf ear) shows a very small response (right image).
Figure 6. (a) Activation volumes for binaural acoustic stimulation of deaf patients with 1kHz sine tone, pulsed at 6 Hz. (b,c) Activation volumes for monaural left and right stimulation
activation volumes for binaural stimulation (Fig. 6a) ranged from 1.3 to 2.2 ml, resulting in a mean of 1.7 ± 0.4 ml. Moreover, a slight lateralization towards the deaf ear can be observed.
The activation volumes for monaural left and monaural right stimulation are listed in Figure 6b,c, respectively. Stimulation of the deaf ear revealed none or very small cortical activation (patient nos. 2 and 3 in Fig. 6b and patient nos. 1, 4 and 5 in Fig. 6c). This small cortical activation may be explained by a sound transmission from the deaf ear to the healthy ear via bone conduction.
In contrast to healthy subjects, a monaural stimulation of the healthy ear (right ear for patient nos. 2,3; left ear for patient nos. 1, 4 and 5) showed a strong cortical activation comparable to the activation volume of binaural stimulation. The mean activation volume on monaural stimulation of the healthy ear was 1.7 ± 0.3 ml.
The mean lateralization ratio for monaural stimulation of the healthy ear (left to right activation volumes for patients with left ear deafness and vice versa) was 1.3 ± 0.2. Table 2 summarizes the lateralization ratios and cortical activation volumes for bi-and monaural stimulation.
Discussion
A ll subjects revealed a cortical BOLD response within the primary auditory cortex. The set of significant pixels was subdivided into left and right hemispheres, allowing a numerical comparison of the activation volumes of the two temporal lobes. Both healthy volunteers and patients showed large intersubject differences in cortical response volumes. This variability was also reported in several previous studies of the auditive system using fMRI (Binder et al., 1994a,b; Wessinger et al., 1997), MEG (Tiihonen et al., 1989; Loveless et al., 1994) and PET (Greenberg et al., 1981; Lauter et al., 1985: Petersen et al., 1988). On the other hand, BOLD activation patterns recorded in consecutive measurements within the same subject were very reproducible. A ll calculations presented here are based on intra-individual cortical response ratios and relative cortical response reductions.
When comparing results from different neuroimaging tech-niques such as MEG, microelectrode mapping, PET and fMRI it should be kept in mind that these methods are based on totally different physical and physiological principles. BOLD signal changes are related to the focal hyperoxygenated blood in draining vessels. Therefore, neuronal activity is only indirectly demonstrated using fMRI and the spatial distribution of hyperoxygenation may not be exactly congruent with the activated neurons.
Two main aspects were examined in this study. The contra-laterality of monaural acoustic stimulation and the binaural summation principle were investigated with healthy volunteers and monaural deaf patients.
Binaural versus Monaural Stimulation of Healthy Subjects
When stimulated monaurally, all 10 healthy subjects showed a prominent shift of cortical BOLD response towards the contralateral hemisphere. Contralateral activation volumes were 5.2 and 3.4 times larger compared to ipsilateral activation volumes for monaural left and right stimulation respectively (P < 0.005). Binaural stimulation revealed a slight dominance of the left hemisphere by a factor of 1.3. Both obser vations are consistent with earlier electrophysiological and neuromagnetic studies. In rat (Di and Barth, 1993) and ferret (Kelly and Judge, 1994), contralateral stimulation produces larger amplitudes of evoked potentials compared to ipsilateral stimulation. This laterality effect was also described by single-unit studies in the auditory cortex of unanesthetized monkeys (Benson et al., 1981) and in the inferior colliculus of gerbils and cats (Young and Brownell, 1976; Semple and Kitzes, 1985). MEG studies by Tiihonen et al. (1989) and Loveless et al. (1994) report a significantly larger and earlier 100 ms def lection of auditory-evoked magnetic fields for contralateral than ipsilateral stimuli. These differences were also observed in studies by Reite et al. (1981), Elberling et al. (1981) and Pantev et al. (1986). Vasama et al. (1994) described 37% stronger dipole moments in the contralateral than ipsilateral hemisphere for left-ear tones but no significant differences for right-ear stimulation. Although both left- and right-ear stimulation revealed a strong contralaterality in our study, left-ear stimulation showed a higher lateralization ratio.
The slight left hemispheric dominance for binaural stimulation as found in this study is frequently reported in PET and fMRI studies (Greenberg et al., 1981; Petersen et al., 1988; Binder et al., 1994a,b). This observation could eventually be explained by the fact that 8/10 volunteers were right-handed.
The obser ved total activation volumes induced by binaural stimulation and by both monaural left and right stimulation are in agreement with the theory of binaural summation. Psycho-acoustic studies have shown that the loudness of a sound presented to two ears is doubled compared to the loudness of the same sound presented monaurally (Hellman and Zwislocki, 1963; Marks, 1978, 1987). In our study, binaural activation areas were∼30% larger than the two monaural components (P < 0.02). A similar finding has been reported in microelectrode mapping and MEG studies on animals (Di and Barth, 1993; Vater et al., 1995) and man (Loveless et al., 1994). For linear systems the sum of two output signals induced by two input signals is equal to the output caused by the sum of the two inputs. This additive or linear property seems not to be valid for the auditory process in man. The difference between monaural response and binaural responses indicates interaural interaction at some level of the auditory pathways. An alternative explanation of this finding could be an adaptation of the subject to the stimulus, the latter being presented in a fixed order (binaural, unilateral right, unilateral left). However, in control experiments, an additional binaural stimulation was performed after the three paradigms. A comparison of the activation volumes of the first and the last binaural stimulation revealed no significant differences. In addition, we did not observe a decrease of the percentage signal change within the scan time of 8 min 45 s (see, for instance, Fig. 2). The signal change was comparable for all paradigms. The resting period of 2 min between consecutive paradigms and the fact that monaural left responses are even higher than monaural right responses seems not to support an adaptation process. Table 2
Mean lateralization ratios (left to right volumes for binaural stimulation and contralateral to ipsilateral volumes with respect to the healthy ear) and mean relative cortical activation volumes (% monaural volumes of binaural volumes) for five monaural deaf patients
Stimulation paradigm Lateralization ratio Cortical activation volume (%) Binaural (healthy and deaf ear) 1.0 ± 0.56 defined to 100
Monaural (healthy ear) 1.3 ± 0.2 96 ± 7 Monaural (deaf ear) – 9 ± 4
Lateralization Ratios of Monaural Deaf Patients
The results of unilateral deaf patients revealed distinct differences to monaurally stimulated healthy volunteers. As expected, cortical responses to binaural stimulation (healthy and deaf ear) and monaural stimulation of the healthy ear were comparable in size and location. However, residual cortical activation can be detected after stimulation of the deaf ear. This may be explained by a weak transfer of sound to the contralateral, healthy ear via bone conduction which starts to be relevant for sound pressures >60 dB SPL.
A significant difference in the cortical response pattern can be observed between healthy subjects and monaurally deaf patients: monaural stimulation results in a strong contralaterality of the cortical response for healthy subjects, whereas a more or less balanced response can be obser ved for monaural deaf patients. The mean lateralization ratio was 1.3 for patients and 3.4–5.2 for healthy volunteers. This obser vation suggests adaptation and change in the auditory pathways after unilateral deafness. In our study, no difference was found between congenital and acquired unilateral deafness. MEG studies by Pelizzone et al. (1986) and Vasama et al. (1994) partly support these results. They detected significantly stronger responses over the ipsilateral hemisphere for monaural deaf patients (hear-ing threshold >90 dB) but not for patients with a reduced hear(hear-ing loss of only 60 dB. Animal studies on binaural interaction are controversial. Unilateral sound-deprived rats, cats and monkeys show abnormal ipsilateral inhibition in the inferior colliculus to stimulation of the healthy ear (Silverman and Clopton, 1977; Moore and Irvine, 1981; Kitzes and Semple, 1985). On the other hand, Reale et al. (1987) showed that the excitability of the auditory cortex in rat is increased ipsilateral to the healthy ear, and Mogdans and Knudsen (1994) reported an adaptive shift of interaural level differences for chronic monaural occluded barn owls.
Conclusions
FMRI was used to detect BOLD signal changes induced by bi- and monaural stimulation. The present data confirm and extend previous MEG and electrophysiological studies on sound lateralization and interaural compensation mechanisms in the human auditory cortex. Binaural responses are significantly larger than the sum of monaural left and right responses for healthy subjects, suggesting inhibitory mechanisms in the auditory cortex for monaural stimulation. Moreover, a distinct contralateral response upon monaural stimulation in normal-hearing subjects was detected. This pronounced lateralization was not found for monaural deaf patients and therefore indicates the plasticity of the auditory cortex.
Monaural deaf patients and healthy volunteers revealed an equivalent bilateral cortical response when stimulated binaurally. Hence a bilateral stimulation will lead to a bilateral activation pattern of the primary auditory cortex independent of whether the patient is unilaterally deaf or has normal hearing capabilities on both sides. Consequently, for fMRI-based diag-nosis of monaural deafness only a monaurally presented acoustic stimulation will reveal a pathological alteration. The stimulation of the affected side will show no or only a weak response; the stimulation of the unaffected side will lead to a bilateral cortical response. The differences between normal hearing volunteers and monaural deaf patients also suggest a slow kinetic process to induce bilateralization in deaf patients. Studies are currently underway in our laborator y to study the dynamic change of cortical responses for patients with sudden hearing loss.
Notes
This work was supported by the Swiss National Science Foundation, grant nos. 31.32533.91 and 32.33850.92.
Address correspondence to Klaus Scheff ler Ph.D., MR Center of the University of Basel, Klingelbergstrasse 50, CH-4031 Basel, Switzerland. Email: scheff [email protected].
References
Bandettini PA, Wong EC, Hinks RS, Tikofsky RS, Hyde JS (1992) Time course EPI of human brain function during task activation. Magn Reson Med 25:390–397
Bandettini PA, Jesmanowicz A, Wong EC, Hyde JS (1993) Processing strategies for time-course data sets in functional MRI of the human brain. Magn Reson Med 30:161–173.
Benson DA, Hienz RD, Goldstein MH Jr (1981) Single-unit activity in the auditor y cortex of monkeys actively localizing sound sources: spatial tuning and behavioral dependency. Brain Res 219:249–267. Bilecen D, Scheff ler K, Schmid N, Tschopp K, Seelig J (1996) Cerebral
compensation mechanism of the auditive system detected by fMRI. Proc ISMRM, New York, p. 1841.
Binder JR, Rao SM, Hammeke TA, Frost JA, Bandettini PA, Hyde JS (1994a) Effects of stimulus rate on signal response during functional magnetic resonance imaging of auditory cortex. Cognit Brain Res 2:31–38. Binder JR, Rao SM, Hammeke TA, Yetkin FZ, Jesmanowicz A, Bandettini
PA, Wong EC, Estkowski LD, Goldstein MD, Haughton VM, Hyde JS (1994b) Functional magnetic resonance imaging of human auditory cortex. Ann Neurol 35:662–672
Boring EG (1926) Auditor y theory with special reference to intensity, volume, and localization. Am J Psychiat 37:157–188.
Bronstein IN, Semendjajew K A (1979) Taschenbuch der Mathematik. Leibzig: Teubner Verlagsgesellschaft.
Di S, Barth, DS (1993) Binaural vs. monaural auditory evoked potentials in rat neocortex. Brain Res 630:303–314.
Elberling C, Bak C, Kofoed B, Lebech J, Saermark K (1981) Auditory magnetic fields from the human cortex. Scand Audiol 10:203–207. Fitzpatrick K A, Imig TJ (1980) Auditory cortico-cortical connections in
the owl monkey. J Comp Neurol 192:589–610.
Fox PT, Raichle ME (1984) Stimulus rate dependence of regional celebral blood f low in human striate cortex, demonstrated by positron emission tomography. J Neurophysiol 51:1109–1120
Fox PT, Raichle ME (1986) Focal physiological uncoupling of celebral blood f low and oxidative metabolism during somatosensor y stimulation in human subjects. Proc Natl Acad Sci USA 83:1140–1144 Frahm J, Merboldt K-D, Hänicke W (1993) Functional MRI of human brain
at high spatial resolution. Magn Reson Med 29:139–144
Frahm J, Merboldt K-D, Hänicke W, Kleinschmidt A, Boecker H (1994) Brain or vein-ogygenation of f low? On signal physiology in functional MRI of human brain activation. NMR Biomed 7:45–53.
Greenberg JH, Reivich M, Alavi A, Hand P, Rosenquist A, Rintelmann W, Stein A, Tusa R, Dann R, Christman D, Fowler J, MacGregor B, Wolf A (1981) Metabolic mapping of functional activity in human subjects with the (18F)-f luorodeoxyglucose technique. Science 212:678–680
Hajnal JV, Myers R, Oatridge A, Schwieso JE, Young IR, Bydder GM (1994) Artifacts due to stimulus correlated motion in functional imaging of the brain. J Magn Reson Med 31:283–291.
Hedeen R A, Edelstein WA (1997) Characterization and prediction of gradient acoustic noise in MR imagers. Magn Reson Med 37:7–10 Hellman RP, Zwislocki JJ (1963) Monaural loudness function at 1000 cps
and interaural summation. J Acoust Soc Am 35:856–865.
Kelly JB, Judge, PW (1994) Binaural organization of primary auditory cortex in the ferret. J Neurophysiol 71:904–913.
Kitzes LM, Semple, MN (1985) Single-unit responses in the inferior colliculus: effect of neonatal unilateral cochlear ablation. J Neurophysiol 53:1483–1500.
Lauter JL, Herscovitch P, Formby C, Raichle ME (1985) Tonotopic organization in human auditory cortex revealed by positron emission tomography. Hearing Res 20:199–205.
Loveless N, Vasama JP, Mäkelä J, Hari R (1994) Human auditory cortical mechanisms of sound lateralisation: III. Monaural and binaural shift responses. Hearing Res 81:91–99.
Marks LE (1978) Binaural summation of the loudness of pure tones. J Acoust Soc Am 27:107–113.
Marks LE (1987) Binaural versus monaural loudness: supersummation of tone partially masked by noise. J Acoust Soc Am 81:122–128.
Mogdans J, Knudsen EI (1994) Site of auditory plasticity in the brain stem (VLVp) of the owl revealed by early monaural occlusion. J Neurophysiol 72:2875–2891.
Moore DR, Irvine DRF (1981) Plasticity of binaural interaction in the cat inferior colliculus. Brain Res 208:198–202.
Ogawa S, Lee TM, Nayak AS, Glynn P (1990) Oxygenation-sensitive contrast in magnetic resonance image of rodent brain at high magnetic. Magn Reson Med 14:68–78.
Pantev C, Lütkenhöner B, Hoke M, Lehnertz K (1986) Comparison between simultaneously recorded auditory-evoked magnetic fields and potentials elicted by ipsilateral, contralateral and binaural tone burst stimulation. Audiology 25:54–61.
Pelizzone M, Hari R, Mäkelä J, Kaukoranta E, Montandon P (1986) Activation of the auditory cortex by cochlear stimulation in a deaf patient. Neurosci Lett 68:192–196.
Petersen SE, Fox PT, Posner MI, Mintun M, Raichle ME (1988) Positron emission tomographic studies of the cortical anatomy of single-word processing. Nature 331:585–589.
Reale R A, Brugge JF, Chan JCK (1987) Maps of auditory cortex in rat reared after unilateral cochlear ablation in the neonatal period. Dev Brain Res 34:281–290.
Reite M, Zimmerman JT, Zimmerman JE (1981) Magnetic auditory evoked
fields: interhemispheric asymmetry. Electroenceph Clin Neurophysiol 51:388–392.
Semple MN, Kitzes LM (1985) Single-unit responses in the inferior colliculus: different consequences of contralateral and ipsilateral auditory stimulation. J Neurophysiol 53:1467–1482.
Silverman MS, Clopton BM (1977) Plasticity of binaural interaction. I. Effect of early auditory deprivation. J Neurophysiol 40:1266–1274. Tiihonen J, Hari R, Kaukoranta E, Kajola M (1989) Interaural interaction
in the human auditor y cortex. Audiology 28:37–48.
Vasama JP, Mäkelä J, Parkkonen LO, Hari R (1994) Auditor y cortical responses in humans with congenital conductive hearing loss. Hearing Res 78:91–97.
Vater M, Casseday JH, Covey E (1995) convergence and divergence of ascending binaural and monaural pathways from the superior olives of the mustached bat. J Comp Neurol 351:632–646.
Wessinger CM, Buonocore MH, Kussmaul CL, Mangun GR (1997) Tonotopy in human auditory cortex examined with functional magnetic resonance imaging. Hum Brain Map 5:18–25.
Young ED, Brownell WE (1976) Responses to tones and noise of single cells in dorsal cochlear nucleus of unanesthetized cats. J Neurophysiol 39:282–300.
Zenner HP (1994) Hören: Physiologie, Biochemie, Zell- und Neurobiologie. Stuttgart: Thieme Verlag.