Alterations in the cellular DNA and protein content determined by
flow cytometry as indicators for chemically induced structural and
numerical chromosome aberrations
Peter Maier and Hanspeter Schawalder
Institute of Toxicology, Swiss Federal Institute of Technology and University of Zurich, CH-8603 Schwerzenbach, Switzerland
Cellular DNA and protein content were determined simul-taneously in freshly isolated fibroblast-like rat cells by flow cytometry. After exposure to doxorubicin, nitrofurantoin, propranolol and practolol at a low, tissue like oxygen con-centration (5% O2), drug-induced alterations in cell cycle kinetics, in the distribution of DNA and in the protein con-tent of G,-phase cells (nucleus/cytoplasm ratio) were analys-ed. Optimal exposure time (5 or 24 h) and recovery interval (24 or 48 h) were determined. Variation in the exposure time and recovery period can affect cell cycle kinetics both quali-tatively and quantiquali-tatively, whereas the distribution of DNA and protein content are affected quantitatively only. A 24-h exposure combined with a 24-h recovery period proved to be the most efficient approach. Each of the tested chemicals in-duced a specific, dose-dependent pattern of altered cellular DNA and protein content. Comparison with results obtained in other genotoxicity tests, and with data reported earlier, showed that this two-parameter protocol can be used to recog-nize and to characterize chemicals as clastogens, or as com-pounds with a combined cytostatic/clastogenic activity, or as spindle-poison-like compounds.
Introduction
In a given cell population, flow cytometry provides an efficient tool to analyse specific constituents of individual cells. By simultaneous analysis of the DNA and protein content of intact cells by two-parameter flow cytometry (Maier and Schawalder, 1986) relationships between the cytotoxic/cytostatic activities and the genotoxic activity following exposure to mutagens can be defined. Indicators of such activities are blockage at a specific cell cycle phase, alterations in the dispersion of cellular DNA and protein content in G|-phase cells and an imbalance between the two parameters (nucleus/cytoplasm ratio). Using this proto-col, surviving intact cells are analysed and drug-induced dead cells, with lysed or fragmented nuclei, can readily be discrim-inated.
During metaphase analysis, only those cells which terminate DNA synthesis and G2 phase during the relative short arrest interval are analysed. In contrast, using flow cytometry, cells in all cycle phases can be analysed. Analysis of Grphase cells
allows chemicals with an S-phase dependent activity to be recovered when a sufficient number of damaged cells enter the G| phase following treatment. This post-mitotic analysis might be advantageous, particularly for the detection of spindle poisons which induce numerical chromosome aberrations.
With the extension of the recovery period, the accumulation of aneuploid, often slowly cycling cells in the G, phase, might
be increased. Alternatively, selection against these abnormal cells occurs as a function of the proliferative activity of the normal cells (cell density).
Therefore, the objective of the present study was (i) to evaluate further the suitability of the two-parameter flow cytometry pro-tocol established in this laboratory (Maier and Schawalder, 1986) by varying exposure and recovery periods and (ii) to use this system to analyse two 'problematic' chemicals: nitrofurantoin and propranolol.
The anthracycline antibiotic doxorubicin (DX) was used as a positive control. This chemical is a powerful clastogen in vitro (Vig, 1977), in vivo in mice (Maier and Schmid, 1976; Au and Hsu, 1980) and man (Hacker-Klom et al., 1986). The drug is highly fluorescent (Krishan and Ganapathi, 1980), and when ex-cited with a 350-nm argon laser beam, the emission spectrum (Krishan et al., 1985) is in the same range as the DNA fluorochrome (DAPI) used in the present investigation. This prop-erty provided an opportunity to investigate whether the drug could interfere with analysis of DNA.
Nitrofurantoin (NF) is an antibacterial agent used in human and veterinary medicine for the treatment of systemic infections specifically of the urinary tract. It is highly mutagenic in bacterial test systems (Cohen et al., 1973; Yahagi et al., 1976) and induces mitotic gene conversion in yeast (Siebert et al., 1979). However, in mammalian cells, the drug causes only a low incidence of sister chromatid exchanges (Shirai and Wang, 1980). No tumorigenic activity has so far been reported in rodents (Morris et al., 1969; Yahagi et al., 1974). This discrepancy between the mutagenic and carcinogenic activity and the pathways involved in drug activation in mammalian tissues is still a matter for debate (McCalla, 1983). In particular, it is not clear whether the reactivity of the chemical is influenced by the oxygen tension present in tissues.
The third chemical tested was propranolol, a /3-adrenergic blocking agent with widespread use in the treatment of hypertension in man. This compound was reported positive in the micronucleus test (Okine et al., 1983; Aruna and Krishna-murthy, 1986) but its genotoxicity has not been confirmed in other assays. Practolol is also a /3-blocking agent which has been withdrawn from the market because of its induction of a rare oculomucocutaneous syndrome (Wright, 1975) in humans. It was used as a negative control.
Primary cultures of fibroblast-like rat cells were used in the experiments. These euploid cells maintain a highly stable DNA content over several passages and their metabolism parallels that found in the corresponding tissue in vivo.
Materials and methods
Chemicals
The source of the chemicals was as follows: DX (Farmitalia, Carlo Erba, Milano, Italy), NF (l-[(5-nitrofurfurylidene) amino]-hydantoin) (Sigma Chemical Company, St Louis, MO, USA), practolol [M4-(2-hydroxy)-3(l-metyl)-aminopropoxyphenyl-acetamine] and propranolol [l-(isopropylamino)-3(l-naphthyI-oxy)-2-propranolol]
cell - cycle phase
CV
CP<
w
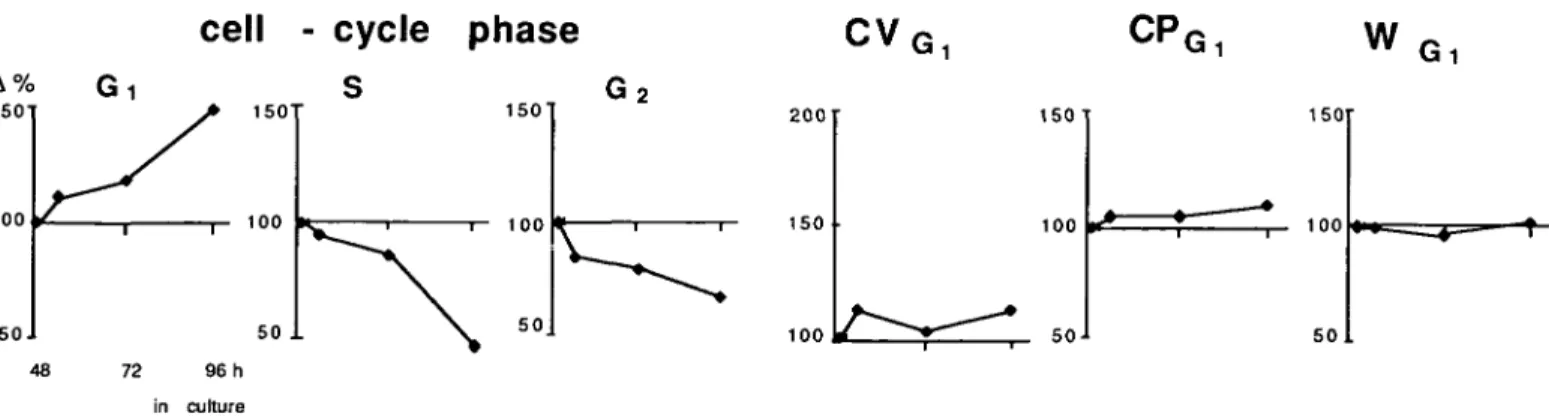
A% 1501 100 5 0 J 150 100 50 1 1501 100 50 200 150 100 150 100 50J 150 100 50 48 72 96 h in cultureFig. 1. Influence of exposure/recovery schedule on DNA/protein parameters in untreated cells. Data are pooled from control values of all chemicals tested. The culture period corresponds to the following exposure/recovery periods: 48 h = 24/0 h; 53 h = 5/24 h; 72 h = 24/24 h; 96 h = 24/48 h.
(Imperial Chemical Industries, Macclesfield, UK). DX, practolol and propranolol were dissolved in culture media (Dulbecco's modified Eagle's medium, DMEM) and NF in dimethylsulphoxide (DMSO) to a maximal final concentration of 0.3% at the highest exposure level. Appropriate controls were carried out with the highest DMSO concentration. The fluorochromes used were sulphorhodamine 101 (SR 101, Sigma) for protein 4,6-diamidino-2-phenyl indole dihydrochloride (DAPI, Serva, Munich, FRG) for DNA.
Cells and treatment
Fibroblast-like cells were isolated from subcutaneous granulation tissue of nearly adult male rats (220 ± 15 g, n = 15, Sprague-Dawley, SIV 50, Ivanovas, Kisslegg, FRG). Growth of this tissue was initiated on the inside wall of an air pouch at the scapular region of young adult male rats (Maier, 1984). Four days later, cells were isolated according to standardized procedures. Fibroblast-like cells were then cultured for 3 days in DMEM supplemented with 10% fetal calf serum and 5 /jl/ml gentamycin under the following conditions: 12% CO2, 5% O2, 36.5°C, pH 7.4, RH 95%. Exposure of cells occurred at physiologic tissue pO2 which corresponds to an O2 concentration in the incubator of 5 % (Maier et al., 1987). In a series of experiments with NF, hyperoxic conditions (31% O2) were chosen.
On day 3, cells were trypsinized and the cells seeded per dish were adapted according to the exposure/recovery period in order to prevent contact inhibition of growth. After 24 h in culture, the test compounds were added for 5 or 24 h to these asynchronous, rapidly proliferating cell populations. The short exposure time (5 h) was assumed to approximate to the exposure time which would be expected after an in vivo treatment. The 24-h exposure interval covers more than the whole cell cycle of proliferating cells.
After replacement of the medium, treated cells were subjected to a recovery period of 24 or 48 h. The extended recovery period was designed to increase further the accumulation of aneuploid cells in G, phase. Subsequently, cultures were washed with phosphate-buffered saline (PBS), trypsinized (trypsin/EDTA) and the dispersed cells fixed in cold 70% ethanol added to the culture dishes. After centrifugation cells were fixed in 90% ethanol for 30 min to 2 h. Staining
The staining solution was a mixture of 10 ml SR 101 solution (3 mg sulphorhodamine 101 dissolved in 100 ml Tris-HCl, 180 mM, pH 7.4, 200 mM NaCl) and 0.3 ml DAPI solution (10 mg DAPI in Tris-HCl) as described earlier (Stohr et al., 1978; Maier and Schawalder, 1986). This cold staining solution was added to the cell pellet. Cells were suspended and stained for 15 min on a Coulter Mixer in the dark. Subsequently, they were stored on ice (1 —2 h) and filtered through a 14-/un nylon mesh immediately before flow analysis. Flow measurements
Stained samples were analysed in the staining solution on a PAS n flow cytometer (Partec, Arlesheim, Switzerland) with the following conditions: excitation—I00-W mercury lamp, UG1 (290-410 nm. 3 mm), chromatic beam splitter (460 nm); emission—beam splitter (610 nm), 610-nm barrier filter for SR 101 analysis and a GG 455 filter for DAPI signals. Flow rate: 200-400 cells/s; objective: 40 x Nikon UV-F for epifluorescence (numerical aperture 1.3) with glycerine immersion and KoWer illumination. As an internal standard for DNA we took freshly isolated and fixed rat thymocytes. Their coefficients of variation (CV) in the DNA content of G| cells before measurements were always <2.5%. Standards for protein were cryopreserved fibroblast-like human cells. Protein measurements were triggered by the DNA fluorescence signals.
From each treated cell population, 5 x 10⁴ cells were analysed. Each chemical was tested in one experiment over the whole dose range including the control Measurements were repeated in 3 - 5 separate experiments (Table HI)- The controls
were rerun after each individual series. Only when the same modal DNA values were obtained as at the beginning were data further analysed.
Data acquisition was carried out with a FDAS II computer (Ahrens et al., 1980). From each sample the single-parameter frequency distribution histograms of DNA and protein, the two-parameter contour display, the three-dimensional perspective display and the protein single-parameter histogram of gated G, cells were recorded and stored on floppy disks.
Data analysis
DNA and protein single-parameter histograms were analysed with fitting programs (FIT 4.24) provided by O.Ahrens (Bargteheide, FRG). The DNA dispersion of the G| peak was described by the coefficient of variation of the G| cell population (CVG|). The relative contribution of cells in the G|/Go, S and G2/M phases was calculated by means of a modified least-square fitting method (Gray and Dean,
1980) (Figure 2b).
The values of the cellular protein content in gated G, cells were best fitted by a .Y-log-normal distribution (Figure 2c). The channel position of the modus (CPG|) and the width of the distribution (WG| value) were used to describe the drug-induced effects. An excellent correlation existed between the position of the modus of the protein distribution and the protein content of these cells as determined by the method of Bradford (1976) (data not shown).
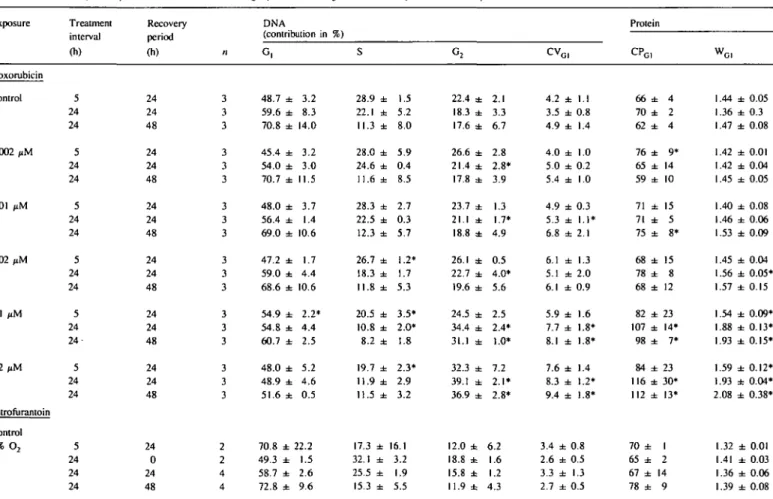
DNA and protein data are summarized in Tables I, II and III. Values represent the mean from individual experiments, including standard deviations.
For illustration, the dose - response effect of DX is shown in representative single-parameter DNA and protein histograms with the corresponding contour plots (Figure 2). Histograms selected best fit the mean value at this exposure levels as indicated in Table III. They are representative for the analysis of the other chemicals.
Results
From untreated cell populations, the mean of the CV of the DNA content in G, cells ranged from 2.7 to 4.9% between individual independent experiments. This variability may be due to differences in cell preparations (fixation), in the staining solutions and most importantly on the condition of the high-pressure mercury arc lamp or in the adjustments of the optical system of the flow cytometer. CV values respond most sensitively to these parameters. Therefore, only when experiments are performed over the entire dose range of a chemical, in the cell population from the same rat, analysed on the same day and with reference samples always used after each abnormal histogram, will drug-induced CV alterations be discriminated from artefacts.
Alterations in the cell cycle kinetics of untreated cells might arise from handling of the cells during culture. This was demon-strated by the analysis of six untreated cell populations cultured in parallel from two animals (Table I). Clearly, growth behaviour from one culture dish to the other from the same animal does not significantly contribute to the observed variations. The variability derives from the use of cell populations from different rats.
Alterations in cell cycle phases of untreated cells were also found with increasing culture time in the protocols chosen (Table
control CP — H
b)
—
DflFl CVc)
1
\ SRG11
PROTEIN Doxorubicin O.OO2 pM J DPF: Z4h a.201u
k
1 V SRGl I 1 Zih 2.201 0.2Fig. 2. Analysis of cellular DNA and protein content, (a) Gate for protein analysis in G, cells defined in the contour plots, (b) Analysis of DNA parameters
[coefficient of variation of Grphase cells (CVGI) and Gr, S- and G2-phase calculations] from the DNA histogram, (c) Analysis of protein histograms of G, cells: channel position (CPG|) and W value (WG|) and drug induced effects by doxorubicin.
HI). This was due to the decrease of the trypsin-induced synchronization after subcloning and, despite the reduction of cell number in the 24/24- and 24/48-h schedules, to a density-de-pendent inhibition of growth. The altered growth rate alone does not affect CV, CP and W values as shown in Figure 1. Accord-ingly a chemical which affects growth behaviour alone will not affect these parameters. At the time of treatment, however (24 h after seeding), these differences between the protocols do not exist.
In untreated cell populations, the positions of the mode of the
protein histograms (CPG1) in relation to the cellular standard
(cryopreserved fibroblast-like human cells) do not vary more than ± 5 %. The W values as an indicator for the heterogeneity in the protein histograms varied between 1.32 and 1.47.
Exposure levels were selected so that no signs of acute (detach-ment of cells) or delayed toxicity (protein leakage) within the 24-h or the 48-h recovery period were observed. Extension of the exposure period enhanced the dose-dependent increase of the dispersion of DNA content (CVG, values) by DX and NF. This
Table I. DNA and protein parameters determined from histograms of untreated cells cultured in parallel Rat 1 Mean ± S D Rat 2 Mean ±SD Culture no. 1 2 3 4 5 6 1 2 3 4 5 6 DNA (contribution in % 48.3 46.6 43.4 46.0 44.8 45.3 45.7 ± 1.7 52.7 53.5 52.2 48.4 52.1 48.4 51.3 ± 2.1 ) S 30.4 31.0 32.5 30.0 33.0 31.8 31.5 ± 1.2 25.8 24.7 25.3 25.0 26.1 27.3 25.7 ± 0.9 G2 21.2 22.5 24.1 24.0 22.3 22.9 22.8 ± 1.1 21.6 21.8 22.6 26.2 21.8 24.3 23.1 ±1.8 cvcl 4.7 5.6 4.6 4.5 4.8 5.1 4.9 ± 0.4 3.1 4.8 4.2 4.5 4.0 4.9 4.3 ± 0.7 Protein CPG, 67 80 75 77 77 71 75 ± 5 79 68 83 82 70 70 75 ± 7
w
G,
1.46 1.42 1.40 1.40 1.40 1.42 1.41 ± 0.03 1.35 1.37 1.40 1.40 1.38 1.40 1.38 ± 0.02 Data are obtained with cells from two rats. Six dishes were cultured in parallel and analysed individually 48 h after seeding.Table II. Influence on DNA and protein parameters as a function of cell density and conformational changes of G^phase cells to G0-phase cells
Culture 48-h 72-h 96-h DNA (contribution in % G, 48.4 ± 1.1 63.3 ± 7.7 81.7 ± 4.5 •) S 27.0 20.2 6.7 ± ± + 0.7 5.7 1.2 G2 24.6 16.6 11.7 ± ± + 0.4 2.0 3.3
cv
G1 3.9 ± 3.3 ± 3.2 ± 1.4 1.0 0.4cv
G 2 4.3 ± 3.6 ± 3.5 ± 1.6 1.3 0.4 Protein CPGI 68 ± 1 70 ± 3 69 ± 15 1.42 1.37 1.45 ± ± ± 0.06 0.03 0.16 Values are from four independent continuous cultures analysed 48, 72 and 96 h after seeding of 3 x 10⁵ cells into 15-cm dishes. Values = mean ± SD. Table ID. DNA and protein parameters calculated from single-parameter histograms of cells exposed to test compoundsExposure Doxorubicin Control 0.002 iiM 0.01 jiM 0.02 fiM 0.1 fiM 0.2 (iM Nitrofurantoin Control 5% O2 Treatment interval (h) 5 24 24 5 24 24 5 24 24 5 24 24 5 24 24-5 24 24 5 24 24 24 Recovery period (h) 24 24 48 24 24 48 24 24 48 24 24 48 24 24 48 24 24 48 24 0 24 48 n 3 3 3 3 3 3 3 3 3 3 3 3 3 3 3 3 3 3 2 2 4 4 DNA (contribution in % G, 48.7 ± 3.2 59.6 ± 8.3 70.8 ± 14.0 45.4 ± 3.2 54.0 ± 3.0 70.7 ± 1 1 . 5 48.0 ± 3.7 56.4 ± 1.4 69.0 ± 10.6 47.2 ± 1.7 59.0 ± 4.4 68.6 ± 10.6 54.9 ± 2.2* 54.8 ± 4.4 60.7 ± 2.5 48.0 ± 5.2 48.9 ± 4.6 51.6 ± 0.5 70.8 ± 22.2 49.3 ± 1.5 58.7 ± 2.6 72.8 ± 9.6 ) S 28.9 22.1 11.3 28.0 24.6 11.6 28.3 22.5 12.3 26.7 18.3 11.8 20.5 10.8 8.2 19.7 11.9 11.5 17.3 32.1 25.5 15.3 ± ± ± ± ± ± ± ± ± ± ± ± ± ± ± ± 1.5 5.2 8.0 5.9 0.4 8.5 2.7 0.3 5.7 1.2* 1.7 5.3 3.5* 2.0* 1.8 2.3* 2.9 3.2 16.1 3.2 1.9 5.5 G2 22.4 18.3 17.6 26.6 21.4 17.8 23.7 21.1 18.8 26.1 22.7 19.6 24.5 34.4 31.1 32.3 39.1 36.9 12.0 18.8 15.8 11.9 ± ± ± ± ± ± ± t t t t 2.1 3.3 6.7 2.8 2.8* 3.9 1.3 1.7* 4.9 0.5 4.0* 5.6 2.5 2.4* 1.0* 7.2 2.1* 2.8* 6.2 1.6 1.2 4.3 cvG, 4.2 ± 1.1 3.5 ± 0.8 4.9 ± 1.4 4.0 ± 1.0 5.0 ± 0.2 5.4 ± 1.0 4.9 ± 0.3 5.3 ± 1.1* 6.8 ± 2.1 6.1 ± 1.3 5.1 ± 2.0 6.1 ± 0.9 5.9 ± 7.7 ± 8.1 ± 7.6 ± 8.3 ± 9.4 ± .6 .8* .8* .4 .2* .8* 3.4 ± 0.8 2.6 ± 0.5 3.3 ± 1.3 2.7 ± 0.5 Protein CPG, 66 ± 4 70 ± 2 62 ± 4 76 ± 9* 65 ± 14 59 ± 10 71 ± 15 71 ± 5 75 ± 8* 68 ± 15 78 ± 8 68 ± 12 82 ± 23 107 ± 14* 98 ± 7* 84 ± 23 116 ± 30* 112 ± 13* 70 ± 1 65 ± 2 67 ± 14 78 ± 9 wo , 1.44 ± 1.36 ± 1.47 ± 1.42 ± 1.42 ± 1.45 ± 1.40 ± 1.46 ± 1.53 ± 1.45 ± 1.56 ± 1.57 ± 1.54 ± 1.88 ± 1.93 ± 1.59 ± 1.93 ± 2.08 ± 1.32 ± 1.41 ± 1.36 ± 1.39 ± 0.05 0.3 0.08 0.01 0.04 0.05 0.08 0.06 0.09 0.04 0.05* 0.15 0.09* 0.13* 0.15* 0.12* 0.04* 0.38* 0.01 0.03 0.06 0.08
Exposure 31% O, 20 fiM 5% 0 , 31% O, 40 iiM 5% O, 31% 0 , 100 tiM 5% O2 31% *2 200 MM-5% O, 31% O2 Propranolol Control 2 10 iiM 32 (iM 100 (iM Treatment interval (h) 24 24 24 5 24 24 24 24 24 24 5 24 24 24 24 24 24 24 24 24 24 24 24 5 24 24 24 24 24 24 5 24 5 24 5 24 5 24 5 24 Recovery period (h) 0 24 48 24 0 24 48 0 24 48 24 0 24 48 0 24 48 0 24 48 0 24 48 24 0 24 48 0 24 48 24 24 24 24 24 24 24 24 24 24 n 2 4 3 1 2 4 2 2 4 2 2 2 4 4 2 4 3 2 4 4 2 5 3 2 2 4 4 2 4 2 3 4 3 4 3 4 2 2 3 4 DNA (contribution in 7t) G, 67.0 ± 54.6 ± 56.7 ± 56.8 53.0 ± 59.5 ± 60.6 ± 71.4 ± 54.0 ± 49.1 ± 68.9 ± 53.3 ± 57.5 ± 67.6 ± 65.3 ± 57.6 ± 53.0 ± 59.8 ± 62.9 ± 58.3 ± 69.5 ± 55.7 ± 46.6 ± 70.1 ± 55.3 ± 61.0 ± 53.3 ± 60.8 ± 63.4 ± 43.3 ± 49.7 ± 56.9 ± 48.5 ± 55.9 ± 49.5 ± 55.4 ± 46.0 ± 51.3 ± 46.6 ± 53.5 ± 9.6 3.5 8.3 4.0 4.3 5.6 14.8 8.7 6.3 18.0 2.3 4.9 10.3* 20.5 9.4 14.6 23.9 9.4 8.6* 17.1 10.9 8.4* 9.4 20.9 14.9 15.7* 15.1 1.43 10.8 7.5 10.6 6.7 9.1 9.1 6.5 1.3 7.5 3.0 6.6 S 20.2 ± 29.6 ± 25.4 ± 29.6 31.4 ± 25.8 ± 20.8 ± 12.2 ± 30.3 ± 26.4 ± 18.3 ± 32.7 ± 27.0 ± 17.8 ± 19.8 ± 31.8 ± 25.4 ± 23.8 ± 23.2 ± 22.3 ± 17.8 ± 26.7 ± 28.3 ± 18.6 ± 30.4 ± 25.5 ± 26 A ± 17.6 ± 16.7 ± 24.3 ± 30.3 ± 26.2 ± 33.2 ± 26.3 ± 32.4 ± 27.4 ± 30.2 ± 27.4 ± 32.4 ± 27.4 ± 1.8 1.7 3.2 1.4 1.1 0.1 0.4 4.1 2.9* 12.7 2.4 2.3 7.1 6.8 4.1 5.0 7.8 1.8 1.8* 0.9 6.0 1.1 9.4 11.6 6.4 4.8* 4.4 6.1* 1.5* 2.6 4.1 1.9 4.5 3.8 2.2 0.7 2.0 1.8 1.7 G, 12.9 15.8 17.9 13.6 15.6 14.9 18.7 16.4 15.7 24.6 12.2 14.0 15.5 14.7 14.9 10.7 21.7 16.5 14.0 19.5 12.6 17.5 25.1 11.4 14.3 13.6 20.6 21.6 24.4 32.5 20.1 16.9 18.2 17.9 18.0 17.1 23.8 21.3 20.9 19.0 ± ± ± ± ± ± ± ± ± ± ± ± ± ± ± ± ± ± ± ± ± ± ± ± ± ± ± ± ± ± ± ± ± ± ± ± 7.8 2.3 5.0 5.5 3.3 5.7 15.1 4.7 3.4 6.5 4.7 2.7 3.4 13.7 6.4 9.6 16.0 8.2 7.4 16.2 15.2 7.3* 0 9.3 9.0 12.1 10.6 15.6 9.3 5.8 6.5 4.7 5.0 5.9 4.6 0.6 5.2 1.8 5.1 cvc, 3.3 ± 0.1 3.6 ± 0.6 3.1 ± 0.2 4.5 3.2 ± 0.3 3.8 ± 1.5 3.7 ± 1.2 3.6 ± 0.1* 3.5 ± 0.7 3.4 ± 0.1 4.0 ± 1.4 3.1 ± 0.4 3.9 ± 1.4* 2.9 ± 0.3 3.9 ± 0.3 4.4 ± 0.5* 3.8 ± 0.2 4.1 ± 1.6 4.8 ± 1.1 3.5 ± 0.4 4.0 ± 0.9 4.6 ± 0.7 3.8 ± 0.6 4.5 ± 1.2 3.8 ± 0.6 5.2 =fc 0.6 3.7 ± 0.2 4.0 ± 0.5 4.6 =fc 0.6 3.7 ± 0.6 3.7 ± 1.0 3.1 ± 0.4 4.2 ± 1.2* 3.7 ± 0.4* 3.9 ± 0.4 4.2 ± 1.0* 3.7 ± 0.1 4.0 ± 0.2 3.6 ± 0.5 4.3 ± 0.4* Protein CPGI 72 ± 6 74 ± 21 83 ± 16 73 72 ± 6 72 ± 17* 64 ± 12 75 ± 6 74 ± 24 80 ± 9 68 ± 8 76 ± 2* 76 ± 23 77 ± 5 78 ± 20 86 ± 21 92 ± 21 81 ± 6 89 ± 24* 91 ± 12* 71 ± 13 88 ± 16 88 ± 19 72 ± 13 84 ± 4.7* 92 ± 14* 101 ± 15* 71 ± 4 79 ± 24 90 ± 11 68 ± 7 69 ± 14 70 ± 14 76 ± 11 71 ± 9 74 ± II 66 ± 10 67 ± 1 72 ± 10 75 ± 13 wGI 1.47 1.39 1.38 1.33 1.37 1.40 1.42 1.50 1.42 1.44 1.32 1.44 1.40 1.38 1.51 1.57 1.46 1.44 1.47 1.53 1.53 1.50 1.47 1.33 1.42 1.51 1.54 1.49 1.51 1.63 1.39 1.34 1.39 1.35 1.34 1.34 1.35 1.35 1.36 1.32 ± 0.01 ± 0.09 ± 0.03 ± 0.07 ± 0.08 ±0.11 ± 0.10 ± 0.08* ± 0.01 ± 0.03 ± 0,06 ± 0.10 ± 0.09 ± 0.01 ± 0.14* ± 0.05* ± 0.10 ± 0.07* ± 0.16 ± 0.02 ± 0.05 ± 0.09 ± 0.01 ± 0.03 ± 0.09 ± 0.16 ± 0.13 ± 0.05 ± 0.15 ± 0.04 ± 0.05 ± 0.03 ± 0.04 ± 0.08 ± 0.05 ± 0.01 ± 0.03 ± 0.02 ± 0.06 KP 7-cells Control 1 nM 3.2 ILM 10 iM 32 ^M 100 ^M Practolol Control I fiM 10 uM 100 ^M 320/xM 24 24 24 24 24 24 5 24 5 24 5 24 5 24 5 24 24 24 24 24 24 24 24 24 24 24 24 24 24 24 24 24 2 2 2 2 2 2 3 3 3 3 3 2 3 3 2 2 70.0 70.0 70.1 69.6 68.5 57.0 50.4 54.0 50.5 55.9 46.9 57.5 50.0 55.3 41.3 49.8 ± ± ± ± ± ± ± ± ± ± ± ± ± 1.3 3.3 1.9 1.8 2.0 0.1 9.1 10.8 9.1 3.0 9.6 5.9 11.0 7.5 0.1 1.8 15.4 15.0 15.3 14.9 14.9 17.0 30.9 27.4 31.5 27.3 32.2 27.5 31.7 26.6 36.6 30.1 ± ± ± ± ± ± ± ± ± ± ± ± ± ± ± 1.4 0.8 0.5 0.7 0.7 0.4 2.8 4.0 3.1 0.7 4.0 2.8 5.0 2.8 2.6 0.5 14.6 ± 15.0 ± 14.7 ± 15.4 ± 16.6 ± 26.0 ± 18.7 ± 18.5 ± 18.0 ± 16.8 ± 20.9 ± 15.0 ± 18.6 ± 18.1 ± 22.0 ± 20.1 ± 0.1 1.5 1.3 01.1 0.8 0.4 6.3 6.8 6.1 2.6 7.2 3.2 6.4 4.9 2.0 1.4 2.8 2.9 3.3 3.1 3.2 3.5 3.6 3.1 3.6 2.7 4.0 2.8 3.8 3.5 3.5 3.0 ± 0.2 ± 0.6 ± 0.1 ± 0.4 ± 0.8 ± 1.3 ± 1.1 ± 0.5 ± 0.8 ± 0.3 ± 0.6 ± 0.1 ± 0.8 ± 0.4 ± 1.1 ± 0.4 78 ± 81 ± 73 ± 68 ± 83 ± 76 ± 71 ± 66 ± 77 ± 68 ± 74 ± 73 ± 68 * 76 ± 84 ± 63 ± 20 18 27 25 40 23 4 6 23 8 22 9 14 13 15 5 1.38 1.36 1.37 1.35 1.33 1.37 1.40 1.35 1.34 1.34 1.36 1.36 1.34 1.36 1.34 1.39 ± 0.08 ± 0.01 ± 0.08 ± 0.01 ± 0.07 ± 0.02 ± 0.05 ± 0.06 ± 0.03 ± 0.05 ± 0.04 ± 0.08 ± 0.02 ± 0.04 ± 0.04 ± 0.01 mean ± SD. n number of experiments.
cell - cycle phase K < 100 50 50 62 m. i \ ^ 1 ^ / CVr CPF WG, Doxorubicin ( • ) Nitrofurantoin
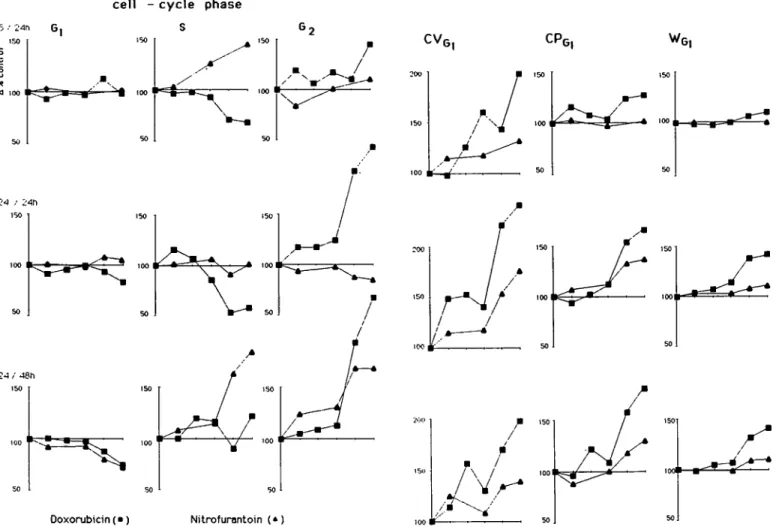
Fig. 3. Drug-induced exposure-response effect of the DNA/protein parameter after treatment with doxorubicin and nitrofurantoin. Control values are set at 100%.
presence of the drug and providing sensitive targets for the potential clastogenic activity of the two test agents. With both drugs, the extension in the recovery period from 24 to 48 h re-sulted in a slight decrease in the CV and protein values. Most likely, after 24 h few additional damaged cells enter the cell cycle to reach the G, phase and give rise to a viable aneuploid cells. After 48 h the fraction of unaffected cells selectively increases. With DX no abnormal position of the G) DNA peak was detectable which could be attributed to the fluorescence of the test compound itself.
Alterations in the cell cycle phases change dramatically depending on the exposure/recovery intervals chosen and the drug used (Figure 3). In all experimental protocols, DX accumulated cells at G2/M phase with a feedback control to S phase. The
increase of S- and G2/M-phase cells induced by NF at the
5/24-h and 24/48-h schedule is probably caused by a release of the cells from the chemically induced cytostatic blockage in the G| phase. More cells then begin to divide and enter the S and G2/M phases with a corresponding decrease in G] phase.
Clearly the effect of DX is longer lasting than that of NF. With both chemicals the increase in cellular protein content (CPGi) and in heterogeneity (WG1 values) is most efficiently
induced after a 24-h exposure/24-h recovery interval; qualitatively, a 5/24-h schedule gives similar results. Exposure of cells to nitrofurantoin under hyperoxic conditions (31 % O2)
or the shortening of the recovery period did not result in increased activity of the chemical (Table HI).
With propranolol, no statistically significant dose-dependent alterations in the cell cycle phase were detected, but an increase in the CVG1 value at the 24/24-h schedule was noted. These
trends were more clearly apparent in experiments with human fibroblasts. Here the drug reduced the contribution of G, phase and increased the CVG, in a dose-dependent way: neither the
CPG, values nor the W values (Table III) were affected. With
practolol, no dose-dependent effect was detectable on any parameter over the entire dose range tested.
Discussion
Binding of fluorochrome to DNA can be influenced by conforma-tional changes in the heterochromatin-DNA complex and this effect can be observed between different cell types in the same animal. Reversible changes are also observed in normal dividing cells in different phases of the cell cycle, e.g. between Go- and
G,-phase cells (Moser et at, 1981). These conformational changes can be induced chemically, possibly by causing a shift of cells from Go to G, phase (Moser and Maier, 1987).
How-ever, in continuous cultures in which cell-density-dependent inhibition is achieved 96 h after seeding (Table II), G0-phase
cells accumulated but CVG1 did not increase significantly (Table
II). Even slightly decreased values derive from the absence of cells just entering the S phase (CVG|) and from the absence of
cells in metaphase (CVG2). So far, no evidence exists to
indi-cate that with our protocols conformational changes in the
Table IV.
Compound
Pattern of changes in the
Type of interaction
DNA and protein histograms
Exposure level obtained by DNA G, two-parameter S flow cytometry G2 24 h after treatment
cv
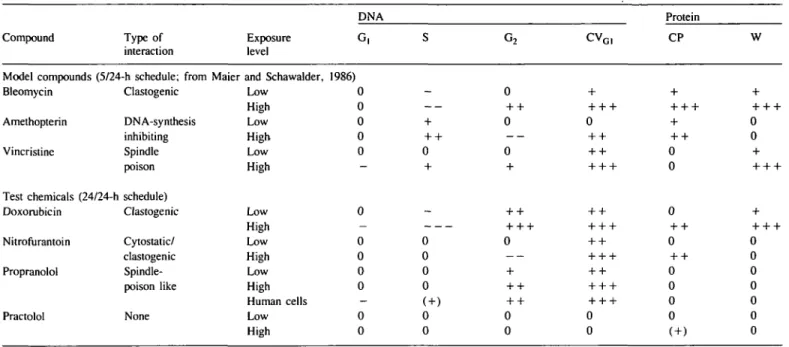
G I Protein CP WModel compounds (5/24-h schedule; from Maier and Schawalder, 1986) Bleomycin Amethopterin Vincristine Test chemicals Doxorubicin Nitrofurantoin Propranolol Practolol Clastogenic DNA-synthesis inhibiting Spindle poison (24/24-h schedule) Clastogenic Cytostatic/ clastogenic Spindle-poison like None Low High Low High Low High Low High Low High Low High Human cells Low High 0 0 0 0 0 0 0 0 0 0 0 0 + + + 0 +
Characterization of dose—response curves: Each + and — represents an exposure level with value (mean) above 115% (+) or below 85% (—) of that of untreated controls and this in the lower (low) or upper (high) exposure range tested.
( ) = trends to be observed.
DNA-chromatin complex contribute to enhanced CV values in the rat cell population.
An attempt was made to classify the four chemicals according to their effects upon the CVG,, cell cycle phase, CPG, and WG,
values (Table IV). Data from the previously tested model compounds bleomycin, amethopterin and vincristine (Maier and Schawalder, 1986) were used as standards. Classification was based on the data obtained after a 24-h exposure/24-h recovery period. Results obtained after a 48-h recovery period probably reflected non-specific recovery phenomena in the cell population rather than the drug-specific response of the cells to the initial insult.
The pattern observed with DX (Tables III and IV) is consistent with the known clastogenic activity of this chemical. G2-phase
blockage confirmed reports on the inhibitory activity of this drug in late S phase (Silvestrini et al., 1970) and in G2 phase
(Wheatley, 1972). The doubling of the CVG1 values is in
agreement with the unusually high frequency of structural chromosome aberrations found in vitro (Vig, 1971). The concomitant increase in the protein content suggests that uncoupling between protein and DNA synthesis might be typical for chemicals which preferentially induce structural chromosome aberrations. This alteration in the nucleus/cytoplasma ratio in G(-phase cells was observed previously with bleomycin (Maier and Schawalder, 1986). Protein synthesis proceeded independent-ly of DNA synthesis and continued until the normal G2 phase
protein level was reached (Table II, Figure 3). The breakdown of this drug-induced effect was seen at the highest exposure level (0.1 jtg/ml). Typically, the DNA parameters are affected (S and G2 phase and CVG), Table II) without evidence of cytotoxicity
(protein leakage).
From CV values obtained with NF, the drug appeared to be metabolized to genotoxic intermediates in the fibroblast-like cells of the granulation tissue. Activation of nitrofurans can occur via the prostaglandin-synthetase pathway (Zenser et al., 1984). This pathway is functional in the fibroblast-like cells used in the present
study (Lang et al., 1986). Prostaglandin synthesis is associated with cell proliferation (Cornwell and Morisaki, 1984) and initiation of DNA synthesis (Otto et al., 1982). It could well be that NF induces, concomitant with the metabolic inhibition of cell proliferation, chromosome aberrations in all cell cycle stages without further progression and accumulation in one particular cell cycle stage. From this synchronous arrest a rapid recovery of non-damaged cells from the cytostatic activity is possible, as suggested by data from cell cycle phases and CV analysis in the 5/24-h and 24/48-h schedules. We can thus postulate that the combined cytostatic and clastogenic activity (CVG1 values) of
the chemical may prevent the progression of aneuploid cells. Such a failure of progression of particular cell types may explain the non-carcinogenic activity of NF (Morris et al., 1969, Yahagi et al., 1974).
The pO2 does not seem to be critical for the metabolic
con-version of NF to mutagenic metabolites. The relatively high effective exposure levels required indicate that in vivo this chemical will most likely exert its mutagenic activity after direct interaction with target tissues. In fact, when given intraperi-toneally to rats, NF caused DNA strand breaks in liver (Russo et al., 1982) but had no effect on micronuclei formation in bone marrow cells (Goodman et al., 1977).
The pattern induced by propranolol in rat and human cells resembles qualitatively that of a spindle poison (Table IV). This could explain why no mutagenic activity was found in bacterial tests while an increased formation of micronuclei in mouse bone marrow was observed (Okine et al., 1983). At an exposure of 3/4 LD50 an increase of nearly 3-fold in the micronuclei
frequency, without interference with the proliferative capacity of the bone marrow cells, was reported (Aruna and Krishna-murthy, 1986). The activity found in our investigation with human cells suggests that they metabolize propranolol more efficiently than rodent cells (Elliott et al., 1984).
Quantitatively, the aneuploidy-inducing activity of propranolol seems to be much weaker than with vinblastin. Differences in
the incidence of chromosomal loss in post-mitotic cells between different spindle poisons are well described. In the micronucleus test, colchicine induces a much lower incidence of micronuclei than the alkaloid vincristine (Maier and Schmid, 1976). This difference in micronucleus-inducing capability could be a con-sequence of the different binding sites of the two chemicals (Dustin, 1984). It is interesting that propranolol exhibits tumour-promoting activity for rat liver (Boyd and Martin, 1977) similar to that of phenobarbital (PB). Also, PB has been reported to interefere with tubulin assembly (Albertini et ai, 1985). However, further data are needed from chemicals with well-characterized interactions with individual steps in the chromo-somal segregation process, in order to investigate the potential correlation between flow data and the mechanisms involved.
In conclusion, the concomitant analysis of cellular protein and DNA content in living Grphase cells by flow cytometry appears
to allow the detection of chemicals which induce numerical and structural aberrations. In addition, the interaction with chromosomal material can be characterized. In a tier approach this information enables the efficient selection of the most suitable additional mutagenicity test for confirmation or risk evaluation. Acknowledgements
This work was supported by the Swiss National Science Foundation contract no. 3.167-0.85.
References
Ahrens.O., Albrecht.U. and Rajewsky.M.F. (1980) Microprocessor-based data acquisition system for flow cytometers. In Laerumt,O.D., Linamot.T. and Thorud,E. (eds), Flow Cytometry IV. Universitetsforlaget, Bergen, pp. 112-115.
Albertini.S., Friedrich,U., Groschel-Steward,U., Zimmermann.F.K. and Wiirgler,F.E. (1985) Phenobarbital induces aneuploidy in Saccharomyces cerevisiae and stimulates the assembly of porcine brain tubulin. Mutat. Res.,
144, 6 7 - 7 1 .
Aruna.N. and Krishnamurthy,N.B. (1986) Mutagenic evaluation of propranolol in somatic and germ cells of mice. Mutat. Res., 173, 207-210. Au,W.W. and Hsu,T.C. (1980) The genotoxic effects of adriamycin in somatic
and germinal cells of the mouse. Mutat. Res., 79, 351-361.
Boyd,H. and Martin.T.J. (1977) The effect of propranolol on the induction of rat liver tumors by a chemical carcinogen. Mol. Pharmacol., 13, 576—578. Bradford,M. (1976) A rapid and sensitive method for the quantitation of microgram quantities of protein utilizing the principle of protein dye binding. Anal. Biochem., 72, 248-254.
Cohen.S.M., Ertiirk,E., von Esch.A.M., Crovetti.A.J. and Bryan,G.T. (1973) Carcinogenicity of 5-nitrofurans, 5-nitroimidazoles, 4-nitro benzenes and related compounds. J. Natl. Cancer Inst., 51, 403-417.
Comwell,D.G. and Morisaki,N. (1984) Fatty acid paradoxes in the control of cell proliferation: prostaglandins, lipid peroxides and cooxidation reactions. In Pryor,W.A. (ed.), Free Radicals in Biology. Academic Press, New York, Vol. VI, pp. 95-148.
Dustin,P. (1984) Microtubules. 2nd edn. Springer Verlag, Berlin.
Elliott,G.R., Amos.H.E. and Bridges,.!.M. (1984) The effect of practolol, in vitro generated metabolites of practolol and chemical analogues on the rate of growth of human skin fibroblasts. ATLA, 12, 8 9 - 9 7 .
Goodman.R.G., Hakkinen,P.J., Nemenzo.J.H. and Vore.M. (1977) Mutagenic evaluation of nitrofuran derivatives in Salmonella typhimurium, by the micronucleus test and by in vivo cytogenetics. Mutat. Res., 48, 295-306. Gray,J.W. and Dean.P.N. (1980) Display and analysis of flow cytometric data.
Anna. Rev. Biophys. Bioeng., 9, 509-539.
Hacker-Klom,U.B., Meistrich,M.L. and G6hde,W. (1986) Effect of doxorubicin and 4'-epi-doxorubicin on mouse spermatogenesis. Mutat. Res., 160, 39—46. Krishan.A. and Ganapathi.R. (1980) Laser flow cytometric studies on intracellular
fluorescence of anthracyclines. Cancer Res., 40, 3895-3900.
Krishan.A., Sauerteig,A. and Gordon.K. (1985) Effect of amphotericin B on adriamycin transport in P388 cells. Cancer Res., 45, 4097-4102. Lang.B., Frei,K. and Maier.P. (1986) Prostaglandin synthetase dependent aldrin
epoxidation in hepatic and extrahepatic tissues of rats. Biochem. Pharmacol.,
35, 3643-3645.
Maier,P. and Schmid,W. (1976) Ten model mutagens evaluated by the micronucleus test. Mutat. Res., 40, 325-338.
Maier,P. (1984) The granuloma pouch assay. In de Serres,F.J. (ed.), Chemical Mutagens, Principles and Methods for their Detection. Plenum Press, New York, Vol. 9, pp. 233-260.
Maier.P. and Schawalder.H.P. (1986) A two parameter flow cytometry protocol for the detection and characterization of the clastogenic, cytostatic and cytotoxic activity of chemicals. Mutat. Res., 164, 369-379.
Maier,P. Schawalder.H.P. and Weibel,B. (1987) Low oxygen tension, as found in tissues in vivo, alters the mutagenic activity of aristolochic I and II in primary fibroblast like rat cells in vitro. Environ. Mutagenesis, 10, 275-284. McCalla,D.R. (1983) Mutagenicity of nitrofuran derivatives: review. Environ.
Mutagenesis, 5, 745—765.
MorrisJ.E., PriceJ.M., LalichJ.J. and Stein.R.J. (1969) The carcinogenic activity of some 5-nitrofuran derivatives in the rat. Cancer Res., 29, 2145—2156. Moser.G., Fallon,R.J. and Meiss,H.K. (1981) Fluorimetric measurements and chromatin condensation patterns of nuclei from 3T3 cells throughout G|. J. Cell. Physiol., 106, 293-301.
Moser.G. and Maier,P. (1987) Distinction between the Go and the late G, phase of the rat cells in vivo and in vitro with the nuclear QDH-fluorescence pattern. Eur. J. Cell Bid., 44, 156-160.
Okine,L.K.N., Ioannides,C. and Parke.D.V. (1983) Studies on the possible mutagenicity of/3-adrenergic blocker drugs. Toxicol. Lett., 16, 167 — 174. Otto,F.J., Oldiges,H., Gohde.W. and Jain.V.K.. (1981) Flow cytometric measurement of nuclear DNA content variations as a potential in vivo mutagenicity test. Cytometry, 2/3, 189-191.
Otto.A.M., Nilson-Hamilton,M.N., Boss,B.D., Ulrich,M.O. and De Asua.L.D. (1982) Prostaglandins E, and E2 interact with prostaglandin F2 a to regulate initiation of DNA replication and cell division in Swiss 3T3 cells. Proc. Natl. Acad. Sci USA, 79, 4992-4996.
Russo,P., Pala.M., Nicolo.G., Santi.L. and Parodi.S. (1982) DNA damage in liver of rats treated with nitrofurantoin. Mutat. Res., 105, 377-382. Shirai,T. and Wang.C.Y. (1980) Enhancement of sister-chromatid exchanges in
Chinese hamster ovary cells by nitrohirans. Mutat. Res., 79, 345—350. Siebert.D., Bayer,U. and Marquardt.H. (1979) The application of mitotic gene
conversion in Saccharomyces cerevisiae in a pattern of four assays, in vitro, in vivo, for mutagenicity testing. Mutat. Res., 67, 145—156.
Silvestrini,R., Di Marco,A. and Dasdia.T. (1970) Interference of daunomycin with the metabolic events of the cell cycle in synchronized cultures of rat fibroblasts. Cancer Res., 30, 966-973.
Stohr,M., Vogt-Schaden,M., Knoblauch,M., Vogel,R. and Futterman.G. (1978) Evaluation of eight fluorochromes combinations for simultaneous DNA-protein flow analysis. Stain Technol, 53, 205-215.
Vig.B.K. (1971) Chromosome aberrations induced in human leukocytes by the antileukemic, antibiotic adriamycin. Cancer Res., 31, 32—38.
Vig,B.K. (1977) Genetic toxicology of mitomycin C, actinomycins, daunomycin and adriamycin. Mutat. Res., 39, 189-238.
Wheatley,D.N. (1972) Action of Adriamycin on He-La cells: evidence of a G2 inhibition. Proc. Int. Symp. Adriamycin, 1971, pp. 47—52.
Wright.P. (1975) Untoward effects associated with practolol administration: Oculomucocutaneous syndrome. Br. Med., 1, 595-598.
Yahagi,T., Nagao.M., Hara,K., Matsushima,T., Sugimura,T. and Bryan,G.T. (1974) Relationship between the carcinogenic and mutagenic or DNA-modifying effects of nitrofuran derivatives, including 2-(2-furyl)-3-(5-nitro-2-furyl) acrylamide, a food additive. Cancer Res., 34, 2266-2273.
Yahagi,T., Matsushima,T. and Nagao.M. (1976) Mutagenicities of nitrofuran derivatives on a bacterial tester strain with R-factor plasmids. Mutat. Res.,
40, 9 - 1 4 .
Zenser.T.V., Palmier.M.O., Mattammal.M.B. and Davis.B.B. (1984) Metabolic activation of the carcinogen /V-[4-(5-nitro-2-furyl)-2-thiazolyl] acetamide by prostaglandin H synthetase. Carcinogenesis, 5, 1225-1230.
![Fig. 2. Analysis of cellular DNA and protein content, (a) Gate for protein analysis in G, cells defined in the contour plots, (b) Analysis of DNA parameters [coefficient of variation of G r phase cells (CV GI ) and G r , S- and G 2 -phase calculations] fr](https://thumb-eu.123doks.com/thumbv2/123doknet/14902301.654257/3.910.212.722.71.853/analysis-cellular-analysis-analysis-parameters-coefficient-variation-calculations.webp)