Modeling crack propagation in wood and wood composites.
A review
COST Action E35 2004–2008: Wood machining – micromechanics and
fracture
Eric N. Landis1,* and Parviz Navi2
1Department of Civil and Environmental Engineering,
Center for Advanced Engineered Wood Composites, University of Maine, Orono, ME, USA
2Bern University of Applied Sciences, Biel, Switzerland
*Corresponding author.
Department of Civil and Environmental Engineering, Center for Advanced Engineered Wood Composites, University of Maine, Orono, ME 04469, USA
E-mail: landis@maine.edu Abstract
Predictive simulation of crack growth and fracture of wood and wood composites has always been difficult, and it has been limited by the availability of appropriate fracture models. As summarized herein, progress has been made on several fronts. First, a variety of fictitious crack model refinements have been made, along with the corresponding effects on bulk load-deformation response and R-curve behavior. Second, progress has been made on several different discrete element approaches that can explicitly represent material hetero-geneity and variability. While progress has been substan-tial, a universal fracture law for wood remains elusive.
Keywords: fictitious crack; fracture; interface element;
lattice model; material point method; R-curve.
Introduction
The formation and propagation of cracks in wood has been and continues to be an important topic of interest in a number of wood science and engineering related disciplines. In structural engineering, crack growth is central to ultimate failure load, while in wood machining, crack growth properties dictate the energy required for machine operation and tool wear. For the past 50 years, principles of fracture mechanics have been developed to address the shortcomings of traditional stress-based fail-ure criteria. Specifically, fractfail-ure mechanics theory pro-vides us with an analytical framework to relate material strength to the cracks and flaws that are known to con-trol ultimate load carrying capacity.
While fracture mechanics is a powerful tool to develop predictive crack growth models, refinements and advances have been made on a number of other prom-ising fronts. This paper is a review of some recent advances that improve the prediction and analysis of crack growth in wood and wood composites. First, a
brief review of recent developments in analytical fracture mechanics and the numerical tools will be presented which open the way for new techniques. Second, the focus will be on several promising new paradigms for representing crack growth in wood. The common aspect of these newer approaches is that the complexity of the material microstructure is incorporated directly into the model, avoiding some of the pitfalls of conventional frac-ture theory.
Developments in nonlinear fracture models
Fracture mechanics principles were first applied to wood in the 1960s in the form of linear elastic fracture mechan-ics. More comprehensive reviews can be found in papers of Smith et al. (2003) and Conrad et al. (2003). Early rec-ognition of geometry dependence on measured fracture parameters limited advancements until the 1980s with the emergence of nonlinear fracture models. Since that time, there have been a significant number of applica-tions of fictitious crack models (Hillerborg et al. 1976; Hillerborg 1991), where cracks are represented as having closing stresses that act as a function of crack face sep-aration distance, as illustrated in Figure 1. The Figure shows both the configuration of the closing stresses as they relate to the faces of the crack front, as well as a potential relationship between closing stress and crack opening. The model is simple and elegant in the way nonlinearities of different sorts (material, geometric) are lumped into the closing stress function. In addition, the fracture energy of the system is easily predicted from the area under the closing stress versus crack opening function.
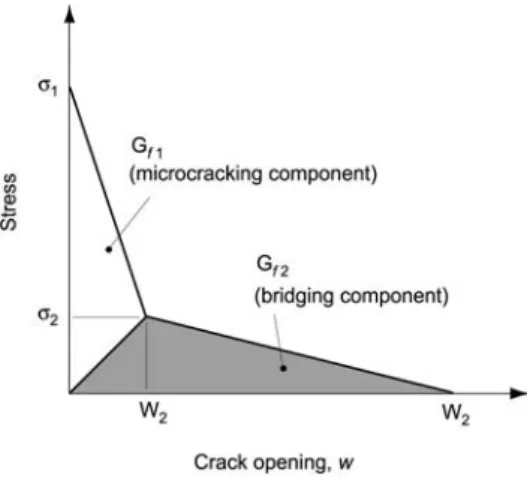
Fictitious crack models were applied to wood by Bos-trom (1992), who determined post-peak softening para-meters and fracture energy for pine. Stanzl-Tschegg et al. (1995) developed a wedge-splitting test procedure along with a finite element analysis of the crack tip to separate ‘‘microcracking’’ from ‘‘crack bridging’’ contri-butions to fracture energy. An important finding was that the bridging component in the RL direction was signifi-cantly higher than that in the TL direction due to the pres-ence of ray cells normal to the crack plane. This bilinear representation of the softening curve, along with the sep-aration of mechanisms is illustrated in Figure 2.
A variation of a fictitious crack approach was used by Vasic and Smith (2002), who proposed a crack bridging model based on in situ scanning electron microscope observations. The bridging model differs from the ficti-tious crack in the way the stress singularity is treated.
Figure 1 Illustration of fictitious crack concepts: crack tip clos-ing stresses (left) and stress-crack openclos-ing relationships (right).
Figure 2 A bilinear stress-crack opening relationship illustrat-ing the separation of microcrackillustrat-ing and bridgillustrat-ing components (following Stanzl-Tschegg et al. 1995).
Figure 3 Examples of different stress-crack opening relation-ships used in recent finite element simulations of crack growth. (a) Bilinear and (b) trilinear, as used by Dourado et al. (2004), (c) linear, as used by Coureau et al. (2006a), and nonlinear, as employed by Schmidt and Kallske (2007).
Specifically, the stress singularity at the crack tip pre-dicted by linear elastic fracture mechanics can exist in a bridging model. However, bridging stresses occur on the crack faces close to the crack tip. The strength of the bridging stresses can determine whether fracture is brit-tle, quasi-brittle or ductile. Measurements by Vasic and Smith, made through a combination of finite element modeling and SEM experimental observations, led to an estimate of a 4-mm bridging zone length in eastern Canadian spruce. An important aspect of this finding is that 4 mm is also a typical tracheid length for that spe-cies, thus providing an intrinsic material length scale to a continuum fracture model.
Finite element implementations of interface fracture
For finite element implementations of fracture, it is often convenient to introduce a crack interface element to rep-resent the closing stresses induced by bridging or other toughening mechanisms. The interface properties of these interface elements are based on the concepts of fictitious crack or crack bridge models described above, and they have been the focus of much recent wood frac-ture modeling research, as detailed below.
Dourado et al. (2004) used both bilinear and trilinear constitutive relationships for crack interface elements, as shown in Figure 3a and b. In both implementations, crack propagation occurs when peak tensile stress is reached. In the bilinear approach, a linear ascending portion is fol-lowed by a linear softening portion, as opposed to the bilinear softening relationship shown in Figure 2. In the trilinear approach, the softening is broken down into
microcracking and bridging phenomena, as described above. Their conclusion was that there was no improve-ment in the predictive abilities of a trilinear over a bilinear softening model in predicting the fracture performance of specially prepared mode I pine specimens.
In a parallel study of mode II fracture, Silva et al. (2004) used a bilinear stress-crack opening displacement rela-tionship for crack interface elements. The model used measured values of GICand GIICas inputs, along with a
mode interaction relationship to take into account mixed mode effects. Through their analysis they found that crack face friction is negligible.
Coureau et al. (2006a) employed an elastic layer ele-ment in a finite eleele-ment representation of wood fracture. A simple linear elastic relationship was used to represent the cohesion in the fracture plane. The model recognizes that the two most important properties of the cohesive zone are the tensile strength, st, and the overall fracture energy, Gf. The specific shape of the curve is less impor-tant, thus a linear elastic relationship is used for simplic-ity, as shown in Figure 3c. The model was able to match laboratory measurements under a variety of loading configurations.
Schmidt and Kallske (2007) also explored interface ele-ments for finite element representation of fracture. In their case, a three-dimensional anisotropic constitutive rela-tionship was implemented that could incorporate dam-age and load history. To accomplish this, a nonlinear, continuous, softening stress-crack opening function was used (Figure 3d). When the material is damaged, the function shifts to a progressively lower stiffness value, while a history variable tracks the current state of the stress-deformation relationship. The model was found to be well suited for simulating laboratory measurements of fracture and damage, including realistic unloading and reloading behavior.
The common theme in these studies is the use of a crack interface element that can account for the nonlin-earities observed in cross grain fracture of wood. The different modeling approaches are all built upon a nonlin-ear fracture mechanics basis. As such, they benefit from the computational conveniences that a continuum
frame-work provides. As discussed below, alternate modeling approaches are emerging that break away from a contin-uum framework. These approaches may be better able to represent material heterogeneity; however, they come at significant computational expense.
R-curve models
An alternative approach to fracture energy was examined by Morel et al. (2003) following the work of Bouchaud (1997) and others, who have tied crack resistance or R-curve behavior to the roughness of fracture surfaces. Spruce specimens were tested in three different mode I configurations: double cantilever and two tapered double cantilever beams. For each, fracture energy was esti-mated by dividing the incremental elastic energy released during a small crack extension event. Rising R-curve behavior (increasing fracture energy as a function of crack length) was found for the three specimen types. In addition to the bulk fracture measurements, the crack surface topography was measured using an optical pro-filer and from this measurement a roughness exponent was determined. A model of the form was proposed,
c(y)
Gs2g
L
where G is fracture energy, g is the specific surface ener-gy of the material, and c(y)/L is a roughness multiplier based on the roughness exponent of the fracture surface. As the crack grows, the developing roughness changes, leading to an increase in incremental fracture energy. Thus, an R-curve can be determined from roughness properties. The work is significant because it seeks to establish a fundamental basis for fracture toughness. In this case, the roughness exponent can be related to the microstructural features that cause different roughness characteristics.
Specific connections between R-curve behavior and bulk fracture properties were made by Coureau et al. (2006b), who examined the effect of different crack clos-ing relationships on fracture properties of simulated dou-ble cantilever beam specimens. They were adou-ble to carry out a parametric study to examine the effect of the crack closing stress function on the load-crack opening dis-placement function and the R-curve. This study led to important quantitative relationships between the three functions.
Morphological-based models
In the following section, alternative ways to represent wood materials and fracture will be addressed. As allud-ed to above, fracture models that are basallud-ed on traditional fracture mechanics rely on a continuum representation of materials. While continuum mechanics has been the backbone of structural mechanics for over 200 years, its limitations become apparent when we attempt to repre-sent a complex material, such as wood. The combination of microstructural heterogeneity and statistical variability, as well as the wide range of length scales over which wood exhibits heterogeneity and variability make it
diffi-cult to model even simple material behavior. As crack growth and fracture of wood are affected by so many microstructural features, the available instrumentation does not permit to represent all these features in a way that can properly simulate the wide range of observed wood behavior.
That said, below are several recent attempts to capture wood fracture behavior by representing the material in a way that closely resembles the actual morphology of the wood structure. The philosophy behind a morphology-based model is that the best way to capture complex and variable behavior is to base the model on the phys-ical structure of the material. If one is successful in accu-rately representing fundamental microstructure-property relationships, then observed bulk phenomena, such as size effects, strain softening and anisotropic damage, will be implicit predictions of such a model.
Lattice models
The use of lattices to represent heterogeneous materials has its roots in statistical physics (Herrmann and Roux 1990). Essentially, the material is represented by a net-work of lattice elements. The elements can be springs or beams, and their strength and stiffness properties can be randomly or spatially distributed throughout the material. As a load is applied at the boundaries of the medium, forces are distributed through the array of lattice ele-ments in such a way that satisfies equilibrium of the sys-tem. Increasing the bulk load or deformation can cause rupture of individual elements, although the medium as a whole can remain intact. In this representation, material damage is exhibited through broken elements.
Lattices are a particularly effective way to represent a heterogeneous medium, because disorder is introduced into the material via both the geometry of the lattice net-work and the distribution of element properties. Non-local damage is represented by broken elements distributed throughout the material, while fracture is rep-resented by a local concentration of ruptured elements. The method has been successfully applied to concrete (van Mier et al., 2002), where different microstructural features (cement matrix and aggregate) were explicitly represented by different element properties.
Applications to wood were done by Landis et al. (2002) and Davids et al. (2003), whose two-dimensional lattice contained separate element types to represent longitu-dinal and transverse properties of the material. The ele-ments were simple springs, each having a statistically introduced stiffness and strength. The failure criteria of an individual element were simple: elements failed when they exceeded the predetermined maximum force. Very good quantitative agreement was made between the load-deformation predictions of the model and the notched and unnotched spruce RL fracture specimens of Vasic (2000). The model also provided a good quali-tative representation of the microcracking damage and crack bridging observed in the experiments.
More recently, Fournier et al. (2007) introduced addi-tional morphological features into a wood lattice model. Specifically, earlywood and latewood were explicitly rep-resented in the lattice. Element properties were assigned based on typical ratios between earlywood and latewood
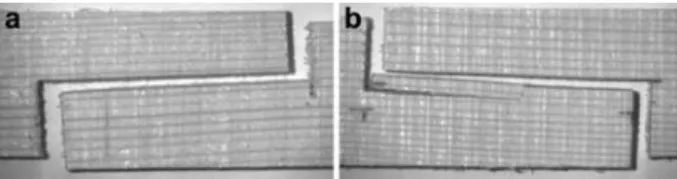
Figure 5 Two different failure modes in RL shear. Shear stress-es are induced by pulling the specimen in tension parallel to the grain. Depending on the depth of notches cut in the specimen, failure can either extend along a single failure plan (a), or can initiate along two failure plans, with one emerging as the final failure plane (b).
Figure 4 Lattice irregularities proposed by Fournier et al. (2007). Lattice shows different properties for earlywood and latewood, as well as deviations from a perfectly straight grain.
strength and stiffness properties. The explicit represen-tation of earlywood and latewood was necessary to account for observations of fracture patterns that are dominated by the behavior at the earlywood-latewood boundary. This includes longitudinal tension, where split-ting along the boundary can redirect transverse tensile cracks, or RL shear, where the presence of the boundary can confine the crack to a specific cleavage plane. The second morphological feature to be added by Fournier et al. was the local deviation from a perfectly straight grain that is observed in real wood. The addition of this local grain variation was a simple way to introduce addi-tional variability into the model. This was found to be critical, because model specimens with a regular lattice get larger, the variability decreases due to statistical homogenization (Fournier et al. 2003). The variability introduced by the grain alignment variation produced appropriate property variability even in larger specimens. The earlywood-latewood variation and the grain align-ment variations are illustrated in Figure 4.
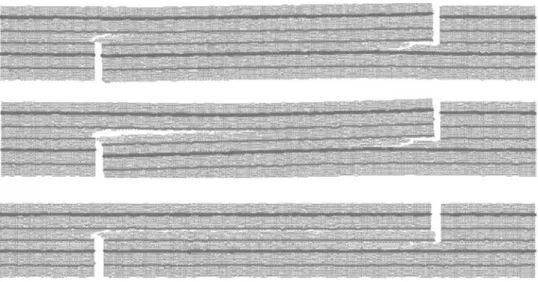
An important feature to emerge from Fournier’s work is the ability to randomly predict different failure modes along with the corresponding change in bulk load-defor-mation behavior. This is illustrated here with the example of RL shear fracture, where two different failure patterns are presented in Figure 5. As visible in the Figure, when a shear stress is introduced along the grain between the two saw-cut notches, failure is dictated by whether or not the shear cracks, which initiate from either notch, are within the same zone of earlywood. If so, a clean fracture plane is produced (Figure 5a). If the two initial shear cracks are on opposite sides of an earlywood-latewood boundary, it is typical that only one will propagate all the way from one notch to the other, with the other crack being arrested somewhere between the notches, as demonstrated in Figure 5b. An example simulation of the latter case is shown in Figure 6, where shear cracks propagate from both notches, but only one progresses all the way between the notches. It is important to note that the corresponding load-deformation behavior of these two cases is quite different. The first case produc-es an abrupt, brittle failure, while the second case pro-duces a much more ductile failure. The lattice model can simulate either case with very good accuracy.
The mesh dependencies with a lattice representation of the material should be emphasized. However, these should not be viewed in the same context as mesh dependencies of conventional finite element methods. In the spirit of a morphologically-based model, it can be envisioned that – if the lattice adequately represents material microstructure – the mesh dependencies are in
fact material dependencies and not model artifacts. In the example presented above, the most critical mesh dependency introduced was the size of the lattice mesh. In a compromise between model tractability and fidelity, a basic longitudinal lattice element was 0.4 mm long, while a transverse (radial) element was 0.2 mm. This ena-bled the authors to simulate large numbers of laboratory sized specimens necessary for a reasonable statistical analysis of results. Because the element properties are calibrated to a specific size specimen, the element sizes must remain fixed. Simulation of larger specimens then requires a greater number of elements. As a result, tra-ditional mesh convergence studies are not relevant, because a smaller mesh necessitates elements of differ-ent properties.
Wittel et al. (2005) used a lattice to simulate wood frac-ture at a much finer scale. Following the cellular strucfrac-ture introduced for wood by Gibson and Ashby (1988) and modeled numerically by Persson (2000), Wittel et al. examined fracture in the RT and TR planes by means of beam elements that could fail either by tension or flexure. Separation or debonding of cell walls from each other was represented by tensile failure of tangentially oriented elements, while cell wall rupture required a combination of tensile and flexural rupture. The authors were able to simulate microstructural damage in RT and TR planes due to tensile loads, in addition to transverse splitting cracks induced by nail penetration. At the scale of their model, they were able to capture damage mechanisms other than cracking, such as cell wall buckling and collapse.
Therefore, all of the lattice models described are far to be two-dimensional. A recent advance in lattice appli-cations to wood came from Sedighi-Gilani and Navi (2007), who developed a three-dimensional lattice model using a mixture of beam elements for the longitudinal and transverse directions, as illustrated in Figure 7. The basic elements were small enough to represent individual cells.
Figure 6 Simulation of the type of shear failure photographed in Figure 5b. Cracks initiate along different earlywood zones, with final failure occurring when one of the two cracks (in this case the one starting from the left) propagates all the way to the opposite notch.
Figure 7 Three-dimensional lattice representation introduced by Sedighi-Gilani and Navi (2007). The lattice is composed of simple beam elements for transverse directions and hollow box beams for the longitudinal direction.
Thus, earlywood cells were represented by beams of 40=40mm in cross section, while latewood beams were 20=40mm in cross section. The wall thicknesses were 2mm and 6mm, respectively. The small size of the basic lattice elements made it necessary to couple the lattice model with a conventional elastic continuum based finite element model to simulate a laboratory size specimen. This is appropriate in that the geometry considered (a notched tension specimen) has damage confined to a relatively narrow band. The lattice can thus be confined to this narrow band. Using the hybrid lattice-continuum approach, they were able to obtain excellent agreement with the RL tension laboratory tests of Vasic (2000).
Once their model was tuned to experimental data, Sedighi-Gilani and Navi could examine specific micro-structural features predicted by the model. These fea-tures included microcrack and crack bridge distributions. Crack trajectories matched that of microscopic measure-ments, and most importantly, they were able to match specific points on the load-deformation curve with the level of microstructural damage simulated in the model.
It is remarkable that the scale of this lattice model allows a direct correspondence between the model ele-ment and the microstructure of the wood. Such an advancement could now lead to direct measurement of lattice element properties through sophisticated micro-mechanical measurements of wood fibers.
One other recent application of a lattice model worth mentioning here was conducted by Snow (2006), who integrated a lattice into a hybrid continuum/discrete
ele-ment model to simulate the performance of engineered wood products used in bolted connections. The lattice was adopted because it does not require the presence of a predefined crack or notch as is necessary for tra-ditional fracture mechanics applications. Coupling the lattice with a continuum is necessary, however, to make the model tractable practical sizes required for the engi-neering application.
Material point model
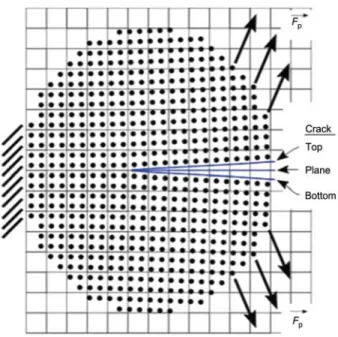
One promising method to account for material hetero-geneity and complexity in crack growth problems is the material point method (MPM). MPM was applied to frac-ture problems by Guo and Nairn (2006) and specifically to wood by Nairn (2007). In this method, the solid mate-rial is discretized into an array of points, where each point can be assigned specific material properties, such as stiffness and toughness. A mechanical test simulation is conducted through a series of time steps where in each step the point properties, such as position, velocity and stress, are calculated by imposing the current point prop-erties onto a background grid for computation. As illus-trated in Figure 8, material boundary conditions are imposed on the points. The background grid (also shown in the Figure) is for calculations only, thus all relevant properties are defined at the points. For fracture, cracks are represented by a massless crack particle.
Nairn (2007) used this model to simulate TR fracture. Material morphology was determined by matching model points to pixel in a two-dimensional digital image, an example of which is shown in Figure 9. Dark pixels in the image were assigned to be latewood, while light pixels were assigned to be earlywood. Stiffness and toughness properties were assumed to be homogeneous within the layer, and the morphology was quite realistic. In the sim-ulation of TR fracture, end displacements were enforced, and a crack propagated from a preset notch. In this work, a critical energy release rate criterion was used and was determined using a J-integral analysis at the crack tip. Figure 9 illustrates example simulations of a crack prop-agating away from the pith and a crack propprop-agating
Figure 8 Illustration of material points and grid used in the material point method (from Nairn 2007).
Figure 9 Illustration of TR fracture using material point method. Crack is propagating away from the pith (left) and towards the pith (right) (from Nairn 2007).
towards the pith. Of note, here is how the model was able to capture the crooked crack paths we normally see in experiments. Since the individual growth rings were homogeneous, the primary source of the crack path tor-tuosity was the non-uniform stress field created by the growth rings.
Conclusions
At the time of this writing, the establishment of universal fracture models for wood was out of range. Non-linear fracture mechanics is a useful tool for many situations; however, the techniques suffer from the usual continuum mechanics limitations, such as the difficulty incorporating material heterogeneity and variability. Discrete element computational approaches can overcome some of the traditional fracture mechanics limitations. However, cur-rent limitations both in knowledge of microstructure-property relationships and capacity to solve large problems diminish the usefulness to small laboratory scale applications.
However, some of the advances discussed here illus-trate the progress that is being made. New micromecha-nical techniques becoming available, such as in situ environmental scanning electron microscopy, will
quan-tify the toughening mechanisms already known and may reveal new mechanisms. Coupled with always increasing computational capabilities, these new techniques will facilitate to answer the seemingly simple question: ‘‘How strong is it?’’ In the mean time, hybrid techniques offer the best prospect for predictive simulation of fracture and failure of wood and wood structures.
References
Bostrom, L. (1992) Method for determination of the softening behavior of wood and applicability of a nonlinear fracture mechanics model. Report TVM-1012, Lund University, Lund, Sweden.
Bouchaud, E. (1997) Scaling properties of cracks. J. Phys.: Condens. Matter 9:4319–4344.
Conrad, M.P.C., Smith, G.D., Fernlund, G. (2003) Fracture of sol-id wood: a review of structure and properties at different length scales. Wood Fiber Sci. 35:570–584.
Coureau, J.-L., Gustafsson, P.J., Persson, K. (2006a) Elastic lay-er model for application to crack propagation problems in timber engineering. Wood Sci. Technol. 40:275–290. Coureau, J.-L., Morel, S., Gustafsson, P.J., Lespine, C. (2006b)
Influence of the fracture softening behavior of wood on load-cod curve and R-curve. Mater. Struct. 40:97–106.
Davids, W.G., Landis, E.N., Vasic, S. (2003) Lattice models for the prediction of load-induced damage in wood. Wood Fiber Sci. 35:120–134.
Dourado, N., de Moura, M.F.S.F., Morel, S., Valentin, G., Morais, J. (2004) A finite element simulation of the SENB test with crack propagation. In: Proceedings of the Third International Conference of the European Society for Wood Mechanics, Vila Real, Portugal. Eds. Morlier, P., Morais, J. pp. 67–76. Fournier, C.R., Landis, E.N., Davids, W.G. (2003) Modeling scale
effects in wood with lattice models. In: Proceedings of the 16th ASCE Engineering Mechanics Conference, Seattle, WA, USA. Ed. Turkiyya, G.
Fournier, C.R., Davids, W.G., Nagy, E.N., Landis, E.N. (2007) Morphological lattice models for the simulation of softwood failure and fracture. Holzforschung 60:360–366.
Gibson, L.J., Ashby, M.F. Cellular Solids – Structure and Prop-erties. Pergamon Press, Oxford, UK, 1988.
Guo, Y., Nairn, J.A. (2006) Three-dimensional dynamic fracture analysis using the material point method. Comput. Model. Eng. Sci. 16:141–156.
Herrmann, H.J., Roux, S. Statistical Models for the Fracture of Disordered Media. North-Holland, Amsterdam, 1990. Hillerborg, A. (1991) Application of the ficticious crack model to
different types of materials. Int. J. Fracture 51:95–102. Hillerborg, A., Modeer, M., Petersson, P.E. (1976) Analysis of
crack formation and crack growth in concrete by means of fracture mechanics and finite elements. Cem. Concr. Res. 6:773–782.
Landis, E.N., Vasic, S., Davids, W.G., Parrod, P. (2002) Coupled experiments and simulations of microstructural damage in wood. Exp. Mechanics 42:389–394.
Morel, S., Mourot, G., Schmittbuhl, J. (2003) Influence of the specimen geometry on R-curve behavior and roughening of fracture surfaces. Int. J. Fracture 121:23–42.
Nairn, J.A. (2007) Material point method simulations of trans-verse fracture in wood with realistic morphologies. Holzfor-schung 61:375–381.
Persson, K. (2000) Micromechanical modelling of wood and fibre properties. Doctoral thesis, Lund University, Lund, Sweden. Schmidt, J., Kallske, M. (2007) Simulation of cracks in wood
using a coupled material model for interface elements. Holz-forschung 61:382–389.
Sedighi-Gilani, M., Navi, P. (2007) Micromechanical approach to wood fracture by three-dimensional mixed lattice-continuum model at fiber level. Wood Sci. Technol. 41:619–634. Silva, M.A., de Moura, M.F.S.F., Morais, J.L. (2004) Numerical
analysis of the ENF test on the mode II fracture of wood. In: Proceedings of the Third International Conference of the European Society for Wood Mechanics, Vila Real, Portugal. Eds. Morlier, P., Morais, J. pp. 67–76.
Smith, I., Landis, E.N., Gong, M. Fracture and Fatigue in Wood. John Wiley & Sons, West Sussex, UK, 2003.
Snow, M. (2006) Fracture development in engineered wood product bolted connections. Doctoral thesis, University of New Brunswick, New Brunswick, Canada.
Stanzl-Tschegg, S.E., Tan, D.M., Tschegg, E.K. (1995) New split-ting method for wood fracture characterization. Wood Sci. Technol. 29:31–50.
van Mier, J.G.M., van Vliet, M.R.A., Wang, T.K. (2002) Fracture mechanisms in particle composites: statistical aspects in lat-tice type analysis. Mech. Mater. 34:705–724.
Vasic, S. (2000) Applications of fracture mechanics to wood. Doctoral thesis, University of New Brunswick, New Bruns-wick, Canada.
Vasic, S., Smith, I. (2002) Bridging crack model for fracture of spruce. Eng. Fract. Mech. 69:745–760.
Wittel, F.K., Dill-Langer, G., Kro¨plin, B.-H. (2005) Modeling of damage evolution in soft-wood perpendicular to grain by means of a discrete element approach. Comp. Mat. Sci. 32: 594–603.
Received April 15, 2008. Accepted July 7, 2008. Previously published online August 13, 2008.