Dynamics of Brain Activation During an Explicit Word
and Image Recognition Task: An Electrophysiological
Study
Asaid Khateb*
+, Alan J. Pegna*
+, Christoph M. Michel
+^, Theodor Landis
~, and Jean-Marie
Annoni*
Summary: Recent brain imaging studies suggest that semantic processing of words and images may share a common neural network, although mo-dality-specific activation can also be observed. Other studies using event-related potentials (ERPs) report that brain responses to words and images may already differ at ~150 ms following stimulus presentation. The question thus remains, which differences are due to perceptual categorization pro-cesses and which differences are due to the semantic ones? Using ERP recordings and spatio-temporal source localization analysis, we investigated the dynamics of brain activation during a recognition task. The stimuli consisted of a randomized set of verbal (words vs. non-words) and pictorial items (line drawings of objects vs. scrambled drawings). After each stimulus, subjects had to decide whether it corresponds to a recognizable word or objects. ERP map series were first analyzed in terms of segments of quasi-stable map topography using a cluster analysis. This showed that verbal and pictorial stimuli elicited different field patterns in two time segments between ~190-400 ms. Before and after this period, map patterns were similar be-tween verbal and pictorial conditions indicating that the same brain structures were engaged during the early and late steps of processing. Source lo-calization analysis of map segments corresponding to the P100 and the N150 components first showed activation of posterior bilateral regions and then of left temporo-posterior areas. During the period differentiating conditions, other patterns of activation, involving mainly left anterior and pos-terior regions for words and bilateral pospos-terior regions for images, were observed. These findings suggest that, while sharing an initial common net-work, recognition of verbal and pictorial stimuli subsequently engage different brain regions during time periods generally allocated to the semantic processing of stimuli.
Key words: Event-related potentials; Map series; Human brain mapping; Temporal segmentation; Source localization; Distributed source.
Introduction
During the last few years, studies using brain imag-ing techniques have allowed for a better identification of
the brain regions involved in the semantic processing of words and images. The main results reported by such studies pointed to the existence of a largely distributed neural network mainly localized in the left hemisphere (LH). This involved temporal, occipital but also frontal re-gions (Binder et al. 1997; Perani et al. 1999; Demb et al. 1995; Démonet et al. 1992; Frost et al. 1999; Pugh et al. 1996; Vandenberghe et al. 1996). Direct comparison of the brain regions involved in the processing of words and im-ages indicated that a common neural network is activated by both words and images (Menard et al. 1996; Perani et al. 1999; Vandenberghe et al. 1996), although modal-ity-specific activations were also observed. In particular, common activations were shown in the left fusiform and middle temporal gyri (Perani et al. 1999; Vandenberghe et al. 1996), while specific ones involved the left inferior pa-rietal lobule for words and the right middle occipital gyrus for pictures (Vandenberghe et al. 1996).
Indications regarding the time course of these differ-ent and common activations have been provided by ex-periments where event related potentials (ERP) were compared between word and image stimuli. In an initial study, implicit visual perceptual categorization processes
* Neuropsychology Unit, Department of Neurology, University Hospital, Geneva.
+Functional Brain Mapping Laboratory, Department of
Neurol-ogy, University Hospital, Geneva.
^ Plurifaculty Program of Cognitive Neuroscience, University of Geneva, Geneva.
~Department of Neurology, University Hospital, Geneva.
Accepted for publication: September 27, 2001.
This research was supported by the Swiss National Science Foun-dation grant No. 31-61680-00 to J.M. Annoni and the "Programme commun de recherche en génie biomédicale 1999-2002" to C.M. Michel. We thank Denis Brunet for providing us with the computer programs used in this study and Simon O’Dochartaigh for his help in the correc-tion of the manuscript.
Correspondence and reprint requests should be addressed to Dr. Asaid Khateb, PhD , Department of Neurology, University Hospital, 24 rue Micheli-du-Crest, CH-1211 Geneva 14, Switzerland.
Fax: +41 22 3728333
E-mail: [email protected]
were investigated by comparing ERPs to linguistic and non-linguistic stimuli (words vs objects, non-words vs pseudo-objects, pseudo-fonts vs icon-strings) (Schendan et al. 1998). ERPs’ differences between words and objects were shown to occur ~125 ms post-stimulus. These differ-ences, characterized particularly at the level of the so called "P150 component" (Schendan et al. 1998), were sug-gested to be related to the time moment where the process of perceptual categorization of the different classes of vi-sual stimuli begins. Comparisons between objects and pseudo-objects showed small differences at lateral occipi-tal sites for the P100 and the P150 components, while the comparison of ERPs between words and word-like stim-uli did not show such early differences. In another visual priming study interested in the repetition effects, ERPs were compared between words (and scrambled words) and images (and scrambled images) (Zhang et al. 1997). Differences between words and images, appearing par-ticularly on the posterior scalp electrodes, started ~150 ms post-stimulus. The comparison of ERPs to images and scrambled images showed clear differences at occipital sites during the early components but also between 200-400 ms while the comparison of word and scram-bled-word conditions showed long-lasting differences which started after 170 ms post-stimulus and remained up to 600 ms (Zhang et al. 1997). In these studies, certain differences occurring at comparable time moments be-tween words and images may indeed be attributable to processes of visual perceptual categorization. However, subsequent differences may have been induced by pro-cesses of image and word recognition and consequently by the semantic contents of the stimuli, specifically those appearing between stimuli belonging to the same visual class (pictorial stimuli or verbal stimuli).
In summary, the preceding studies suggest that the major ERP differences between words and images occur-ring after 150 ms (Schendan et al. 1998; Zhang et al. 1997) are due to processes of perceptual categorization. Differ-ences between recognizable and non-recognizable im-ages or fragmented imim-ages occur in early (P100) but also in late components (Doniger et al. 2000; Schendan et al. 1998; Zhang et al. 1997), while the differences between words and non-words mainly occur in the late compo-nents (Nobre et al. 1994; Schendan et al. 1998; Tarkiainen et al. 1999; Zhang et al. 1997). In the pictorial conditions (recognizable vs non-recognizable images), the late dif-ferences were attributable to processes of perceptual clo-sure which are supposed to precede image identification (Doniger et al. 2000). Similarly, in the verbal conditions other processes related to lexical and semantic identifica-tion may have been at the origin of the relatively late dif-ferences observed between words and non-words. The question thus remains as to which responses (particularly those differentiating words and images after 150 ms) are
modulated by the presence of a semantic content in the stimuli, when they occur, and which brain regions they involve. More specifically, it is not clear if the same brain regions are activated during the time periods allocated to the semantic processing of pictorial and verbal stimuli.
In this study, we investigated the time course of brain activation during an explicit word and image recognition task using behavioral measures, event-related potential (ERP) map series analysis and distributed source localiza-tion procedures. Previous studies have repeatedly shown that the analysis of ERPs in terms of segments of quasi-stable map topography are particularly suited to the assessment of the functional activity of the brain during the different steps of information processing (Brandeis et al. 1998; Khateb et al. 1999, 2000, 2001b; Koenig et al. 1998; Michel et al. 1992; Michel and Lehmann 1993; Morand et al. 2000; Pegna et al. 1997; Thut et al. 2000). Such analysis relies on the fact that any change in the configuration of the electric potential distribution on the scalp is due to a modification of the configuration of the active sources in the brain (Lehmann 1987; Michel et al. 1999b). Accord-ingly, if the aim of an ERP experiment is to assess the dif-ferences in terms of brain activation between different experimental conditions, the topographic analysis of the scalp’s electric field appears more adequate than simple comparisons of the amplitudes and latencies of specific components on certain recording sites. The coupling of electric field analysis with distributed source localization methods then yields valuable information on the dynam-ics of brain activation during different sensory and cogni-tive processes (Khateb et al. 1999, 2000, 2001b; Koles et al. 2001; Kounios et al. 2001; Morand et al. 2000; Pegna et al. 1997; Thut et al. 2000).
In the present investigation, we used current tempo-ral segmentation techniques of ERP map series and a dis-tributed source localization method to analyze electric brain activity obtained during a mixed verbal and picto-rial recognition task. Stimuli were comprised of words, non-words, images (Snodgrass and Vanderwart 1980) and non-images (scrambled images). Subjects were asked to decide, following the presentation of each stim-ulus, whether it corresponds to a recognizable word or object. In the light of previous studies comparing words and images, ERP map series elicited by words and im-ages were expected to show similar patterns up to 150 ms (the period covering the P100 and the N150 visual com-ponents) (Schendan et al. 1998; Zhang et al. 1997) and thereafter to show specific map segments due to the dif-ferential processing of verbal (words and non-words) and pictorial (images and non-images) stimuli. During this period, map segments specific to verbal processing are also expected to differentiate between words and non-words while map segments specific to pictorial pro-cessing will show differences between images and
non-images. Preliminary results of this study were pre-sented in an abstract form (Khateb et al. 2001a).
Materials and Methods
SubjectsTwenty four native French speaking subjects (12 fe-males and 12 fe-males, mean age 22 years and 5 months) par-ticipated in this experiment. Subjects, recruited from the University, were all right-handed with a mean laterality quotient of +81.6 (± S.D=21.4) on the Edinburgh Handed-ness Inventory (Oldfield 1971). All had normal or cor-rected-to-normal vision. No history of neurological diseases was noted in any individual and all subjects were medication free at the time of the experiment. Before the recording session, all subjects gave formal written consent as recommended by the local ethical committee of the Geneva University Hospital. At the end of the experiment, all subjects were paid for their participation in the study. Stimuli and procedure
The stimuli in verbal and pictorial conditions were either semantically relevant or semantically irrelevant items. In the verbal items, the stimuli were either con-crete imaginable high frequency words (W, semantically relevant; e.g., école=school, n=40) or phonologically plausible non-words (NW, semantically irrelevant, e.g.,
chabule, n=40). In the pictorial items, the stimuli selected from the Snodgrass and Vanderwart set (Snodgrass and Vanderwart 1980), were either recognizable black and white drawings (representing living and non-living items), referred to as the image condition (IM, semanti-cally relevant, n=40), or a scrambled unrecognizable ver-sion of the same drawings referred to as the non-image condition (NIM, semantically irrelevant, n=40, see figure 1). Altogether, these stimuli provided a set of 160 ran-domized trials.
Experiments were carried out in an isolated, electri-cally-shielded room. The stimuli were presented by a Power Macintosh computer (17" screen, refresh rate 67 Hz) using a commercial software (MacProbe, v. 1.6.69, Aristrometics Inc., Woodland Hills CA, USA). From a fixation cross located vertically at 3.0 degrees and hori-zontally at 0 degrees, the stimuli were presented cen-trally and subtended 3.5° of the visual angle in length and 2.5° in height. The sequence (~2 s) of events was as follows: fixation cross for 500 ms, stimulus for 150 ms and 1300 ms for response. Subjects (seated at 120 cm from the screen) had to decide as quickly and accurately as possible using one of two buttons (right hand middle fin-ger for "yes", the index for "no") whether the displayed stimulus represented a known word/known image or not. Before the experimental block, subjects underwent a training session in order to ensure maximum compre-hension of the task demands.
Figure 1. A-B. Illustration of some examples from the pictorial items selected from the Snodgrass set (Snodgrass and Vanderwart 1980) representing either drawings of recognizable objects in image condition (A) or a scrambled unrecog-nizable version of the same drawings in non-image condition (B, see image and non-image correspondence in the num-bers).
EEG recordings and ERP analysis
The EEG was recorded (using a 64-channel system, hardware: M&I Ltd., Prague, software: Neuroscience Technology Research Ltd., Prague, Czech Republic) from 47 equidistant electrodes placed manually over the scalp according to the extended 10/10 system (cf. Khateb et al. 2000). The signals, recorded against the Cz site at 500 Hz, were re-computed off-line against the average reference (Lehmann 1987). Filter settings were between 0.15 to 250 Hz and the impedances were kept around 5 kOhm. A bipolar EOG monitored eye-movement arti-facts. At the end of the recording session, the exact 3-dimensional positions of electrodes were measured for each subject using a 3-D digitizer (ISOTRACK®, Polhemus Inc., Clochester, VT).
ERP epochs were averaged separately for the W, NW, IM and NIM conditions from stimulus onset to 600 ms post-stimulus, a time window covering almost all the period between stimulus presentation and the mean re-sponse delay (see below). After eliminating EEG sweeps with amplitude exceeding ± 100 µV in any of the chan-nels and excluding by visual inspection all trials contain-ing eye-movement artifacts and trials related to false responses, a total of ~30/40 artifact-free trials was ob-tained in each condition (respectively the mean ± S.D = 33 ± 5 in W; 29 ± 5 in NW, 29 ± 6 in IM and 31 ± 5 in NIM). Before the computation of the grand-mean ERP for each condition, the individual ERPs were standardized by in-terpolating the subjects’ electrode positions to a general 47-channel electrode array using the nearest-neighbor method (Fletcher et al. 1996).
The spatio-temporal analysis of ERP map series then allowed for identification of periods (or time segments) of quasi-stable map configurations (Lehmann 1987; Lehmann 1989), each hypothesized to represent a "func-tional microstate" of the brain, i.e., a certain informa-tion-processing step (Brandeis et al. 1995; Fallgatter et al. 1997; Koenig et al. 1998; Michel and Lehmann 1993; Michel et al. 1992). This analysis relies on the assumption that a change in the scalp electric field configuration re-flects the change of the neuronal populations active in the brain (Michel et al. 1999b). Thus, by analyzing the poten-tial distribution on the scalp, one can determine time points when the field topographic organization changes and when field distribution differs between conditions during the different steps of information-processing (Brandeis and Lehmann 1986; Michel et al. 1999b). In or-der to identify ERP segments of stable map configura-tions, the four grand-mean ERP map series evoked by verbal and pictorial conditions were submitted together to the temporal segmentation procedure. This method, using a spatial clustering procedure (Pascual-Marqui et al. 1995), allows, on the basis of pattern recognition
algo-rithms combined with statistical approaches, for the de-termination of the optimal number of template maps that explain in the whole ERP data set, the most dominant field configurations and their time of occurrence (Khateb et al. 2000, 2001b; Pegna et al. 1997). In addition, it allows to characterize the segment maps found in all different conditions and those maps found only in certain, but not in other, conditions.
Once the template maps were defined in the ERPs evoked during verbal and pictorial processing, their specificity for a given condition was tested. For that, the spatial correlation coefficient (Khateb et al. 1999) was cal-culated between the template maps and each subject’s ERP map series. Each time point in the subject’s map se-ries was then labeled with the template map it is most highly correlated with (Khateb et al. 1999, 2000, 2001b; Morand et al. 2000; Pegna et al. 1997; Thut et al. 1999, 2000). This procedure allows one to extract from each in-dividual ERP map series, several parameters, including segment duration (referring to how many times each template map appeared in the individual data) and global % of explained variance (referring to how well each template map explained the data, see Khateb et al. 1999). In addition, it allows for the definition of the time of appearance of each map in individual data (segment onset) and the moment in time best explained by a given template map (the individual maps, which are most highly correlated with segments’ template maps are re-ferred to as best-fit map). In this analysis, segments’ du-rations were statistically compared and the time of best fit-maps were calculated and used to determine the acti-vated regions. Furthermore, as we have previously shown that segment duration may correlate with sub-jects’ behavioral responses (Khateb et al. 1999, 2000), thus allowing for a statistical determination of those map con-figurations which were relevant for a certain task, a cor-relation analysis was undertaken here to verify whether the duration of any of the segments varies depending on subjects’ reaction times.
Source localization analysis
To identify brain regions activated during the time periods of interest, LORETA (Pascual-Marqui et al. 1994), a global linear inverse solution that estimates the smooth-est current density (CD, 10-3µA/mm2) distribution in the
whole brain, was used. While LORETA shows blurred so-lutions as compared to dipole soso-lutions, it allows an esti-mation of the active areas in the brain without pre-determining the number, orientation or location of the sources (Anderer et al. 1998; Khateb et al. 1999, 2000, 2001b; Koles et al. 2001; Kounios et al. 2001; Michel et al. 1999b; Pegna et al. 1997; Thut et al. 1999, 2000). Here we applied this method on a three-shell spherical
head-model and computed the solutions within a regular grid of 1152 nodes lying within the upper half-sphere. The CD distribution was estimated for each individual ERPs at the time point that was most-highly correlated with the segment template map. Mean CD was then calculated for each map and subject in four regions of interest (ROIs, an-terior, temporal- anan-terior, temporal-posterior and poste-rior) in each hemisphere. A 4×2 ANOVA was performed on mean CD where ROIs (4) and hemispheres (2) served as within-subject factors.
Behavioral analysis
Mean reaction time (RT) and percentage of correct responses were determined for each subject in each con-dition. These parameters were statistically compared with a 2×2 analysis of variance (ANOVA) using stimulus type (verbal vs. pictorial) and semantic relevance (se-mantically relevant vs. se(se-mantically irrelevant) as within-subject factors.
Results
Behavioral data
Mean (± S.D) reaction time (RT) was 520 ± 77 ms in W condition, 709 ± 105 ms in NW condition, 539 ± 69 ms in IM condition, and 575 ± 63 ms in NIM condition. The 2×2 ANOVA performed on RT showed highly significant main effects for both stimulus type (F(1,23)=55.6; p<.00001) and semantic relevance (F(1,23)=153.1; p<.00001) together with a highly significant interaction between the two analysis factors (F(1,23)=98.3; p<.00001). The relevance effect was attributable to the fact that semantically irrelevant stimuli induced longer reaction times than semantically relevant ones. The type effect was due to the fact that NW condition induced the longest RT as attested by the interaction between the analysis factors. Post-hoc Scheffé tests showed signifi-cant effects in all comparisons except between word and image conditions where a tendency indicated longer re-action time in IM than in W condition. The ANOVA per-formed on the percentage of correct responses (mean ± S.D = 96 ± 4%, 81 ± 13%, 93 ± 6% and 96 ± 6% in respec-tively W, NW, IM and NIM conditions) again showed highly significant main effects for both type (F(1,23)=28.7; p<.00001) and semantic relevance (F(1,23)=15.4; p<.0007) with a significant interaction be-tween the two factors (F(1,23)=33.7; p<.00001). The type effect was due to a higher percentage of correct responses in pictorial stimuli than in verbal stimuli and the rele-vance effect was due to a higher rate of correct responses in semantically relevant stimuli as compared to irrele-vant ones. The interaction was due to the fact that
non-words induced the lower rate of correct responses as compared to all other conditions.
The temporal segmentation of grand-mean ERP map series
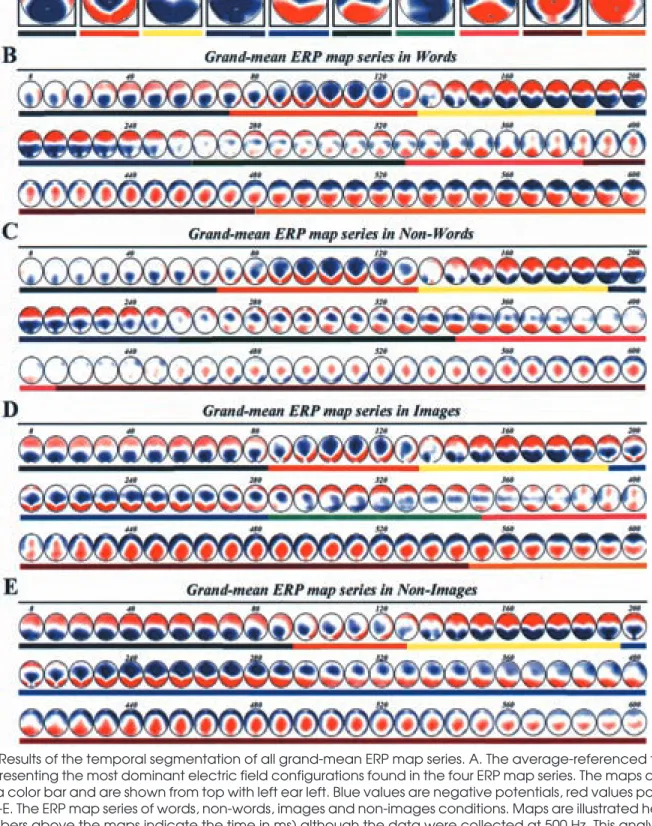
The temporal segmentation of the grand-mean ERP map series evoked by W, NW, IM and NIM conditions revealed the presence of a total of 10 distinct map seg-ments over all conditions. Figure 2 illustrates the aver-age-referenced template maps (A) of the most dominant electric field configurations and their time of occurrence in each of the four grand-mean ERP map series (B-E). The template maps in figure 2A (identified with a color code below each map) show that the early, first three segment maps (labeled as S1, S2 and S3) and the late three segment maps (labeled as S6, S7 and S8) were present in both the verbal and pictorial conditions. On the other hand, the intermediary segment maps, appearing between ~200 ms and 350-400 ms (referred to as segment V4 and V5 in verbal conditions, and as segments P4 and P5 in pictorial conditions), differed between the verbal and pictorial conditions. For verbal conditions, figure 2B and C illus-trate the grand-mean ERP map series in W and NW con-ditions and the periods of occurrence (indicated below the maps by color bars) of each segment map. It can be immediately noticed that 8 segments appeared in W dition, while only 7 segments were observed in NW con-dition. In addition, the segment borders in these two conditions suggest that some segments might differenti-ate W and NW conditions in terms of their duration (see statistics below). Figure 2D and E, illustrating the grand-mean ERP map series and the segment borders in the IM and NIM conditions also show that 8 segments appeared in IM condition, while only 5 segments were observed in NIM condition. Here again, the segment bor-ders suggest that different map segments may differenti-ate conditions in terms of duration, particularly the segment P5, found only in IM condition as indicated at this level of analysis.
In order to compare our data with previous studies that used conventional analysis of ERP waveforms, a sub-set of average-referenced grand-mean ERP traces from five frontal (F3, F1, Fz, F2 and F4) and five posterior (PO7, PO3, POz, PO4 and PO8) recording sites, where the differ-ent conditions were compared, is illustrated in figure 3. In this illustration, panel A shows the superposition of traces from conditions W (solid lines) and IM (dashed lines), panel B shows the superposition of traces from conditions W (solid lines) and NW (dashed lines), and panel C shows the superposition of ERP traces from conditions IM (solid) and NIM (dashed lines). As in the grand-mean segmenta-tion, the visual inspection of the traces in panel A indicates that the major differences between words and images
be-Figure 2. Results of the temporal segmentation of all grand-mean ERP map series. A. The average-referenced template maps representing the most dominant electric field configurations found in the four ERP map series. The maps are identi-fied with a color bar and are shown from top with left ear left. Blue values are negative potentials, red values positive po-tentials. B-E. The ERP map series of words, non-words, images and non-images conditions. Maps are illustrated here every 8ms (numbers above the maps indicate the time in ms) although the data were collected at 500 Hz. This analysis shows that the first three segment maps (labeled as S1, S2 and S3) and the late three segment maps (labeled as S6, S7 and S8) were found in both verbal and pictorial conditions. The intermediary segment maps (observed between 190 ms-350 ms) referred to as segment V4 and V5 in verbal conditions, and as segments P4 and P5 in pictorial conditions, differentiated conditions.
Figure 3. Illustration of average-referenced grand-mean ERP traces of 5 frontal and 5 posterior recording sites from the dif-ferent conditions. A. Superposition of traces from W (solid lines) and IM (dashed lines) conditions. B. Superposition of traces from W (solid lines) and NW (dashed lines) conditions. C. Superposition of ERP traces from IM (solid) and NIM conditions. As suggested by the map series segmentation, the differences between words and images are already evident ~200 ms (A) while they appear later between the verbal conditions (B). Finally, the differences between the pictorial conditions (C) are observed during different time periods of which the most evident are between ~200-400 ms corresponding to the time period of segments P4 and P5. Horizontal scale indicates time in ms and vertical scale indicates amplitude inµV.
gin slightly prior to 200 ms post-stimulus. On the other hand, inspection of panel B and C suggests that the intra-type differences (figure 3B and 3C), particularly in the verbal conditions, appear later.
The early segments are shown to be the same in all conditions. Particularly, segment S2 corresponds to the time period of the visual P100 ERP component as shown by the positivity in the posterior traces (figure 3A-C,). Segment S3, also present in all conditions, occurred dur-ing the time period of the N150 component as shown by the negativity in the posterior sites. Differences between conditions W and IM, most evident between ~200-400 ms, are shown in map analysis (figure 2) and in the superim-posed traces (figure 3A). The traces show that while in the pictorial conditions, a P2 component appears to shorten the duration of the N150 component and thus the appear-ance of segment P4, a long-lasting N150 component is ob-served in the verbal conditions (see POz traces in figure 3A). In terms of map configuration, the prolongation in verbal conditions of the ascending phase of N150 compo-nent led to the appearance of another segment (V4) differ-ing in its topographic characteristics from the pictorial one (P4). Although, characterized by a template map somewhat resembling that of segment S3 (the two maps being spatially correlated at 83%), this segment was iden-tified by the spatial clustering analysis as a distinct one.
Concerning the segments appearing after 400 ms, they were similar between conditions although some of them did not appear in certain grand-mean data. This particularly concerned segment S8 which appeared in those conditions where reaction times were the shortest (W and IM conditions). Such observation may thus sug-gest that segment S8 may represent a post-processing mi-cro-state, and that the faster the subjects responded to the task, the longer the time they spent in this micro-state.
Segments analysis in individual subjects’ ERP map series
This analysis, restricted to segments S2-S8 starting with the P100 component, was undertaken in order to de-termine the duration and time of occurrence of the differ-ent segmdiffer-ents in subjects’ individual ERP map series, and assess segments’ specificity to one or other of the condi-tions in verbal and pictorial processing.
To this end, on the basis of the grand-mean data seg-ments’ succession, two analysis windows were defined in order to restrict segments’ search to their time of appear-ance. The template maps of the early segments (S2-S3) found in all conditions were first compared with individ-ual subjects map series in a first time window ranging from 80 to 190 ms. In a second time window, ranging from 190 to 600 ms, we searched for the presence of the maps of segments V4, V5, S6, S7 and S8 in verbal ERP map series (W and NW) and the maps of segments P4, P5, S6, S7 and S8 in pictorial ERP map series (IM and NIM). The seg-ments’ duration (referred to as the number of time frames each map was found in the given time window) was then statistically compared between conditions.
Segments’ duration
The mean and standard deviation of segments’ du-ration calculated in each condition are reported in table I. Separate 2×2 analyses of variance (ANOVA) were first performed on each segment duration using stimulus type (verbal vs. pictorial) and semantic relevance (se-mantically relevant vs. irrelevant) as within-subject fac-tors. In the first time window, two significant main effects for both type (F(1,23)=4.6; p<.05) and relevance (F(1,23)=21.5; p<.0001) in addition to a highly significant interaction (F(1,23)=21.7; p<.0001) were observed in S2
Verbal Segments Words N-Words Pictorial Segments Images N-images
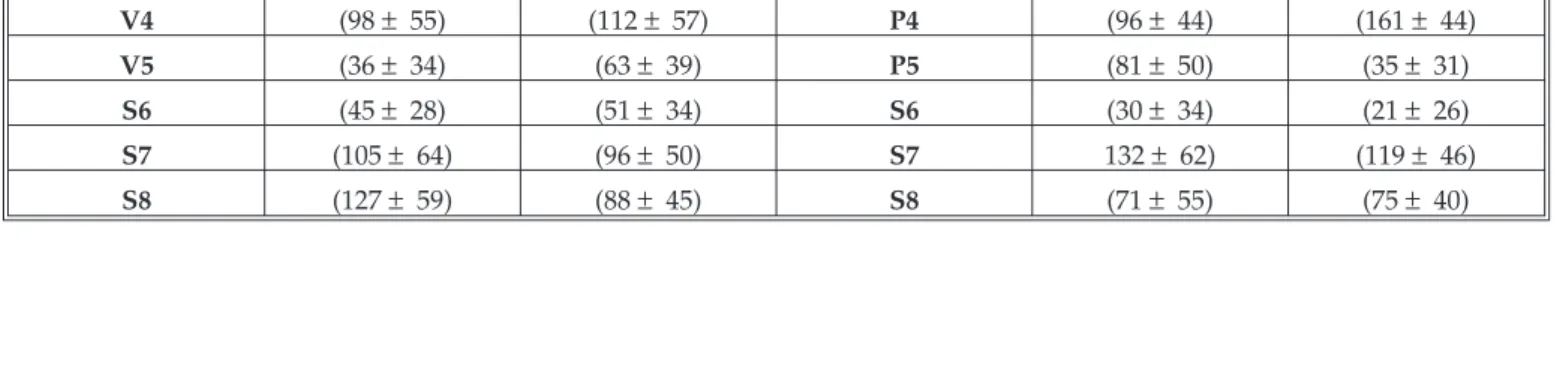
S2 (50± 31) (51± 28) S2 (53± 30) (29± 24) S3 (60± 31) (59± 28) S3 (57± 30) (81± 24) V4 (98± 55) (112± 57) P4 (96± 44) (161± 44) V5 (36± 34) (63± 39) P5 (81± 50) (35± 31) S6 (45± 28) (51± 34) S6 (30± 34) (21± 26) S7 (105± 64) (96± 50) S7 132± 62) (119± 46) S8 (127± 59) (88± 45) S8 (71± 55) (75± 40)
Table I. Mean± standard-deviation of segments’ duration (in milliseconds) in words, non-words, images and non-images conditions. Segments 2 and 3 were calculated in a first time window extending from 80 to 190 ms and segments 4 to 8 were calculated in a second time window ranging from 190 to 600 ms post-stimulus.
duration. This interaction was mainly due to the fact that S2 was shorter in condition NIM than in the other condi-tions. Scheffé tests indeed confirmed that segment S2 was significantly shorter in NIM than in W (p<.0002), than in NW (p<.0001) and in IM (p<.0001). Since only two maps were fitted to this period, the inverse effects were observed for S3 which appeared longer in NIM than in the other conditions. In the second time window, the grand-mean ERP map series segmentation showed that some maps such as P5 and S8 did not appear in certain conditions (particularly S8 in NW and NIM conditions presumably due to the shortening of the analysis epoch to 600 ms). However, segment analysis in the individual data revealed that these maps could be found, although their duration was significantly shorter in these than in the other conditions. The 2×2 ANOVA performed on the duration of segments V4/P4 (in the verbal conditions/in the pictorial conditions) revealed a significant main ef-fect for semantic relevance (F(1,23)=18.4; p<.0003) due to the fact that this segment was longer in semantically ir-relevant conditions than in semantically ir-relevant ones. An interaction was also observed between type and rele-vance (F(1,23)=10.7; p<.003), due mainly to the fact that the duration of P4 in NIM was longer than P4/V4 in all other conditions (longer than P4 in IM: p<.0001; V4 in W: p<.0001 and V4 in NW: p<.002) conditions. For segments V5/P5, only a highly significant interaction was ob-served (F(1,23)=36.2; p<.0001). This interaction was at-tributable to the fact that segment V5 duration was longer in NW than in W condition (p<.04) and that seg-ment P5 duration was longer in IM than in NIM condi-tion (p<.0003) as suggested by the segmentacondi-tion results where P5 was absent in NIM. For segment S6, only a main effect was observed for type (F(1,23)=10.1; p<.004) due to the fact that this segment was longer in verbal than in pic-torial conditions. For segment S7, a highly significant main effect was again observed for type (F(1,23)=13.6; p<.001), due this time to the fact that this segment dura-tion was longer in the pictorial than in the verbal condi-tion. Finally, in S8, a significant main effect was observed for type (longer in verbal conditions: F(1,23)=28.1; p<.0001) together with an interaction between type and relevance (F(1,23)=8.5; p<.008). This interaction was due to the fact that S8 was longer in W than in NW (p<.01), than in both IM (p<.0003) and NIM (p<.0006) conditions.
Correlation between segment duration and behavioral data
In previous studies, we had observed that some seg-ments’ duration did correlate with subjects’ behavioral responses (Khateb et al. 1999, 2000). In order to verify whether the duration of any of the segments found here vary with individual reaction times, a correlation analy-sis was performed between individual mean reaction
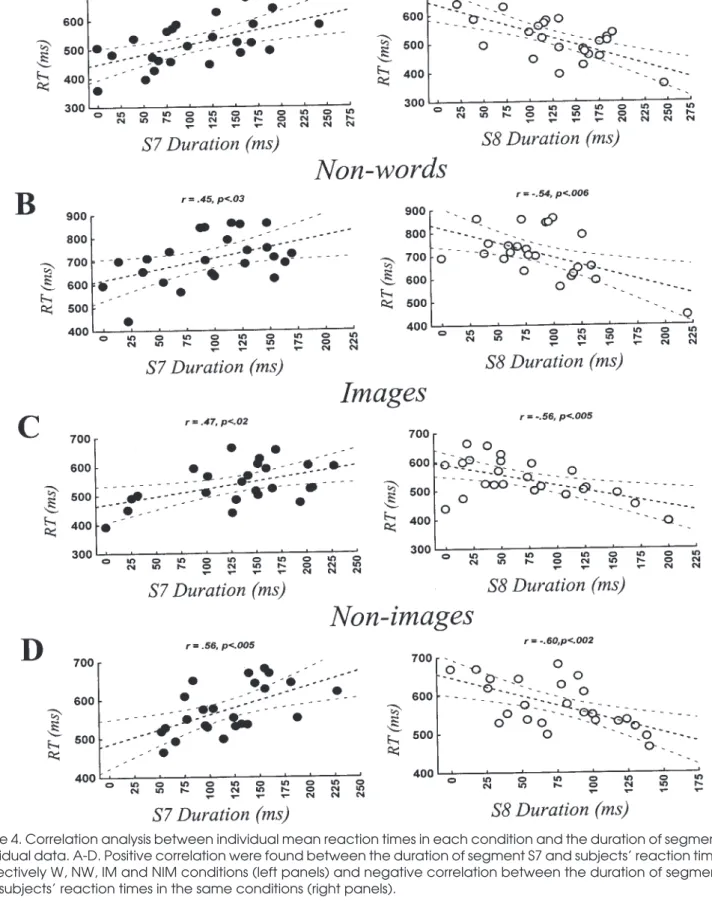
times in each condition and the duration of each segment in individual data. A correlation between segment dura-tion and subjects’ RTs was only observed for S7 and S8. As illustrated in figure 4, it was observed that while seg-ment S7’s duration correlated positively with subjects re-action times in the different conditions (figure 4A-D, left panels), segment S8 duration correlated negatively with the same reaction times in the different conditions (figure A-D, right panels).
Segments’ time of occurrence
This analysis was undertaken to verify, in subjects individual data, when the different map segments curred in each condition. For this purpose, the time of oc-currence of the best-fit map (TBF, the individual maps being the most highly correlated with segments’ maps of the grand mean) of each segment was determined in each individual map series. Figure 5 illustrates the mean (± SD and ± SEM) time of occurrence of the best-fit maps for the different segments as computed from the first (80-190 ms) and the second (190-600 ms) time windows initially de-fined. Globally, this illustration shows that the time of oc-currence of the best-fit maps increased in all conditions as a function of segment number although an overlapping could be observed in the time of occurrence of S7 and S8 especially in NW, IM and NIM conditions (figure 5B-D). One may also notice the large variance in segments P5 and S6 in NIM condition (figure 5D). It is noteworthy that these latter segments were absent in the grand-mean seg-mentation of the NIM condition and that the maps char-acterizing these segments were found less frequently in subjects’ data than the maps of the other segments (see the number of valid cases in this and the other panels). Source localization analysis
This analysis was performed to estimate brain regions, which gave rise to some ERP maps of interest recorded in the scalp. Based on the results of segments’ analysis, we re-stricted the following analysis on segments S2 and S3 found in all conditions and on segments V4/V5 and P4/P5 which differentiated verbal and pictorial conditions. For S2 and S3, best-fit maps selected from individual ERP map series of W and IM were averaged between conditions. For V4, best fit-maps were selected from W and NW ERPs and av-eraged while for V5, maps were only selected from NW condition where this map was more dominant than in the W condition. For P4, best-fit maps were selected from IM and NIM ERPs and averaged while P5 maps were only se-lected from IM where this map was the most dominant. For each segment of interest, the best-fit maps were first sub-jected to the inverse solution procedure, LORETA (Pascual-Marqui et al. 1994). The individual solutions were then averaged over subjects for each segment.
Figure 4. Correlation analysis between individual mean reaction times in each condition and the duration of segments in individual data. A-D. Positive correlation were found between the duration of segment S7 and subjects’ reaction times in respectively W, NW, IM and NIM conditions (left panels) and negative correlation between the duration of segment S8 and subjects’ reaction times in the same conditions (right panels).
As illustrated in figure 6 (left panels), the solutions which depict the mean current density distribution in the brain, first show that segment S2, corresponding to the period of the P100 visual component, was characterized by the bilateral activation of posterior brain regions. The solution for segment S3, corresponding to the period of the N150 component, indicates mainly the predominant activation of LH posterior and temporo-posterior re-gions. In V4 and P4 segments, where major differences were observed between verbal and pictorial ERPs, the so-lutions display a bilateral posterior activation in V4 with an extension of the activity towards LH temporal and an-terior regions while in P4, mainly a bilateral activation is observed in posterior regions. Finally, the solutions for V5 and P5 show that activation involved both anterior and posterior regions although the strength of activation varied between regions and hemispheres.
In order to determine the statistical significance of these observations, the mean CD was calculated for each subject from the LORETA solution in four regions of in-terest (ROIs) in each hemisphere. Since the major activa-tion was mainly observed in the lowest slices of the grid, mean CD was determined over the four lowest slices (see
figure 6A, left panels and figure 6B1). The ROIs included: an anterior (A); a temporal-anterior (TA); a tempo-ral-posterior (TP) and a posterior (P) region in each hemi-sphere (see scheme in figure 6B2). For each segment, a 4×2 ANOVA was then performed on mean CD using ROIs (4, referred to as A-P factor) and hemispheres (2, re-ferred to as L-R factor) in order to determine the differ-ence of activation between ROIs and hemispheres. The results of this analysis (graphic with the corresponding p values) are illustrated in figure 6A (right panels). In S2, only a highly significant main effect for A-P factor was observed, confirming that the major activity was located in posterior regions. In S3, all effects were highly signifi-cant and show that the major activity was in the LH and more specifically in posterior and temporo-posterior re-gions. In V4, a posterior bilateral activation was again ob-served but with the implication of other LH regions as attested to by the marginally significant L-R effect. In P4, only a highly significant A-P main effect was observed, confirming that the major activity was dominant in bilat-eral posterior regions. In V5 and P5, the activation was found as suggested by the averaged solutions in both an-terior and posan-terior regions but a major difference here Figure 5. Segments’ time of occurrence. A-D. Mean (±SD and ±SEM) time of occurrence of the best-fit maps for the succes-sive segments in the different conditions (A: for W; B: for NW; C: for IM; and D: for NIM condition). These graphics show that the time of occurrence of the best-fit maps increases in all conditions as a function of segment number. Note the number of valid cases for each segment.
Figure 6. Current density (CD) distribution estimated with LORETA for the segments S2 and S3 found in all conditions and the segments V4/V5 and P4/P5 which differentiated verbal and pictorial conditions. This inverse solution depicts the activity in eight slices with the deepest slice corresponding to the T3-T4-FPz plane. Since the major activity was mainly observed in the lowest four slices, only these were considered for further analysis (see lines in B1for slice levels, maps are seen from top with
left ear left). A. In left panels, LORETA solutions are illustrated for the segments of interest. Red values indicate high current density (see color scale below the lowest panel) . Note that the solutions are individually scaled to their maximum. In the right panels, the graphics and the 4×2 ANOVA results on mean CD distribution estimated from best-fit maps over subjects as a function of four ROIs (A, TA, TP, P) and hemispheres (LH-RH). For the statistics, A-P indicates anterior to posterior factor; L-R indicates left to right hemisphere factor and INT indicates the interaction between the two factors (LH in blue, RH in red). B. The scheme in B1 illustrates the height of brain slices (in the Z axis, the lowest slice=0, the highest=1, see horizontal lines). B2 represents one of the four slices defining ROIs .
concerned the lateralization of the activation. In V5, a more dominant activation was observed in the LH while in P5 a slightly dominant activity is found in the RH, par-ticularly in posterior regions.
Discussion
By means of behavioral and ERP measurements, our aim in this study was to assess the dynamics of brain acti-vation during word and image recognition. For that, we contrasted semantically relevant and irrelevant stimuli by using words vs. phonologically plausible non-words (as a verbal control condition) and object drawings vs. scrambled drawings (as a pictorial control condition) in a lexical decision-like recognition task.
Behavioral measures showed mainly that RT was shorter in semantically relevant than non-relevant stimuli. When compared to all other conditions, NW condition was shown to induce the longest RT. The fact that NW was processed slower than W condition is in accordance with previous studies showing that RT to NW was longer than RT to semantically primed targets or non-primed words (Bentin et al. 1985). Similarly, in pictorial conditions, RT to NIM condition was also shown to be longer than RT to IM condition. Concerning RTs to W and IM conditions, al-though Scheffe comparisons did not reveal significant dif-ferences between the two conditions, t-test analysis showed that RT to W was significantly shorter than to IM, as previously observed (Zhang et al. 1997). The analysis of performance showed that NW condition induced the low-est rate of correct responses as compared to the other con-ditions, attesting to the fact that this was the most difficult condition for subjects to perform. This effect is due to the fact that NWs were phonologically plausible and conse-quently were perceptually more similar to Ws than were NIM to IM, creating thus certain ambiguity and increased rate of recognition errors.
Concerning ERP analysis, the first interesting find-ing is the demonstration that the same map segments were elicited by verbal and pictorial processing until ~200 ms. Although we have not compared ERP traces statistically in this study, the results obtained by the seg-mentation analysis appear to be in line with previous studies that showed ERP amplitude differences only af-ter 150 ms post-stimulus (Schendan et al. 1998; Zhang et al. 1997). Our illustration of selected ERP traces in figure 3 corresponds well to these earlier findings. This indi-cates that early visual processing steps were not influ-enced by the stimulus type (verbal vs. pictorial). During these early steps, the analysis of segments’ duration sug-gested that S2 and S3 segments (corresponding to the P100/N150 components) were different in NIM than in the other conditions. Similar differences in early compo-nents (also visible in the traces superposition from IM
and NIM, figure 3C) were already observed, particularly in occipital and parietal sites, in a previous study com-paring images and scrambled images (Zhang et al. 1997). The finding that S2 was shorter in NIM (and as a corol-lary S3 appeared longer) than in IM condition, without differentiating condition NW from W, may be attribut-able to certain characteristics inherent to the stimuli used. In verbal conditions, the W and NW conditions both constituted of identifiable letters forming phono-logically logical sequences that could, in an initial visual categorization, correspond to real words. Subsequent search in semantic memory was then necessary to decide if each letter string corresponds to a known or unknown concept leading, thus, to an increased RT (and to in-creased errors) in the case of NW. Concerning pictorial conditions, on the basis of certain visuo-spatial features of the seen items (e.g., contours’ smoothness), a first per-ceptual categorization may have occurred during the P100 period allowing the subjects to very early consider items as possibly relevant or irrelevant to the task. Here again, as for verbal items, more time was required for a subsequent search in semantic memory in order to per-form their final decision. Significant differences in com-ponent latency, amplitude, and scalp topography of the visual P100 component have already been observed be-tween semantically irrelevant (reversal checkerboard) and relevant stimuli (words) (Skrandies 1998).
Segment S3, whose map configuration is deter-mined by the N150 component, was identical in pictorial and verbal conditions and was shown to be induced by the activation of left posterior and temporo-posterior gions. Similar responses with comparable latencies re-ported in other studies were induced by words and non-words strings in the left occipito-temporal cortex (Tarkiainen et al. 1999) This localization corresponds to what has been described as the "visual word form area" (Cohen et al. 2000; Menard et al. 1996) in the left occipito-temporal region and whose disruption is classi-cally proposed to be at the origin of pure alexia (Cohen et al. 2000). Such responses in the occipito-temporal cortex were characterized by depth recordings to be insensitive to the semantic content of words (Nobre et al. 1994) as we have shown here for both words and non-words. The fact that pictorial conditions elicited the same map as verbal conditions during the same time segments, strongly sug-gests that these early steps of processing rely on very close/or overlapping structures both for word and pic-ture perceptual decoding. In line with this finding, it has been reported that patients with visual object agnosia fol-lowing left occipito-temporal lesions can concomitantly present alexia (Carlesimo et al. 1998; Feinberg et al. 1994; Feinberg et al. 1995), confirming the proximity of the brain structures engaged for both processes. The left occipito-temporal activation, observed here after the
pre-sentation of both verbal and pictorial stimuli, confirm as previously suggested (Perani et al. 1999; Vandenberghe et al. 1996), that left posterior structures are a part of a common neural system involved in the processing of both words and images.
The time window (~200-400 ms) where differences between verbal and pictorial processing appeared corre-sponds to that previously reported by other studies (Schendan et al. 1998; Zhang et al. 1997) in which compo-nents’ amplitude were compared. The fact that differ-ences observed here are explained by distinct map segments in the verbal and pictorial conditions confirm that different brain structures were engaged during this crucial time period and gave rise to different field config-urations on the scalp. The visual inspection of the aver-age-referenced ERP traces in our data in the 150-200 ms time range showed that, while the posterior N150 negativity is prolonged in the verbal conditions, a P2 component appeared in the pictorial conditions in the same recording sites. In terms of map topography, these differences were expressed by the appearance of seg-ments V4 and V5 in the verbal conditions and by P4 and P5 in the pictorial conditions. Subsequent analysis per-formed on segments’ duration showed that these two pairs of segments could differentiate semantically rele-vant and irrelerele-vant conditions in verbal and pictorial processing. Together with this observation, several lines of evidence suggest that these segments may be involved in lexical-semantic and visual-semantic processes. First, in a previous study using semantic category and phono-logical (rhyme) judgement tasks of sequentially pre-sented word pairs, we have already reported that two segments in the time window between 280-380 ms differ-entiated semantic and phonological processing (Khateb et al. 1999). Other ERP studies using either single word presentation (Koenig et al. 1998) or Chinese characters (Shimoyama et al. 1997), reported map differences be-tween concrete and abstract concepts in the time window between ~280-350 ms after stimulus presentation. Con-cerning pictorial processing, other MEG and EEG studies using either disorganized versus coherent meaningful images (Vanni et al. 1996) or fragmented versus non-fragmented images (Doniger et al. 2000) showed that the peak differences between recognizable and un-recognizable images occurred in the ~290 ms time range as was reported here. The activation of lateral occipital regions during this time period was proposed to be nec-essary for subsequent process of object recognition (Doniger et al. 2000).
The duration analysis of the fourth segment showed an effect of relevance in V4 and P4 both being shorter in the relevant than in the irrelevant conditions. This difference in segments’ durations strongly suggests that the recogni-tion/non recognition processes are dependent in both
ver-bal and pictorial conditions on the time the subjects spent in V4 and P4. The recognition process may have been oper-ated in two successive distinct, but nevertheless intimately linked steps, of which the first step probably takes place during the segment V4 in verbal and P4 in pictorial condi-tions. In both conditions, this processing step may corre-spond to a phase of enhanced pattern analysis where stimuli are re-evaluated before any final decision is per-formed. In the verbal conditions, the inverse solution re-sults from V4 suggest that the observed scalp field potential may have emanated from the concomitant activation of bi-lateral posterior, temporo-posterior and, to a lesser extent, posterior frontal areas. A similar pattern of activation has been observed in our previous study, but without differen-tiating semantic and phonological word processing (Khateb et al. 1999), probably due to the fact that the same real words were used in both tasks. This is to say, that stim-ulus re-evaluation may necessitate the re-activation of a visuo-spatial or a verbal buffer before the subsequent step takes place (Kosslyn 1996). In the pictorial conditions, the inverse solution results indicate, as previously suggested (Doniger et al. 2000; Vanni et al. 1996), the activation during this time period of bilateral posterior brain regions, a re-activation again necessary to visualize the previously seen stimuli. The modulation of segments V4 and P4 dura-tion by the stimulus type and relevance may thus reflect the intervention of some feedback - feed-forward mechanism that determines the amount of the additional processing necessary for recognition (Pollen 1999).
In addition to the fact that segments V4 and P4 could differentiate semantically relevant and non-relevant stimuli, V5 and P5, as previously suggested, appeared in-timately linked to the these previous segments. First, it was observed that V4 was also longer in NW than in W. On the contrary, P5 appeared only in the grand-mean data of IM condition and was also shown in segments’ analysis to be considerably longer in IM than in NIM con-dition. Although not illustrated here, post-hoc analysis revealed that a correlation could exist between the dura-tion of V4 and V5 in verbal individual data but also be-tween P4 and P5 in pictorial individual data. This interplay between the duration of V4/V5 and P4/P5, no-ticed à posteriori, indicates that the longer the subjects re-mained in V4/P4, the shorter the time they spent in V5/P5. However, the question now remains, why was segment V5 longer in NW than in W and segment P5 was almost only present in IM? If we accept the interpretation proposed on the functional significance of segments V4/P4 as an additional but necessary phase to re-evaluate the stimuli before final executive processes take place, we propose that this fifth segment corre-sponds to the moment in time where search is performed in semantic memory. In the case of verbal conditions, the fact that the phonologically plausible strings forming the
non-words may actually correspond to real known words may be at the origin of the increased duration of this seg-ment in order to perform sufficient search before exclud-ing a word. The inverse solution results indeed indicated that brain areas activated during V5 involved mainly left temporal-posterior and anterior regions generally re-ported to participate in semantic word processing (Binder et al. 1997; Perani et al. 1999; Vandenberghe et al. 1996). The fact that words and non-words activate the same brain region is in accordance with previous observations reported by imaging studies, showing that non-words ac-tivate the neuronal network even more strongly than fa-miliar words for which access occurs with ease (Price et al. 1996). In the pictorial conditions, the identification of scrambled images as irrelevant stimuli (meaningless shapes) already during P4, might have precluded any subsequent search in visual semantic memory. This inter-pretation appears to be supported by the fact that the seg-mentation results indicated the absence of segment P5 in NIM but also by the fact that the posterior negativity which followed P2 positivity in IM condition was lacking in NIM (see posterior electrodes in figure 3C). The inverse solution results obtained from P5 maps in IM condition showed that brain regions activated during this time pe-riod were more lateralized in the right hemisphere (than in segment V5) - particularly in posterior regions. This ac-tivation may partially correspond to what has been de-scribed in previous imaging studies, which suggest the involvement of the right occipital gyrus in picture pro-cessing (Vandenberghe et al. 1996).
If segments V4/P4 and V5/P5 represent processing periods related to stimuli analysis and recognition, the later segments must concern the passage of information into ex-ecutive steps (Pollen 1999). Segments analysis suggested that the final steps of processing, as with the early ones, en-gaged the same brain structures. Indeed, segments S6, S7 and S8 were found in both verbal and pictorial conditions. In addition, despite the fact that some of these segments were absent in the grand-mean data, segment search in in-dividual data, particularly segment S8, showed that they could be found in the majority of subjects’ ERPs, and their duration correlates with subjects’ RT. Concerning more particularly segment S7, it was shown that this segment’s duration correlated positively with subjects’ RT. This corre-lation, indicating that the greater the time spent by subjects in S7, the longer their reaction time, strongly suggest a rela-tion between this segment and the final decisional process required by the task. Given the presumed involvement of this segment in the executive processes, one might have ex-pected that this segment would appear longer in the condi-tion inducing the longer RTs and shorter in the condicondi-tion inducing the shorter RT. Such a correspondence was, how-ever, not observed and S7 duration was shown to be longer in pictorial than in verbal conditions. A similar
correspon-dence could also be expected for the duration of segment S8 which correlated negatively with RT suggesting that it may represent a post-processing micro-state. The absence of this correspondence between the duration of S8 and RTs, was probably due to the fact that segment S8 was shortened by the analysis epoch stopped at 600 ms. A negative correla-tion existed (not illustrated) between S7 and S8 duracorrela-tion confirming that the longer the subjects remained in S7 the shorter the time they spent in S8. Taken together, these ob-servations suggest that interpreting the behavioral data on the basis of one segment duration may lead to hazardous conclusions. The evidences reported here both on the dura-tion of S7 and S8 in reladura-tion with RTs but also the reladura-tion previously evoked between the duration of segments V4/V5 and P4/P5 suggest that in cognitive tasks, RTs are continuously modulated through the different steps of in-formation processing.
In conclusion, based on the electric field configura-tion analysis, the observaconfigura-tions presented in this study mainly suggest that, following the activation of the same brain regions during the early phases of verbal and picto-rial processing, different brain areas were engaged dur-ing the time periods presumably related to words and image recognition. In the late steps of information pro-cessing, most probably allocated to executive processes as attested to by the relation between segments’ duration and subjects’ RTs, the same brain regions again appeared activated by both verbal and pictorial stimuli. Although to be interpreted with caution due to their low spatial res-olution (George et al. 1995; Grave de Peralta-Menendez and Gonzalez-Andino 1998), the inverse solution results suggest that brain regions engaged during verbal and pictorial recognition are different. More specifically, words and word-like recognition involved more domi-nantly left hemisphere regions while image recognition involved more dominantly right hemisphere areas.
References
Anderer, P., Pascual-Marqui, R.D., Semlitsch, H.V. and Saletu, B. Differential effects of normal aging on sources of stan-dard N1, target N1 and target P300 auditory event-related brain potentials revealed by low resolution electromag-netic tomography (LORETA). Electroenceph. Clin. Neurophysiol. Evoked Potentials, 1998, 108: 160-174. Bentin, S., McCarthy, G. and Wood, C.C. Event-related
poten-tials, lexical decision and semantic priming. Electroenceph. Clin. Neurophysiol., 1985, 60: 343-355.
Binder, J.R., Frost, J.A., Hammeke, T.A., Cox, R.W., Rao, S.M. and Prieto, T. Human brain language areas identified by functional magnetic resonance imaging. J. Neurosci., 1997, 17: 353-362.
Brandeis, D., Lehmann, D., Michel, C.M. and Mingrone, W. Mapping event-related brain potential microstates to sen-tence endings. Brain Topogr., 1995, 8: 145-159.
Brandeis, D., van Leeuwen, T.H., Rubia, K., Vitacco, D., Dteger, J., Pascual-Marqui, R.D. and Steinhausen, H.C. Neuroelectric mapping reveals precursor of stop failures in children with attention deficits. Behav. Brain Res., 1998, 94: 111-125. Brandeis, D. and Lehmann, D. Event-related potentials of the
brain and cognitive processes: approaches and applica-tions. Neuropsychologia, 1986, 24: 151-168.
Carlesimo, G.A., Casadio, P., Sabbadini, M. and Caltagirone, C. Associative visual agnosia resulting from a disconnection between intact visual memory and semantic systems. Cor-tex, 1998, 34: 563-576.
Cohen, L., Dehaene, S., Naccache, L., Lehericy, S., Dehaene-Lambertz, G., Henaff, M.A. and Michel, F. The visual word form area: spatial and temporal characterization of an initial stage of reading in normal subjects and posterior split-brain patients. Brain, 2000, 123: 291-307.
Demb, J.B., Desmond, J.E., Wagner, A.D., Vaidya, C.J., Glover, G.H. and Gabrieli, J.D. Semantic encoding and retrieval in the left inferior prefrontal cortex: A functional MRI study of task difficulty and process specificity. J. Neurosci., 1995, 15: 5870-5878.
Démonet, J.F., Cholet, F., Ramsay, S., Cardebat, D., Nespoulous, J.L., Wise, R., Rascol, A. and Frackowiak, R. The anatomy of phonological and semantic processing in normal subjects. Brain, 1992, 115: 1753-1768.
Doniger, G.M., Foxe, J.J., Murray, M.M., Higgins, B.A., Snodgrass, J.G. and Schroeder, C.E. Activation timecourse of ventral visual stream object-recognition areas: high den-sity electrical mapping of perceptual closure processes. J. Cogn. Neurosci., 2000, 12: 615-621.
Fallgatter, A.J., Brandeis, D. and Strik, W.K. A robust assess-ment of the NoGo- anteriorisation of P300 microstates in a cued Continuous Performance Test. Brain Topogr., 1997, 9: 295-302.
Feinberg, T.E., Schindler, R.J., Ochoa, E., Kwan, P.C. and Farah, M.J. Associative visual agnosia and alexia without prosopagnosia. Cortex, 1994, 30: 395-411.
Feinberg, T.E., Dyckes-Berke, D., Miner, C.R. and Roane, D.M. Knowledge, implicit knowledge and metaknowledge in visual agnosia and pure alexia. Brain, 1995, 118: 789-800. Fletcher, E.M., Kussmaul, C.L. and Mangun, G.R. Estimation of
interpolation errors in scalp topographic mapping. Electroenceph. Clin. Neurophysiol., 1996, 98: 422-434. Frost, J.A., Binder, J.R., Springer, J.A., Hammeke, T.A.,
Bellgowan, P.S., Rao, S.M. and Cox, R.W. Language pro-cessing is strongly left lateralized in both sexes. Evidence from functional MRI. Brain, 1999, 122: 199-208.
George, J.S., Aine, C.J., Mosher, C., Schmidt, M.D., Ranken, D.M., Schlitt, H.A., Wood, C.C., Lewine, J.D., Sanders, J.A. and Belliveau, J.W. Mapping function in the human brain with magnetoencephalography, anatomical magnetic res-onance imaging, and functional magnetic resres-onance imag-ing. J. Clin. Neurophysiol., 1995, 12: 406-431.
Grave de Peralta-Menendez, R. and Gonzalez-Andino, S.L. A critical analysis of linear inverse solutions to the neuroelectromagnetic inverse problem. IEEE Trans. Biomed. Eng., 1998, 45: 440-448.
Khateb, A., Annoni, J.M., Landis, T., Pegna, A.J., Custodi, M.C., Fonteneau, E., Morand, S.M. and Michel, C.M.
Spatio-temporal analysis of electric brain activity during semantic and phonological word processing. Int. J. Psychophysiol., 1999, 32: 215-231.
Khateb, A., Michel, C.M., Pegna, A.J., Landis, T. and Annoni, J.M. New insights into the Stroop effect: a spatio-temporal analysis of electric brain activity. Neuroreport, 2000, 11: 1849-1855.
Khateb, A., Michel, C.M., Pegna, A.J., Landis, T. and Annoni, J.M. Dynamics of brain activation during a word and im-age recognition task: An electrophysiological study. Neuroimage, 2001a, 13: S550 (Abstract).
Khateb, A., Michel, C.M., Pegna, A.J., Thut, G., Landis, T. and Annoni, J.M. The time course of semantic category process-ing in the cerebral hemispheres: an electrophysiological study. Cogn. Brain Res., 2001b, 9: 251-264.
Koenig, T., Kochi, K. and Lehmann, D. Event-related electric microstates of the brain differ between words with visual and abstract meaning. Electroenceph. Clin. Neurophysiol., 1998, 106: 535-546.
Koles, Z.J., Flor-Henry, P. and Lind, J.C. Low resolution electri-cal tomography of the brain during psychometrielectri-cally matched verbal and spatial cognitive tasks. Hum. Brain Map., 2001, 12: 144-156.
Kosslyn, S.M. Image and brain: The resolution of the imagery debate. Cambridge, Massachusetts: The MIT Press, 1996. Kounios, J., Smith, R.W., Yang, W., Bachman, P. and
D’Esposito, M. Cognitive association formation in human memory revealed by spatiotemporal brain imaging. Neu-ron, 2001, 29: 297-306.
Lehmann, D. Principles of spatial analysis. In: A.S. Gevins and A. Remond (Eds.), Handbook of Electroencephalography and Clinical Neurophysiology. Vol 1: Methodes of analy-sis of brain electrical and magnetic signals. Elsevier, Am-sterdam, 1987: 309-354.
Lehmann, D. From mapping to the analysis and interpretation of EEG/EP maps. In: K. Maurer (Ed.), Topgraphic brain mapping of EEG and evoked potentials. Springer, New York, Berlin, Heidelberg, 1989: 54-75.
Menard, M.T., Kosslyn, S.M., Thompson, W.L., Alpert, N.M. and Rauch, S.L. Encoding words and pictures: a positron emission tomography study. Neuropsychologia, 1996, 34: 185-194.
Michel, C.M., Henggeler, B. and Lehmann, D. 42-channel po-tential map series to visual contrast and stereo stimuli: per-ceptual and cognitive event-related potentials. Int. J. Psychophysiol., 1992, 12: 133-145.
Michel, C.M., Grave de Peralta, R., Lantz, G., Gonzalez Andino, S., Spinelli, L., Blanke, O., Landis, T. and Seeck, M. Spatiotemporal EEG analysis and distributed source esti-mation in presurgical epilepsy evaluation. J. Clin. Neurophysiol., 1999a, 16: 239-266.
Michel, C.M., Seeck, M. and Landis, T. Spatio-temporal dynam-ics of human cognition. News Physiol. Sci., 1999b, 14: 206-214.
Michel, C.M. and Lehmann, D. Single doses of Piracetam affect 42-channel event-related potential microstate maps in a cog-nitive paradigm. Neuropsychobiology, 1993, 28: 212-221. Morand, S., Thut, G., de Peralta, R.G., Clarke, S., Khateb, A.,
for fast visual processing through the human koniocellular pathway when stimuli move. Cereb. Cortex, 2000, 10: 817-825.
Nobre, A.C., Allison, T. and McCarthy, G. Word recognition in the human inferior temporal lobe. Nature, 1994, 372: 260-263.
Oldfield, R.C. The assessment and analysis of handedness: the Edinburg Inventory. Neuropsychologia, 1971, 9: 97-113. Pascual-Marqui, R.D., Michel, C.M. and Lehmann, D. Low
res-olution electromagnetic tomography: a new method for lo-calizing electrical activity in the brain. Int. J. Psychopysiol., 1994, 18: 49-65.
Pascual-Marqui, R.D., Michel, C.M. and Lehmann, D. Segmen-tation of brain electrical activity into microstates: Model es-timation and validation. IEEE Trans. Biomed. Eng., 1995, 7: 658-665.
Pegna, A.J., Khateb, A., Spinelli, L., Seeck, M., Landis, T. and Michel, C.M. Unraveling the cerebral dynamics of mental imagery. Hum. Brain Map., 1997, 5: 410-421.
Perani, D., Schnur, T., Tettamanti, M., Gorno-Tempini, M., Cappa, S.F. and Fazio, F. Word and picture matching: a PET study of semantic category effects. Neuropsychologia, 1999, 37: 293-306.
Pollen, D.A. On the neural correlates of visual perception. Cereb. Cortex, 1999, 9: 4-19.
Price, C.J., Wise, R.J. and Frackowiak, R.S. Demonstrating the implicit processing of visually presented words and pseudowords. Cereb. Cortex, 1996, 6: 62-70.
Pugh, K.R., Shaywittz, B.A., Shaywitz, S.E., Constable, R.T., Skudlarski, P., Fulbright, R.K., Bronen, R.A., Shankweiler, D.P., Katz, L., Fletcher, J.M. and Gore, J.C. Cerebral organi-zation of component processes in reading. Brain, 1996, 119: 1221-1238.
Schendan, H.E., Ganis, G. and Kutas, M. Neurophysiological
evidence for visual perceptual categorization of words and faces within 150 ms. Psychophysiology, 1998, 35: 240-251. Shimoyama, I., Nakajima, Y., Ito, T. and Shibata, T. Visual
evoked potentials relating to imagery: words for concrete objects versus absolute concepts. Brain Topogr., 1997, 9: 271-274.
Skrandies, W. Evoked potential correlates of semantic mean-ing: A brain mapping study. Cogn. Brain Res., 1998, 6: 173-183.
Snodgrass, J.G. and Vanderwart, M. A standardized set of 260 pictures: Norms for name agreement, image agreement, familiarity and visual complexity. J. Exp. Psychol., 1980, 6: 174-215.
Tarkiainen, A., Helenius, P., Hansen, P.C., Cornelissen, P.L. and Salmelin, R. Dynamics of letter string perception in the human occipitotemporal cortex. Brain, 1999, 122: 2119-2132.
Thut, G., Hauert, C.A., Morand, S., Seeck, M., Landis, T. and Michel, C.M. Evidence for interhemispheric motor level transfer in a simple reaction time task: An EEG study. Exp. Brain Res., 1999, 128: 256-261.
Thut, G., Hauert, C.A., Viviani, P., Morand, S., Spinelli, L., Blanke, O., Landis, T. and Michel, C. Internally-driven ver-sus externally cued movement selection: A study on the timing of brain activity. Cogn. Brain Res., 2000, 9: 261-269. Vandenberghe, R., Price, C., Wise, R., Josephs, O. and
Frackowiak, R.S. Functional anatomy of a common seman-tic system for words and pictures. Nature, 1996, 383: 254-256.
Vanni, S., Revonsuo, A., Saarinen, J. and Hari, R. Visual aware-ness of objects correlates with activity of right occipital cor-tex. Neuroreport, 1996, 8: 183-186.
Zhang, X.L., Begleiter, H., Porjesz, B. and Litke, A. Visual object priming differs from visual word priming: an ERP study. Electroenceph. Clin. Neurophysiol., 1997, 102: 200-215.