ORIGINAL INVESTIGATION
Neural correlates of free T3 alteration after catecholamine
depletion in subjects with remitted major depressive
disorder and in controls
Philipp Homan&Wayne C. Drevets&Gregor Hasler
Received: 24 June 2013 / Accepted: 7 August 2013 / Published online: 18 August 2013 # Springer-Verlag Berlin Heidelberg 2013
Abstract
Rationale Thyroid hormones and their interactions with cate-cholamines play a potentially important role in alterations of mood and cognition.
Objectives This study aimed to examine the neurobiological effects of catecholamine depletion on thyroid hormones by measuring endocrine and cerebral metabolic function in unmedicated subjects with remitted major depressive disorder (RMDD) and in healthy controls.
Methods This was a randomized, placebo-controlled, and double-blind crossover trial that included 15 unmedicated RMDD subjects and 13 healthy control subjects. The partic-ipants underwent two 3-day-long sessions at 1-week intervals; each participant was randomly administered oral α-methyl-para-tyrosine in one session (catecholamine depletion) and an identical capsule containing hydrous lactose (sham depletion) in the other session prior to a [18F]-fluorodeoxyglucose posi-tron emission tomography scan.
Results Serum concentrations of free T3 (FT3), free T4 (FT4), and TSH were obtained and assessed with respect to their relationship to regional cerebral glucose metabolism. Both serum FT3 (P = 0.002) and FT4 (P = 0.0009) levels were less suppressed after catecholamine depletion compared with placebo treatment in the entire study sample. There was a positive asso-ciation between both FT3 (P =0.0005) and FT4 (P =0.002) and depressive symptoms measured using the Montgomery–Åsberg
Depression Rating Scale. The relative elevation in FT3 level was correlated with a decrease in regional glucose metabolism in the right dorsolateral prefrontal cortex (rDLPFC; P < 0.05, corrected).
Conclusions This study provided evidence of an association between a thyroid–catecholamine interaction and mood regu-lation in the rDLPFC.
Keywords Triiodothyronine . PET . Thyroid . Depression . Catecholamines . Dorsolateral prefrontal cortex
Introduction
The association between thyroid function, brain metabolism, and mood has drawn increasing attention in recent years within the clinical neuroscience literature. With improvements in neu-roimaging techniques, some insights have been gained into the effects of thyroid hormones on the central nervous system, and it is now well established that these hormones modulate a variety of cerebral functions that are involved in mood and cognition (Bauer et al.2008). Notably, research suggests that mood disorders, cognitive impairment, and other psychiatric symptoms may arise even in subjects with subclinically dis-turbed thyroid function (Zhu et al.2006). Patients with manifest thyroid disorders have been shown to have a higher disposition to the development of depressive symptoms (Hendrick et al.
1998), including anxiety induced by hyperthyroidism (Kathol and Delahunt1986). Conversely, depression may be accompa-nied by various subtle thyroid abnormalities. Relatively few previous functional neuroimaging studies have investigated the neural correlates of mood dysfunction in patients with hypo-thyroidism (Bauer et al.2009; Constant et al.2001; Nagamachi et al.2004; Schraml et al.2006; Zhu et al.2006), and these studies reported cerebral hypoperfusion as the most consistent finding (Bauer et al.2009; Constant et al.2001; Forchetti et al.
1997; Kinuya et al.1999; Krausz et al.2007,2004; Nagamachi P. Homan
Department of Psychiatric Neurophysiology, University Hospital of Psychiatry, University of Bern, Bern, Switzerland
W. C. Drevets
Department of Psychiatry, Laureate Institute for Brain Research, The University of Oklahoma School of Medicine, Tulsa, OK 74136, USA G. Hasler (*)
University Hospital of Psychiatry, University of Bern, Bolligenstrasse 111, 3000 Bern, Switzerland e-mail: gregor.hasler@puk.unibe.ch
et al.2004; Schraml et al.2006). In a subgroup of patients, this hypoperfusion subsided after thyroid replacement therapy (Bauer et al. 2009). Thus, the mechanisms underlying the interactions between thyroid function, brain metabolism, and mood remain to be clarified.
The study of the interactions between thyroid hormones and catecholamines is a promising approach to the elucidation of the relationship between central thyroid function and mood. The clinical symptoms of sympathetic overactivity and hyper-thyroidism are strikingly similar, and the similarities between the physiological effects of thyroid hormones and catechol-amines suggest interactions at both peripheral and central receptor sites (Harrison1964; Waldstein1966). At the latter sites, such interactions might explain the augmentation effects of thyroid hormones in patients with major depressive disor-der (MDD) who are treated with monoaminergic antidepres-sants (Bauer and Whybrow2001).
The experimental paradigm of catecholamine depletion affords a relatively direct way to investigate thyroid –catechol-amine interactions in humans (Hasler et al.2008). This con-dition can be induced by administering α-methyl-para-tyro-sine (AMPT), which is a competitive inhibitor of the rate-limiting enzyme in catecholamine synthesis, tyrosine hydrox-ylase (Nagatsu et al. 1964), and decreases catecholamine transmission by depleting central dopamine and norepineph-rine stores (Stine et al.1997; Verhoeff et al.2003). We have reported previously that decreased catecholaminergic neuro-transmission was associated with increased depressive and anhedonic symptoms and with elevated activity in the lim-bic–cortical–striatal–pallidal–thalamic circuitry (Hasler et al.
2008). Here, we examined the same study population with respect to the neurobiological effects of catecholamine deple-tion on thyroid hormones. To avoid a medicadeple-tion bias, we studied unmedicated subjects with remitted MDD (RMDD) and healthy controls to measure endocrine and cerebral met-abolic function. We used the free T3 (FT3), free T4 (FT4), and TSH serum concentrations and the [18F]-fluorodeoxyglucose (18FDG) positron emission tomography (PET) technique to assess the relationships between neurochemistry, neurophysi-ology, and the level of depression measured using the Montgomery–Åsberg Depression Rating Scale (MADRS). Because of the conflicting results regarding the relationship between thyroid hormones and depression (Joffe1993), we based our hypotheses on relatively solid endocrinological data linking catecholamines to thyroid hormones. Since dopami-nergic transmission inhibits TSH secretion (Kaptein et al.
1980), and catecholamines block the TSH-induced stimula-tion of thyroid cells in vitro (Maayan1990; Oda et al.1991), we hypothesized that catecholamine depletion results in higher serum TSH and thyroid hormone levels compared with placebo treatment. In addition, we expected that even small effects of catecholamine depletion on thyroid hormones, with-in the euthyroid state, would suffice to with-induce clwith-inically
relevant mood effects since the brain seems to be sensitive to small changes in thyroid hormone levels (Joffe 1993; Meyer and Hesch 1983; Schueler et al. 1990; Yamada and Wilber 1990). Given that only a few imaging findings are available that have linked thyroid hormones and brain metab-olism, and given that these findings were derived from pa-tients with hypothyroidism who often showed depressive symptoms as a side effect of their illness rather than from patients with true MDD, any hypothesis formulated on the relationship between thyroid hormones, catecholamines, and brain metabolism in patients with remitted MDD may at best be viewed as preliminary. As the cerebral AMPT main effect was an increase in metabolism in the bilateral anteroventral striatum (AVS) (Hasler et al.2008), we hypothesized that this region of interest (ROI) is associated with alterations in thy-roid hormone levels. Given the wide distribution of catechol-aminergic systems and thyroid hormone receptors throughout the brain (Ruel et al.1985; Schwartz and Oppenheimer1978), and furthermore, given that thyroid hormones appear to reg-ulate central noradrenergic neurotransmission with T3 possi-bly acting as a co-transmitter with norepinephrine within the adrenergic receptor system (Gordon et al.1999), we applied an additional whole-brain analysis in an exploratory fashion.
Experimental procedures Participants
We used the data from the study sample that was described in previous studies (Hasler et al.2008,2009; Meyers et al.2011). The experimental group comprised individuals who were aged 18–56 years and who met the Diagnostic and Statistical Manual of Mental Disorders, fourth edition (DSM-IV) criteria for MDD in full remission (RMDD). The healthy controls had no history of any psychiatric disorders and no major psychiatric disorders in first-degree relatives. Diagnosis was established by the Structured Clinical Interview for DSM-IV and confirmed via an unstructured interview with a psychiatrist. The subjects were recruited through the outpatient clinical services of the National Institutes of Mental Health and by advertisements placed in local newspapers and posters placed on the National Institutes of Health campus. Exclusion criteria included major medical ill-nesses, pregnancy, psychotropic drug exposure (including nico-tine) within the previous 3 months, substance abuse within the previous year, a lifetime history of substance dependence, psy-chiatric disorders other than MDD, and structural brain abnor-malities that were observed using magnetic resonance imaging (MRI). Inclusion criteria required that RMDD subjects had remained in remission without medications for at least 3 months and had manifested an onset of depression before 40 years of age. Written informed consent was obtained, as approved by the
institutional review board of the National Institute of Mental Health.
Experimental design
Using a randomized, double-blind, and placebo-controlled cross-over design, subjects underwent two identical sessions that were separated by at least 1 week, in which they received either a body weight-adjusted AMPT dose or a placebo (see Hasler et al.2008
for details). To reduce the risk of adverse reactions, a body weight-adjusted AMPT dose of 40 mg/kg of body weight was administered orally, up to a maximum dose of 4 g, over 22 h. Sham depletion used identical capsules containing hydrous lac-tose. Each session lasted 3 days and was performed on an inpatient basis at the National Institutes of Health Clinical Center. To reduce the risk of crystalluria during AMPT admin-istration, subjects were given sodium bicarbonate, drank at least 2 L of water daily, and underwent urinalysis twice daily. Behavioral ratings included the MADRS and the Beck Anxiety Inventory (BAI). Venous blood was sampled before and 24, 36, and 48 h after the administration of the first AMPT dose in each session, to measure serum FT3, FT4, and TSH levels using an electrochemiluminescent immunoassay (Boehringer Ingelheim Pharma GmbH & Co., KG, Ingelheim, Germany).
PET imaging
The PET imaging methods have been described in detail in our previous report using the same participant cohort (Hasler et al.
2008). Briefly, the PET images were acquired 30 h after the administration of the first AMPT/placebo dose, which corresponded to the period when peak behavioral responses were expected (Berman et al.1999). Scanning was performed using the GE Advance scanner in three-dimensional mode (35 contiguous slices, 4.25 mm thickness; three-dimensional reso-lution=6 mm full width at half maximum; GE Healthcare, Waukesha, WI, USA) and a slow bolus (over 2 min) injection of 18FDG. To obviate the need for arterial blood sampling, cerebral glucose utilization was quantified using a method that combines the left ventricular chamber time–tissue radioactivity data that were measured via dynamic PET imaging of the heart with venous blood sampling, to provide18FDG input function (Moore et al.2003). This method has been validated previously by comparing it to more invasive approaches that use arterial plasma sampling (Moore et al.2003). During image processing, the left ventricular time–radioactivity curve was extended in time to include the time of the brain emission scan by obtaining venous blood samples 25, 30, 35, and 50 min after 18FDG injection. The mean radioactivity of these samples was divided by the mean left ventricular radioactivity concentration regis-tered between 25 and 35 min postinjection. This ratio was used to scale the 50-min venous sample concentration, which then
was appended to the left ventricular curve to complete the input function that was used to generate parametric images of the regional cerebral metabolic rates for glucose (rCMRglu), as described by Moore and colleagues (2003). To provide an anatomical framework for the analysis of the PET images, structural MRI scans were acquired using a 3.0-T scanner. PET image analysis
To assess the correlations between AMPT-induced thyroid alter-ations and AMPT-induced metabolic changes across the whole brain, a voxel-wise analysis of the PET data was performed using the MATLAB (MATLAB version 8, release 14; The MathWorks, Inc., Natick, MA, USA), Statistical Parametric Mapping 8 (SPM8) (Wellcome Trust Centre for Imaging, London, England; www.fil.ion.ucl.ac.uk/spm8), and the toolbox aslm (Homan et al. 2012). PET images were co-registered to the MR images and spatially normalized to the Montreal Neurological Institute brain template using SPM8. Images were filtered with a 6-mm Gaussian smoothing kernel to compensate for anatomical variability and misalignment errors that might have arisen during spatial normalization. The statisti-cal models that were used to compare the normalized rCMRglu included the main effects of placebo vs. drug, subject, and the differences in the serum levels of FT3, FT4, and TSH. To account for differences in baseline levels, the differences in thyroid hormone levels were calculated between the third time point (which coincides approximately with FDG scanning and the peak depressive responses (Hasler et al.2008)) and the first time point (baseline). We reported clusters with a voxel-level threshold of P <0.05, whole-brain corrected for family-wise error.
Statistical analyses
Full factorial linear mixed models with restricted maximum likelihood estimations were used to examine the effects of various outcome measures. Schwarz's Bayesian criteria were used to determine the best fitting covariance structure for each set of measures in cases in which the typical compound sym-metry approach used by ANOVA did not provide the optimal structure for the extant data. The effects of drug, diagnosis, and time on FT3, FT4, and TSH levels were assessed using linear mixed models with a first-order autoregressive covariance structure. The effects of treatment, diagnosis, and time on MADRS and BAI scores were assessed using linear mixed models with an autoregressive covariance structure. Additional models of the MADRS scores were calculated to include FT3, FT4, or TSH levels as additional fixed effects, to assess the influence of thyroid hormones on depressive symp-toms. Subject number and treatment sequence were included as random effects in all models. Post hoc t tests involved the Tukey correction for multiple comparisons. The significance
thresholds for these contrasts were set at a two-tailed alpha= 0.05. SAS 9.2 (SAS Institute, Inc., Cary, NC, USA) was used for all analyses. The means of the data are reported, with their associated standard deviations.
Results
The clinical and demographic characteristics of the subject samples are detailed in Table1.
Behavioral results
Fifteen subjects with RMDD and 13 healthy controls were included in the study. The 13 healthy volunteers (12 females; mean age±standard deviation (SD)=39±12 years) were not significantly different from the 15 RMDD subjects (14 females; mean age±SD=39±11 years) regarding sex ratio and mean age. The mean ratings of mood and anxiety symptoms, sleep-iness, and akathisia for each treatment condition and group, as well as the course of rebound hypomanic symptoms (which were classified according to treatment and group), have been reported previously (Hasler et al.2008, 2009; Meyers et al.
2011). In addition, serum prolactin levels were increased fol-lowing catecholamine depletion (F [1, 203] = 81.79, P < 0.0001), and no effect of diagnosis (P =0.58) or treatment-by-diagnosis interaction (P =0.97) was evident. There was no effect of session order (i.e., whether the AMPT or placebo session occurred first) on thyroid hormone levels, and no treatment-by-session interaction was evident, suggesting that no carry-over effects were present. Consequently, the endocri-nologic data of both sessions were examined further.
FT3 concentration in serum
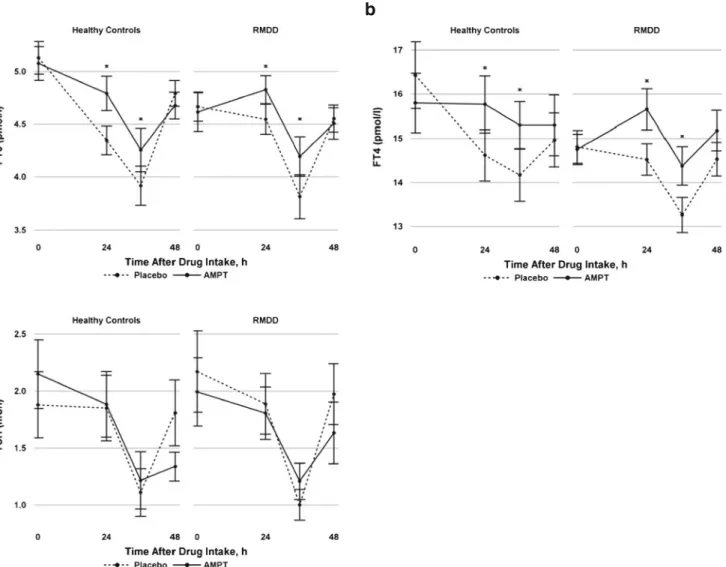
Figure 1ashows the mean FT3 serum concentrations (with standard errors) for the AMPT and placebo treatments. Serum FT3 levels showed a time effect across both conditions and groups (F [3, 144]=43.34, P <0.0001) that was attributable to a suppression at 36 h and a rebound at 48 h. Compared to placebo, serum FT3 levels were less suppressed after AMPT administration in both the RMDD and control samples (F [1, 79.5]=10.62, P =0.002). No effect of diagnosis or treatment-by-diagnosis interaction was evident (P =0.4 and P =0.8, re-spectively). The mean ΔFT3 levels (differences between FT3 at t =3 and FT3 at baseline under AMPT treatment minus the same difference under placebo treatment) were 0.47±0.66 (range, −0.3 to 2.1) and 0.39±0.69 (range, −0.7 to 1.8) in RMDD patients and controls, respectively (t [26]=−0.29, P = 0.77). To examine the effects of FT3 on depressive symptoms, FT3 was included as an additional fixed effect in the modeling of the MADRS and BAI responses. We observed a positive association between FT3 levels and depressive symptoms measured using the MADRS (F [1, 85.5] = 12.97, P = 0.0005). No association was found between FT3 levels and anxiety symptoms measured using the BAI (P =0.28). FT4 concentration in serum
Figure 1b shows the mean FT4 serum concentrations (with standard errors) for the AMPT and placebo treatments. Serum FT4 levels showed a time effect (F [3, 149]=12.61, P < 0.0001) that was attributable to a suppression at 36 h and a rebound at 48 h. Compared to placebo, serum FT4 levels were less suppressed after AMPT administration in both the RMDD and control samples (F [1, 66]=12.2, P =0.0009). No diagno-sis effect (P =0.3) or treatment-by-diagnodiagno-sis interaction (P = 0.4) was evident. The meanΔFT4 levels (differences between FT4 at t =3 and FT4 at baseline under AMPT treatment minus the same difference under placebo treatment) were 0.95±1.02 (range, −0.3 to 2.9) and 1.75±1.35 (range, −0.2 to 4.1) in RMDD patients and controls, respectively (t [25]=1.76, P = 0.09). To examine the effects of FT4 on depressive symptoms, FT4 was included as an additional fixed effect in the modeling of the MADRS and BAI responses. We observed a positive association between FT4 levels and depressive symptoms mea-sured using the MADRS (F [1, 57]=9.89, P =0.003). No association was found between FT4 levels and anxiety symp-toms measured using the BAI (P =0.66).
TSH concentration in serum
Figure1cshows the mean TSH serum concentrations (with standard errors) for the AMPT and placebo treatments. There was a time effect in serum TSH concentrations (F [3, 151]= 41.88, P <0.0001) that was attributable to a suppression at Table 1 Demographic and clinical characteristics of unmedicated
sub-jects with remitted major depressive disorder (RMDD) and healthy controls Characteristic RMDD (n =15) Controls (n =13) Sex, no. f/m 14/1 12/1
Age, mean (SD), years 39 (11) 39 (12) Age at onset, mean (SD), years 24 (8.3) NA Past major depressive episodes, mean (SD), no. 2.7 (1.4) 0 Time in remission, months
Mean (SD) 35 (28) NA
Range 7–18 NA
First-degree relative(s) with a mood disorder, no. 14 0 Remote (>1 year ago) history of alcohol abuse, no. 3 1 History of drug abuse, no. 0 0 MADRS score at study entry, mean (SD) 2.3 (2.1) 0.5 (1.2) f/m female/male, MADRS Montgomery–Åsberg Depression Rating Scale, NA not applicable, SD standard deviation
36 h and a rebound at 48 h across groups and conditions. Catecholamine depletion had no treatment effect (P =0.4) and no diagnosis effect (P =0.8) on serum TSH concentrations. Further, no treatment-by-diagnosis interaction was evident (P =0.7). There was no association between TSH levels and depressive symptoms measured using the MADRS (P =0.5) or anxiety symptoms measured using the BAI (P =0.43). Correlations between regional cerebral metabolism and thyroid hormone serum concentration
Whole-brain metabolism did not differ significantly between the groups at baseline or between the placebo and AMPT conditions (P >0.25 for the main effect of group, the main effect of treatment, and group-by-treatment interactions). Thus, the analyses were performed using globally normalized data, to reduce the variability that was introduced by nonspecific
fluctuations in whole-brain activity. In addition, in the absence of effects of diagnosis and treatment-by-diagnosis on FT3, FT4, and TSH levels, we pooled the data of both groups to perform the analysis. The ROI analysis showed that the AMPT-induced elevation in brain metabolism in the AVS did not correlate with the relative elevation in serum FT3 levels (P =0.33). The additional whole-brain analysis revealed that changes in serum FT3 levels correlated negatively with metabolic changes in the right inferior frontal gyrus (Brodmann area 46), which is part of the right dorsolateral prefrontal cortex (rDLPFC; peak coordinates x, y, and z, 54, 28, and 12; cluster size, 102 voxels; t =6.25, P <0.05, whole-brain corrected for family-wise error; Fig.2). No other cluster in the brain survived a correction for family-wise error, and no regions were identified that exhibited positive correlations between metabolic changes and changes in serum FT3 levels. In addition, a correlational analysis using serum FT4 or TSH
a
c
b
Fig. 1 Mean free T3 (FT3, a ), mean free T4 (FT4, b ), and mean TSH (c) levels with standard errors in healthy control subjects and subjects with remitted major depressive disorder (RMDD) during the course of the catecholamine depletion study using alpha-methyl-para -tyrosine (AMPT) and placebo treatments. Serum thyroid hormone levels at the
third time point, which coincides approximately with fluorodeoxyglucose scanning and with peak depressive responses (Hasler et al.2008), were used in the additional correlational analysis of cerebral glucose metabo-lism. *P <0.05, indicating a significant treatment effect
level changes as covariates did not reveal any significant regions after applying corrections for multiple testing.
Discussion
This study compared the effects of catecholamine depletion on thyroid hormones and brain metabolism. The serum FT3 and FT4 concentrations were higher after catecholamine depletion than they were after placebo treatment in subjects with RMDD and in healthy controls. A significant correlation between an AMPT-induced relative elevation of FT3 level and a corre-sponding decrease in brain metabolism was found in the rDLPFC. There was a positive association between both se-rum FT3 and FT4 levels and depressive symptoms measured using the MADRS.
Regardless of treatment, we observed a suppression of TSH, FT3, and FT4 serum levels at 36 h and a rebound at 48 h which is difficult to interpret. Possibly, the stress of the study procedures (blood drawing, lying in the scanner) has contributed to this hormone suppression. We used catechol-amine depletion with AMPT to study the well-known rela-tionship between thyroid hormones and the sympathetic
nervous system function (Harrison 1964). Hyperthyroidism bears a resemblance to sympathetic overactivity because of the physiological effects that are shared by thyroid hormones and catecholamines. In addition, they interact synergistically, and the effects of catecholamines are exaggerated by excess thyroid hormones and attenuated by thyroid hormone defi-ciencies (Waldstein 1966). Therefore, catecholamine deple-tion was previously considered a possible therapy for hyper-thyroidism (Canary et al. 1957), before it was found that it caused a high incidence of mental depression as a side effect (Buchanan et al.1959). Consistent with our a priori hypothe-sis, serum FT3 and FT4 levels were less suppressed under AMPT than they were under placebo treatment in the whole sample. Previous research has suggested that catecholamines block the TSH-induced stimulation of thyroid cells in vitro (Maayan1990; Oda et al.1991). Thus, the relative elevations in FT3 and FT4 levels observed might be attributable to decreased catecholaminergic neurotransmission.
Our finding that serum FT3 and FT4 levels were less suppressed under AMPT is consistent with the hypothesis linking thyroid hormones and depressive symptoms. This hypothesis was first proposed by Bauer and Whybrow (1988) and suggests that the increased FT4 measures in Fig. 2 Statistical Parametric Mapping image sections illustrating areas in
which AMPT-induced changes in FT3 levels correlated with correspond-ing changes in regional glucose metabolism in a voxel-wise analysis of the combined subject sample (n =28). The serum FT3 levels for each subject were calculated as the difference in the baseline-corrected levels measured at the third time point (which coincides approximately with fluorodeoxyglucose scanning and with peak depressive responses; Hasler et al.2008) between the drug and placebo conditions. This reflected the magnitude of the FT3 alterations that were induced by catecholamine depletion. The statistical models used to assess changes in normalized regional cerebral metabolic rates for glucose included the main effect of drug vs. placebo, the main effect of the serum FT3 levels, and the main effect of subject. There was a significant negative relationship in the right inferior frontal gyrus (Brodmann area 46), which is part of the right dorsolateral prefrontal cortex (peak coordinates x, y, and z, 54, 28, and 12; cluster size, 102 voxels; t =6.25, P <0.05, whole-brain corrected for
family-wise error). No region was identified in which the changes in metabolism correlated positively with the changes in serum FT3 levels. Voxels are displayed on orthogonal planes that were determined from an anatomical MR brain image. The figures are depicted in neurological orientation. The gray-scale image is a T1 structural MR image that is a representative of Montreal Neurological Institute space. Positive values of the x, y, and z coordinates approximately represent millimeters to the right, anterior, and superior direction relative to the anterior commissure. The colored bar indicates voxel t values. Next to the brain slices, the changes in regional metabolism are plotted against the changes in serum FT3 levels. There was a negative relationship between AMPT-induced changes in normalized regional/global cerebral metabolic rates for glu-cose and the corresponding changes in serum FT3 levels (r =−0.78, P < 0.001). The regression line (determined from the Pearson correlation coefficient) represents the regression of the data from RMDD and control subjects pooled together (n =28)
depression are a compensatory response“to maintain affective homeostasis” (Joffe1993). This assumption is consistent with the fact that clinical hypothyroidism is associated with depres-sive symptoms that subside with thyroid replacement therapy (Hendrick et al.1998) and is further supported by the obser-vation that thyroid hormones have proven to be useful as augmentative or accelerating treatments in affective disorders (Bauer et al.2002). The efficacy of both T3 and T4 has been assessed in the treatment of MDD. The majority of studies have assessed the efficacy of T3, and an effect on both the acceleration and the augmentation of mostly tricyclic antide-pressants by T3 has been shown (Altshuler et al. 2001; Aronson et al. 1996). A smaller number of studies have examined the use of T4 and found that the augmentation of antidepressant therapy by T4 in supraphysiological doses is effective in roughly 50 % of patients with treatment-resistant depression (Bauer et al.2005). Comparatively, a significantly higher response to tricyclic antidepressants has been found for T3 (53 %) vs. T4 (19 %) (Joffe and Singer1990). However, the latter study used low T4 doses, whereas more recent studies used supraphysiological doses (Bauer et al. 2005). Thus, the relatively elevated levels of FT3 and FT4 found in our study support the hypothesis of a compensatory response; this finding is in line with that of an early report that suggested a catecholamine–thyroid interaction in the central nervous system (Whybrow and Prange 1981). This compensatory hypothesis is extended by the suggestion that thyroid hor-mones compensate for central catecholamine deficiency. This extended hypothesis is plausible, given that central cat-echolamines are modulated by thyroid hormones. The rela-tively elevated serum FT4 and FT3 levels observed could then be viewed as an insufficient effort to compensate for the decrease in catecholamine levels. This is further supported by our finding of an association between subtle alterations in FT3 levels and altered regional brain metabolism. Specifically, the relatively elevated FT3 levels observed after catecholamine depletion were negatively correlated with a change in regional cerebral metabolism in the rDLPFC. The rDLPFC has been implicated in the pathogenesis of depres-sive symptoms based on various types of evidence (Mayberg
2003). There is reasonable evidence to suggest that glucose metabolism in the rDLPFC is increased in patients with MDD (Mayberg2003), which may explain why many patients with depression benefit from the inhibitory effect of low-frequency transcranial magnetic stimulation (TMS) in this region (Gershon et al. 2003), even though the most widely used TMS target region is slightly superior to the cluster identified here. Thus, our findings support the suggested involvement of the rDLPFC in the pathogenesis of depressive symptoms and lend to previous results by linking decreased regional glucose metabolism to relatively elevated serum FT3 levels. The de-crease in regional metabolism might then be considered a compensatory response to the depressive symptoms related
to catecholamine deficiency. However, since we did not find a difference between subjects with RMDD and controls regard-ing AMPT-induced changes in serum FT3 levels and corre-sponding changes in regional glucose metabolism in the rDLPFC, this finding does not seem to be specific to MDD.
Another hypothesis, conflicting to the first hypothesis and in contrast to our finding, has linked depressive symptoms to an overactive thyroid axis. Most consistently, higher mean FT4 levels have been reported in patients with MDD than in subjects with RMDD and healthy controls (Joffe2006); more-over, these levels subsided with effective treatment (Joffe et al.
1996). These increased FT4 levels might contribute to depres-sive symptoms by inducing higher levels of anxiety, as in hyperthyroidism (Kathol and Delahunt 1986). Thus, it has been hypothesized that the thyroid axis is overactive in MDD (Joffe and Sokolov1994). However, our finding of an association between AMPT-induced depressive symptoms and AMPT-induced relative elevations in thyroid hormone levels was not mediated by a thyroid hormone-related increase in anxiety because we failed to find any association between thyroid hormones and anxiety symptoms.
In contrast with our a priori hypothesis, there was no association between FT3 levels and altered metabolism in the AVS, which was the main cerebral AMPT effect reported previously (Hasler et al.2008). This finding is consistent with the results of our previous study, which did not find a direct relationship between a RMDD diagnosis or AMPT-induced depressive symptoms and AVS metabolism (Hasler et al.
2008). Although, in our previous study, we found that the strongest relationship between catecholamine depletion and depressive symptoms was present in the thalamus and the ventromedial prefrontal cortex, the results of the present study suggest that the thyroid–catecholamine interaction that was associated with mood regulation is located in the rDLPFC.
Surprisingly, AMPT did not affect serum TSH levels sig-nificantly. Earlier findings have shown that dopaminergic transmission inhibits TSH secretion (Kaptein et al. 1980), and later studies have found that AMPT can either cause an increase (Plosker et al. 1995) or a decrease in TSH levels, depending on the length of administration (Zimmermann et al.
2001). It is possible, however, that an increase in TSH in response to catecholamine depletion was offset by a concom-itant reduction in TSH release resulting from the negative feedback inhibition that was elicited in response to a relative elevation in FT3 and FT4 levels.
Our study had several limitations. The relatively small sample of subjects, the oversampling of female study partic-ipants, and the ability of RMDD subjects to remain in remis-sion without current treatment reduced the generalizability of the results. In addition, we were unable to investigate whether the catecholamine depletion-induced effects on FT3 and FT4 levels were mediated via peripheral or central receptor effects; consequently, our study did not establish the mechanism via
which catecholamine depletion leads to an increase in hor-mone levels. Moreover, we did not measure plasma or urinary catecholamine levels to monitor the effect of catecholamine depletion, because there is no consistent relationship between central and peripheral catecholamine levels. Instead, we esti-mated the central AMPT effect by measuring serum prolactin levels, which is the standard method for assessing the depth of central catecholamine depletion (Hasler et al.2008, 2009; Meyers et al.2011). In addition, it is possible that the relative elevation in serum FT3 levels could be due to increased T3 production by conversion of T4 to T3 in various peripheral organs, given that catecholamines have been shown to mod-ulate the monodeiodination of T4 to the biologically more active T3, and that AMPT can alter this process (Ramadan et al.2011; Silva and Larsen1983). Finally, the AMPT effect on serum FT3 and FT4 levels was relatively subtle, and all subjects remained euthyroid during the study. Thus, one might question the clinical significance of these findings. However, it has to be considered that physiological doses of thyroid hormones suffice to supplement the effects of antidepressants, suggesting that even subtle thyroid alterations within the euthyroid state are compatible with clinically relevant mood alterations.
In conclusion, this study provided evidence of an associa-tion between a thyroid–catecholamine interaction and mood regulation in the rDLPFC.
Acknowledgements We are grateful to Nicolas Rodondi for his valu-able comments on an earlier version of the manuscript.
References
Altshuler LL, Bauer M, Frye MA, Gitlin MJ, Mintz J, Szuba MP, Leight KL, Whybrow PC (2001) Does thyroid supplementation accelerate tricyclic antidepressant response? A review and meta-analysis of the literature. Am J Psychiatry 158:1617–1622
Aronson R, Offman HJ, Joffe RT, Naylor CD (1996) Triiodothyronine augmentation in the treatment of refractory depression. A meta-analysis. Arch Gen Psychiatry 53:842–848
Bauer MS, Whybrow PC (1988) Thyroid hormones and the central nervous system in affective illness: interactions that may have clinical signif-icance. Integr Psychiatry 6:75–85
Bauer M, Whybrow PC (2001) Thyroid hormone, neural tissue and mood modulation. World J Biol Psychiatry 2:59–69
Bauer M, Heinz A, Whybrow PC (2002) Thyroid hormones, serotonin and mood: of synergy and significance in the adult brain. Mol Psychiatry 7:140–156
Bauer M, London ED, Rasgon N, Berman SM, Frye MA, Altshuler LL, Mandelkern MA, Bramen J, Voytek B, Woods R, Mazziotta JC, Whybrow PC (2005) Supraphysiological doses of levothyroxine alter regional cerebral metabolism and improve mood in bipolar depression. Mol Psychiatry 10:456–469
Bauer M, Goetz T, Glenn T, Whybrow PC (2008) The thyroid–brain interaction in thyroid disorders and mood disorders. J Neuroendocrinol 20:1101–1114
Bauer M, Silverman DH, Schlagenhauf F, London ED, Geist CL, van Herle K, Rasgon N, Martinez D, Miller K, van Herle A, Berman SM, Phelps ME, Whybrow PC (2009) Brain glucose metabolism in hypothyroidism: a positron emission tomography study before and after thyroid hormone replacement therapy. J Clin Endocrinol Metab 94:2922–2929
Berman RM, Narasimhan M, Miller HL, Anand A, Cappiello A, Oren DA, Heninger GR, Charney DS (1999) Transient depressive relapse induced by catecholamine depletion: potential phenotypic vulnera-bility marker? Arch Gen Psychiatry 56:395–403
Buchanan J, Buchanan WW, Crooks J, Gale GE (1959) The use of reserpine in the treatment of thyrotoxicosis. Scott Med J 4:486–490 Canary JJ, Schaaf M, Duffy BJ Jr, Kyle LH (1957) Effects of oral and intramuscular administration of reserpine in thyrotoxicosis. N Engl J Med 257:435–442
Constant EL, de Volder AG, Ivanoiu A, Bol A, Labar D, Seghers A, Cosnard G, Melin J, Daumerie C (2001) Cerebral blood flow and glucose metabolism in hypothyroidism: a positron emission tomog-raphy study. J Clin Endocrinol Metab 86:3864–3870
Forchetti CM, Katsamakis G, Garron DC (1997) Autoimmune thyroiditis and a rapidly progressive dementia: global hypoperfusion on SPECT scanning suggests a possible mechanism. Neurology 49:623–626
Gershon AA, Dannon PN, Grunhaus L (2003) Transcranial magnetic stimulation in the treatment of depression. Am J Psychiatry 160:835–845
Gordon JT, Kaminski DM, Rozanov CB, Dratman MB (1999) Evidence that 3,3′,5-triiodothyronine is concentrated in and delivered from the locus coeruleus to its noradrenergic targets via anterograde axonal transport. Neuroscience 93:943–954
Harrison TS (1964) Adrenal medullary and thyroid relationships. Physiol Rev 44:161–185
Hasler G, Fromm S, Carlson PJ, Luckenbaugh DA, Waldeck T, Geraci M, Roiser JP, Neumeister A, Meyers N, Charney DS, Drevets WC (2008) Neural response to catecholamine depletion in unmedicated subjects with major depressive disorder in remission and healthy subjects. Arch Gen Psychiatry 65:521–531
Hasler G, Luckenbaugh DA, Snow J, Meyers N, Waldeck T, Geraci M, Roiser J, Knutson B, Charney DS, Drevets WC (2009) Reward processing after catecholamine depletion in unmedicated, remitted subjects with major depressive disorder. Biol Psychiatry 66:201–205 Hendrick V, Altshuler L, Whybrow P (1998) Psychoneuroendocrinology of mood disorders. The hypothalamic-pituitary-thyroid axis. Psychiatr Clin North Am 21:277–292
Homan P, Kindler J, Hubl D, Dierks T (2012) Auditory verbal halluci-nations: imaging, analysis, and intervention. Eur Arch Psychiatry Clin Neurosci 262(Suppl 2):91–95
Joffe R (1993) The thyroid axis and psychiatric illness. American Psychiatric, Washington DC
Joffe RT (2006) Is the thyroid still important in major depression? J Psychiatry Neurosci 31:367–368
Joffe RT, Singer W (1990) A comparison of triiodothyronine and thyrox-ine in the potentiation of tricyclic antidepressants. Psychiatry Res 32:241–251
Joffe RT, Sokolov ST (1994) Thyroid hormones, the brain, and affective disorders. Crit Rev Neurobiol 8:45–63
Joffe R, Segal Z, Singer W (1996) Change in thyroid hormone levels following response to cognitive therapy for major depression. Am J Psychiatry 153:411–413
Kaptein EM, Spencer CA, Kamiel MB, Nicoloff JT (1980) Prolonged dopamine administration and thyroid hormone economy in normal and critically ill subjects. J Clin Endocrinol Metab 51:387–393
Kathol RG, Delahunt JW (1986) The relationship of anxiety and depres-sion to symptoms of hyperthyroidism using operational criteria. Gen Hosp Psychiatry 8:23–28
Kinuya S, Michigishi T, Tonami N, Aburano T, Tsuji S, Hashimoto T (1999) Reversible cerebral hypoperfusion observed with Tc-99m HMPAO SPECT in reversible dementia caused by hypothyroidism. Clin Nucl Med 24:666–668
Krausz Y, Freedman N, Lester H, Newman JP, Barkai G, Bocher M, Chisin R, Bonne O (2004) Regional cerebral blood flow in patients with mild hypothyroidism. J Nucl Med 45:1712–1715
Krausz Y, Freedman N, Lester H, Barkai G, Levin T, Bocher M, Chisin R, Lerer B, Bonne O (2007) Brain SPECT study of common ground between hypothyroidism and depression. Int J Neuropsychopharmacol 10:99–106
Maayan ML (1990) Catecholamines and the thyroid. Thyroid 1:39–42 Mayberg HS (2003) Modulating dysfunctional limbic-cortical circuits in
depression: towards development of brain-based algorithms for diagnosis and optimised treatment. Br Med Bull 65:193–207 Meyer T, Hesch RD (1983) Triiodothyronamine—a beta-adrenergic
me-tabolite of triiodothyronine? Horm Metab Res 15:602–606 Meyers N, Fromm S, Luckenbaugh DA, Drevets WC, Hasler G (2011)
Neural correlates of sleepiness induced by catecholamine depletion. Psychiatry Res 194:73–78
Moore DF, Altarescu G, Barker WC, Patronas NJ, Herscovitch P, Schiffmann R (2003) White matter lesions in Fabry disease occur in‘prior’ selectively hypometabolic and hyperperfused brain re-gions. Brain Res Bull 62:231–240
Nagamachi S, Jinnouchi S, Nishii R, Ishida Y, Fujita S, Futami S, Kodama T, Tamura S, Kawai K (2004) Cerebral blood flow abnormalities induced by transient hypothyroidism after thyroidectomy—analysis by tc-99m-HMPAO and SPM96. Ann Nucl Med 18:469–477
Nagatsu T, Levitt M, Udenfriend S (1964) Tyrosine hydroxylase. The initial step in norepinephrine biosynthesis. J Biol Chem 239:2910–2917 Oda Y, Tajima K, Mori-Tanaka M, Matsui I, Kitajima K, Miyagawa J,
Hanafusa T, Mashita K, Tarui S (1991) Alpha 1-adrenergic regulation of thyrotropin-stimulated release of 3,5,3′-triiodothyronine and thyrox-ine from perifused mouse thyroid. J Endocrinol Invest 14:867–873 Plosker SM, Rabinovici J, Montalvo M, Jaffe RB (1995) Endogenous
catecholamines suppress thyrotropin secretion during the early fol-licular phase of the menstrual cycle. J Clin Endocrinol Metab 80:2530–2533
Ramadan W, Marsili A, Larsen PR, Zavacki AM, Silva JE (2011) Type-2 iodothyronine 5'deiodinase (D2) in skeletal muscle of C57Bl/6 mice. II. Evidence for a role of D2 in the hypermetabolism of thyroid hormone receptor alpha-deficient mice. Endocrinology 152:3093–102
Ruel J, Faure R, Dussault JH (1985) Regional distribution of nuclear T3 receptors in rat brain and evidence for preferential localization in neurons. J Endocrinol Invest 8:343–348
Schraml FV, Beason-Held LL, Fletcher DW, Brown BP (2006) Cerebral accumulation of Tc-99m ethyl cysteinate dimer (ECD) in severe, transient hypothyroidism. J Cereb Blood Flow Metab 26:321–329 Schueler PA, Schwartz HL, Strait KA, Mariash CN, Oppenheimer JH
(1990) Binding of 3,5,3′-triiodothyronine (T3) and its analogs to the in vitro translational products of c-erbA protooncogenes: differences in the affinity of the alpha- and beta-forms for the acetic acid analog and failure of the human testis and kidney alpha-2 products to bind T3. Mol Endocrinol 4:227–234
Schwartz HL, Oppenheimer JH (1978) Nuclear triiodothyronine receptor sites in brain: probable identity with hepatic receptors and regional distribution. Endocrinology 103:267–273
Silva JE, Larsen PR (1983) Adrenergic activation of triiodothyronine production in brown adipose tissue. Nature 305:712–3
Stine SM, Krystal JH, Petrakis IL, Jatlow PI, Heninger GR, Kosten TR, Charney DS (1997) Effect of alpha-methyl-para-tyrosine on re-sponse to cocaine challenge. Biol Psychiatry 42:181–190 Verhoeff NP, Christensen BK, Hussey D, Lee M, Papatheodorou G,
Kopala L, Rui Q, Zipursky RB, Kapur S (2003) Effects of catechol-amine depletion on D2 receptor binding, mood, and attentiveness in humans: a replication study. Pharmacol Biochem Behav 74:425– 432
Waldstein SS (1966) Thyroid–catecholamine interrelations. Annu Rev Med 17:123–132
Whybrow PC, Prange AJ Jr (1981) A hypothesis of thyroid–catechol-amine–receptor interaction. Its relevance to affective illness. Arch Gen Psychiatry 38:106–113
Yamada M, Wilber JF (1990) Reciprocal regulation of preprothyrotropin-releasing hormone (TRH) mRNA in the rat anterior hypothalamus by thyroid hormone: dissociation from TRH concentrations during hypothyroidism. Neuropeptides 15:49–53
Zhu DF, Wang ZX, Zhang DR, Pan ZL, He S, Hu XP, Chen XC, Zhou JN (2006) fMRI revealed neural substrate for reversible working mem-ory dysfunction in subclinical hypothyroidism. Brain 129:2923– 2930
Zimmermann RC, Krahn LE, Klee GG, Ditkoff EC, Ory SJ, Sauer MV (2001) Prolonged inhibition of presynaptic catecholamine synthesis with alpha-methyl-para-tyrosine attenuates the circadian rhythm of human TSH secretion. J Soc Gynecol Investig 8:174–178