For Peer Review Only
Effect of vestibular stimulation using a rotatory chair in human rest/activity rhythm
Journal: Chronobiology International Manuscript ID LCBI-2019-0207.R4 Manuscript Type: Report
Date Submitted by the Author: n/a
Complete List of Authors: Pasquier, Florane; Normandie Univ, UNICAEN, INSERM, COMETE, GIP CYCERON
Bessot, Nicolas; Normandie Univ, UNICAEN, INSERM, COMETE, GIP CYCERON
Martin, Tristan; Normandie Univ, UNICAEN, INSERM, COMETE, GIP CYCERON
Gauthier, Antoine; Normandie Univ, UNICAEN, INSERM, COMETE, GIP CYCERON
Bulla, Jan; University of Bergen; University of Regensburg
Denise, Pierre; Normandie Univ, UNICAEN, INSERM, COMETE, GIP CYCERON
Quarck, Gaëlle; Normandie Univ, UNICAEN, INSERM, COMETE, GIP CYCERON
For Peer Review Only
Effects of vestibular stimulation induced by a rotatory chair on the human
rest/activity rhythm
Florane Pasquiera*, Nicolas Bessota, Tristan Martina, Antoine Gauthiera, Jan Bullab, c, Pierre
Denisea, Gaëlle Quarcka
a Normandie Univ, UNICAEN, INSERM, COMETE, GIP CYCERON, 14000 Caen, France b Department of Mathematics, University of Bergen, Bergen, Norway
c Department of Psychiatry and Psychotherapy, University Regensburg, Regensburg,
Germany
* Corresponding author at: Florane Pasquier, Ph.D student
E-mail address: florane.pasquier@unicaen.fr, Phone: +33 (0)2 31 56 82 14, Fax: +33 (0)2 31 56 82 19 3 4 5 6 7 8 9 10 11 12 13 14 15 16 17 18 19 20 21 22 23 24 25 26 27 28 29 30 31 32 33 34 35 36 37 38 39 40 41 42 43 44 45 46 47 48 49 50 51 52 53 54 55 56 57 58 59
For Peer Review Only
Effects of vestibular stimulation induced by a rotatory chair on the human
rest/activity rhythm
Abstract
The vestibular system is responsible for sensing every angular and linear head acceleration, mainly during periods of motor activity. Previous animal and human experiments have shown biological rhythm disruptions in small rodents exposed to a hypergravity environment, but also in patients with bilateral vestibular loss compared to a control population. This raised the hypothesis of the vestibular afferent influence on circadian rhythm synchronization. The present study aimed to test the impact of vestibular stimulation induced by a rotatory chair on the rest/activity rhythm in human subjects. Thirty-four healthy adults underwent both sham (SHAM) and vestibular stimulation (STIM) sessions scheduled at 18:00h. An off-vertical axis rotation on a rotatory chair was used to ecologically stimulate the vestibular system by head accelerations. The rest/activity rhythm was continuously registered by actigraphy. The recording started one week before the first session (BASELINE), continued in the week between the two sessions and one week after the second session. Vestibular stimulation caused a significant decrease in the average activity level in the evening following the vestibular stimulation. A significant phase advance in the rest/activity rhythm occurred two days after the 18:00h vestibular stimulation session. Moreover, the level of motion sickness symptoms increased significantly after vestibular stimulation. The present study confirms previous results on the effect of vestibular stimulation and the role of vestibular afferents on circadian biological rhythmicity. Our results support the hypothesis of the implication of vestibular afferents as non-photic stimuli acting on circadian rhythms.
3 4 5 6 7 8 9 10 11 12 13 14 15 16 17 18 19 20 21 22 23 24 25 26 27 28 29 30 31 32 33 34 35 36 37 38 39 40 41 42 43 44 45 46 47 48 49 50 51 52 53 54 55 56 57 58 59 60
For Peer Review Only
KeywordsActigraphy; circadian rhythms; motor activity; rest/activity rhythm, vestibular system
Word count: 3702 3 4 5 6 7 8 9 10 11 12 13 14 15 16 17 18 19 20 21 22 23 24 25 26 27 28 29 30 31 32 33 34 35 36 37 38 39 40 41 42 43 44 45 46 47 48 49 50 51 52 53 54 55 56 57 58 59
For Peer Review Only
IntroductionAll mammalian organisms display daily changes over a 24 h period. Thus, all physiological functions such as temperature, rest/activity cycle, or hormonal secretion show circadian variations (Haffen 2009), which are essential in preparing the body for daily activities and night-time rest. The mammalian central biological clock, in charge of the genesis and maintenance of the biological rhythms, is located in the suprachiasmatic nuclei (SCN) of the hypothalamus (Stephan & Zucker 1972; Inouye & Kawamura 1979). The biological clock needs to be trained daily to synchronize and keep circadian rhythms aligned with its environmental time. This can mainly be achieved through day/night alternance, transmitting photic information directly to the central biological clock through the visual system (Moore & Silver 1998). While light is the main stimulus for synchronizing mammalian circadian rhythms (Zordan et al. 2001; Duffy & Wright 2005), non-photic stimuli, such as physical activity and social activities, have proved to effectively synchronize circadian rhythms in humans (Barger et al. 2004; Mistlberger & Skene 2004).
The recent literature raises the hypothesis that vestibular afferents could influence the circadian timing system. The vestibular system, located in the inner ear, is composed of three semi-circular canals and two otolithic organs, respectively responsible for angular and linear head acceleration detection. The system is principally involved in postural control and gaze stabilization during locomotion (Peterson & Richmond 1988; Grossman et al. 1989). A continuous change in canalicular and otolithic information is integrated by the central nervous system, during the day, when head accelerations in space occur. This information is largely reduced to an uncommon change in otolithic organ activity during the night. Thus, the vestibular system works in parallel with human activity, particularly with motor activity. This functioning raises the question of the potential implication of the vestibular system as a synchronizer of biological rhythms.
3 4 5 6 7 8 9 10 11 12 13 14 15 16 17 18 19 20 21 22 23 24 25 26 27 28 29 30 31 32 33 34 35 36 37 38 39 40 41 42 43 44 45 46 47 48 49 50 51 52 53 54 55 56 57 58 59 60
For Peer Review Only
Although the true nature of the mechanism remains unknown, anatomical evidence, which could explain links between the vestibular system and the circadian timing system, has been demonstrated in rodents. Cavdar et al. (2001) reported vestibular projections from medial and lateral vestibular nuclei to the posterior hypothalamic nucleus. Reciprocal projections between the medial vestibular nucleus and the orexin neurons involved in the sleep/wake cycle were demonstrated in rodents (Horowitz et al. 2005). The paradigms using a hypergravity environment reinforce anatomical observations. In one study, chronic 2G centrifugation caused a robust c-Fos expression in the SCN of the hypothalamus in wildtype mice compared to het mice (otoconia deficient) (Fuller et al. 2004). This study confirmed the role of the otolithic organs in the mammalian circadian system.
Chronic 2G centrifugation induces a loss of circadian rhythmicity which generally occurs within one day to one week, as observed in mice, dogs, and squirrel monkeys (Oyama et al. 1971; Oyama 1975; Fuller 1985; Murakami et al. 2002; Holley et al. 2003). It was subsequently shown that hypergravity-driven circadian disruption required signaling by the vestibular otolith organs (Fuller et al. 2002). A link between vestibular signaling and the circadian clock at normal Earth's gravity, including an influence on the intrinsic period and the period-altering response to changes in tonic light intensity, was later shown by the same group (Fuller & Fuller 2006). The loss of vestibular functions in animals and in humans with bilateral vestibular loss have also caused circadian rhythm changes, with a total loss of circadian rhythms of temperature and locomotor activity in animals (Martin et al. 2014) and have altered the rest/activity cycle, temperature, and cortisol variations in humans (Martin et al. 2016). These results support the hypothesis of the involvement of vestibular inputs in circadian rhythm regulation.
In humans, vestibular stimulation through swinging has demonstrated an accelerated
3 4 5 6 7 8 9 10 11 12 13 14 15 16 17 18 19 20 21 22 23 24 25 26 27 28 29 30 31 32 33 34 35 36 37 38 39 40 41 42 43 44 45 46 47 48 49 50 51 52 53 54 55 56 57 58 59
For Peer Review Only
(Bayer et al. 2011). Otolith stimulation induced by accelerated linear bed movements seems to have a potential effect on drowsiness (Woodward et al. 1990; Crivelli et al. 2016). Positive effects of vestibular stimulation on the wake/sleep transition were recently confirmed in mice (Kompotis et al. 2019). Even though vestibular stimulation can modulate sleep parameters, such as sleep latency or the wake/sleep transition, the impact of vestibular stimulation on the rest/activity rhythm has not been tested.
The present study aimed to evaluate the impact of vestibular stimulation by using a rotatory chair on the rest/activity rhythm in young healthy adults. The rotatory chair enables the stimulation of the semi-circular canals and the otolith organs. It is a standard clinical examination used by physiologists and clinicians to test vestibular function. This method reproduces the natural stimulation of the vestibular system, unlike caloric vestibular stimulation. Our objective was to demonstrate that the vestibular stimulation induced by a rotatory chair is able to modify the rest/activity rhythm in humans.
3 4 5 6 7 8 9 10 11 12 13 14 15 16 17 18 19 20 21 22 23 24 25 26 27 28 29 30 31 32 33 34 35 36 37 38 39 40 41 42 43 44 45 46 47 48 49 50 51 52 53 54 55 56 57 58 59 60
For Peer Review Only
Materials and methodsSubjects
Thirty-four healthy adults (aged 23.32 ± 2.57 yrs; 13 women and 21 men) were recruited. The protocol was approved by the national Ethic Committee for the Research in Sciences and Technics of Physical Activity and Sports (CERSTAPS, 2020-17-01-42), and conducted in accordance with current national and international laws and regulations governing the use of human subjects (Declaration of Helsinki II), and complied with the ethical and methodological standards for laboratory and medical human biological rhythm research (Portaluppi et al. 2010). All participants provided written informed consent after having received explanations about the study procedures in detail. The subjects who presented with vestibular or sleep disorders, and night workers or shift workers were excluded. Each participant’s chronotype was determined using the Horne and Östberg Morningness-Eveningness Questionnaire. Some 24 participants were of “intermediate” chronotype, 3 were of “moderate morning” type, 5 were of “moderate evening” type, 1 was of “definitely morning” type, and 1 was of “definitely evening” type (Horne & Ostberg 1976). During the BASELINE actimetry recording, participants went to bed at 00 : 41h ± 27 min, and woke up at 8 : 45h ± 16 min on average.
Vestibular stimulation
The subjects were seated in a rotatory chair, and then immobilized using a harness. Each subject underwent a sham session (SHAM) and a stimulation session (STIM) in a counterbalanced order. The two sessions were carried out in the late afternoon (18:00h), on the same day of the week and at the same hour to avoid any diurnal or weekly variation (Zouabi et al. 2016). During physical activity, repeated head accelerations induce a natural
3 4 5 6 7 8 9 10 11 12 13 14 15 16 17 18 19 20 21 22 23 24 25 26 27 28 29 30 31 32 33 34 35 36 37 38 39 40 41 42 43 44 45 46 47 48 49 50 51 52 53 54 55 56 57 58 59
For Peer Review Only
vestibular stimulation. Buxton et al. (2003) demonstrated that early evening physical activity session induced a significant phase advance effect of melatonin secretion. We supposed that the effect of physical activity on the circadian biological rhythms could be partially mediated by the vestibular system.
During the STIM session, the vestibular stimulation was divided into two sequences. During the first trial, the chair moved in an Off Vertical Axis Rotation (OVAR) for 10 min in a clockwise direction. After a 2-min break, a second 10-min counterclockwise in direction OVAR phase took place of. The order of direction (clockwise, counterclockwise) was counterbalanced. During the OVAR, a tilt angle of 15° and a rotational velocity of 60°/s were chosen in order to make the examination moderately nauseogenic (Denise et al. 1996). The velocity step was increased from 0 to 60°/s in 1 sec. The OVAR was used to naturally stimulate the semi-circular canals and otolith organs by linear and angular head accelerations. The semi-circular canals were stimulated by the velocity step, and the otoliths by the tilt angle. We changed the rotation direction (clockwise, counterclockwise) to stimulate both right and left horizontal semi-circular canals of the vestibular system. The horizontal semi-circular canal on the right side of the head is activated during right horizontal acceleration, while the contralateral canal on the left side is inhibited (Baloh & Honrubia 2011). During the SHAM session, the rotatory chair did not move and was not inclined to avoid any vestibular stimulation. All sessions were carried out in complete darkness to avoid visual stimulation.
Actigraphy measure
Actigraphy was measured continuously 1 week before the first session (BASELINE), the week between the first and second sessions, and 1 week after the second session. Each subject wore an actigraph (Motion Watch 8 ®, Neurotechnology, Cambridge, UK) on the non-dominant hand during all 3 weeks of the protocol, except when showering or swimming. An accelerometer placed on the actigraph allowed body movements to be accurately recorded.
3 4 5 6 7 8 9 10 11 12 13 14 15 16 17 18 19 20 21 22 23 24 25 26 27 28 29 30 31 32 33 34 35 36 37 38 39 40 41 42 43 44 45 46 47 48 49 50 51 52 53 54 55 56 57 58 59 60
For Peer Review Only
Amounts of time were recorded if the level of the signal produced in response to movement during a 1-min time period was above a 0.01G threshold. Participants were also asked to complete a diary to record their daily sleep schedule, including bedtime, estimated sleep onset, wake times, and night-time awakenings.
Data analysis
Six subjects withdrew from the protocol, and their data were excluded from all statistical analyses. We have excluded them from our analysis because they stopped the stimulation. They pressed the panic button when the stimulation was in progress due to severe motion sickness symptoms. The resulting stimulation received was thus not similar to that of the other participants. Two of the remaining participants were withdrawn from the rest/activity rhythm analysis, and from actigraphic estimates of sleep/wake cycle analysis, due to a dysfunction of the actigraph.
Rest/activity rhythm
The average activity levels measured between 16:00 and 00:00h after the three conditions (BASELINE, SHAM, STIM) were compared to evaluate the short-term effects of the vestibular stimulation.
The rest/activity rhythm was analyzed with the cosinor method. To capture the condition effect of the actigraph variables, we selected a generalized nonlinear least squares regression approach. More specifically, we used the common cosinor function parameterized by: 3 4 5 6 7 8 9 10 11 12 13 14 15 16 17 18 19 20 21 22 23 24 25 26 27 28 29 30 31 32 33 34 35 36 37 38 39 40 41 42 43 44 45 46 47 48 49 50 51 52 53 54 55 56 57 58 59
For Peer Review Only
𝑌(𝑡) = mesor + ampl ∙ cos
(
(t ― phase) ∙ 2.π 𝑝)
The interpretation of the parameters of this function is as follows. mesor: the 24 h time series average level,ampl: amplitude (activity level at the acrophase – mesor). Acrophase is the Cosinor-derived time of the peak activity level,
phase: the time of the acrophase, P: Period of the rhythm (24 h).
Actigraphic estimates of the sleep/wake cycle
The actigraph-obtained data were analyzed by Motionwatch MotionWare Software (Cambridge Neurotechnology Ltd., Cambridge, UK). The following variables were selected for data analysis: wake-up time, bedtime, assumed sleep time, sleep efficiency, and sleep fragmentation index. When assessed with actigraphy, sleep fragmentation may refer to the amount of movement or restlessness in a sleep period. For example, actigraph software programs use algorithms to calculate a sleep fragmentation index, based on the number of interruptions of sleep by physical movement calculated as 100 × the number of groups of consecutive mobile 30-s epochs/by the total number of immobile epochs. As provided by the Non-Parametric Circadian Rhythm Analysis (NPCRA) (Van Someren et al. 1999), L5 is the least active 5 h period and M10 is the most active 10 h period of the 24 h.
Motion sickness measure
Motion sickness symptoms were assessed using the Graybiel scale form (Graybiel et al. 1968). They were measured before (pre-tests) and after (post-tests) SHAM and STIM
3 4 5 6 7 8 9 10 11 12 13 14 15 16 17 18 19 20 21 22 23 24 25 26 27 28 29 30 31 32 33 34 35 36 37 38 39 40 41 42 43 44 45 46 47 48 49 50 51 52 53 54 55 56 57 58 59 60
For Peer Review Only
sessions. The measures were repeated 1 h tests +1 h), 2 h tests +2 h), 24 h (post-tests +24 h), and 48 h (post-(post-tests +48 h) after the two sessions.
Statistical analysis
We performed multifactorial non-parametric analyses of variance for repeated measures (Brunner et al. 2002) for variables when there were disparities from both the assumption of normality and homoscedasticity and sphericity of the data. The methods used were implemented in the R package nparLD (Noguchi et al. 2012). This non-parametric analysis technique is particularly suited to data with repeated measures in factorial experiments and served for examining the effects and possible interactions between the repeated factors condition (with BASELINE, SHAM, STIM values) and time (with pre-tests, post-tests, post-tests+1 h, post-tests+2 h, post-tests+24 h, post-tests+48 h values) or day (next day, two days) depending on the variable. We followed the same logic for many of our analysis. First, we fitted a full model for the “ld.f2” design. If a significant effect was indicated by the Wald statistic, we proceeded to the second step with post hoc testing by means of Wilcoxon tests. The p-values of the post hoc testing were adjusted by Holm’s method in order to account for multiple comparisons. Furthermore, we carried out a unifactorial non-parametric variance analysis for repeated measures using the “ld.f1” design for the average activity measured at the end of day one between 16:00h and 00:00h. The predictor variable was the repeated factor condition (with BASELINE, SHAM, STIM values) and, as described above. Wilcoxon’s test was used for post hoc analysis.
For the cosinor analysis, we evaluated the condition effects (BASELINE, SHAM, STIM) by progressively adding (one by one) these effects to mesor, amplitude, and phase values. In order to evaluate which model was most appropriate for the data analysis, we
3 4 5 6 7 8 9 10 11 12 13 14 15 16 17 18 19 20 21 22 23 24 25 26 27 28 29 30 31 32 33 34 35 36 37 38 39 40 41 42 43 44 45 46 47 48 49 50 51 52 53 54 55 56 57 58 59
For Peer Review Only
considered various model specifications and compared them by means of the model selection criteria, i.e. the Akaike Information Criterion (AIC), Bayesian Information Criterion (BIC), and the Likelihood Ratio Tests (LRT) (Pinheiro & Bates 2006). In the Results section, we present parameter estimation results only for the best model, i.e., the model which could not be improved by adding any effects; more specifically, the core statistical result presented in addition to AIC and BIC is a model comparison based on LRT. We show the values of these statistics and associated p-values. When the LRT indicated a significant effect of a variable, the coefficients of the model were further examined and represented as the t- and p-values associated with each variable tested. Probability (p) values of less than 0.05 were assumed to indicate statistical significance.
3 4 5 6 7 8 9 10 11 12 13 14 15 16 17 18 19 20 21 22 23 24 25 26 27 28 29 30 31 32 33 34 35 36 37 38 39 40 41 42 43 44 45 46 47 48 49 50 51 52 53 54 55 56 57 58 59 60
For Peer Review Only
ResultsRest/activity rhythm
The average activity levels (activity counts per min, ac/min) measured in the evening after BASELINE, SHAM, and STIM conditions demonstrated a significant condition effect (p < 0.01). The post hoc analysis revealed a significant decrease after the STIM condition (161.71 ± 45.73 ac/min) compared with the SHAM (207.97 ± 86.86 ac/min) condition (Figure 1).
[Figure 1 here]
The statistical analysis revealed a significant phase advance (p < 0.001) of the rest/activity rhythm acrophase by 1.15 h in the STIM condition (to 15:22h) compared to the BASELINE and SHAM conditions (16:37h), two days after the session (Figure 2). The circadian amplitude (123.31 ± 5.48 ac/min) and mesor (146.59 ± 3.89 ac/min) gave similar results regardless of the condition. The analysis did not uncover any significant effect on the day following the sessions (p = 0.39).
[Figure 2 here]
Table 1 shows all models fitted to the data. The models are categorized by increasing complexity, starting with the “null model”, only consisting of a constant. The columns show (from left to right) the model name, the number of degrees of freedom (df) of the model, the AIC, the BIC, the log-likelihood (loglik), the models tested by an LRT, the statistic of the LRT, and the p-value of the LRT. Interpretation of the information of this table is as follows.
3 4 5 6 7 8 9 10 11 12 13 14 15 16 17 18 19 20 21 22 23 24 25 26 27 28 29 30 31 32 33 34 35 36 37 38 39 40 41 42 43 44 45 46 47 48 49 50 51 52 53 54 55 56 57 58 59
For Peer Review Only
The lower values of AIC and BIC indicate the best model. Both criteria favor the third model, which incorporates a phase effect in the STIM condition.
[Table 1 here]
Actigraphic estimates of sleep/wake cycle
Vestibular stimulation did not affect the sleep habits, wake-up time (condition p = 0.29; day p = 0.09; condition*day p = 0.09), and bedtime (condition p = 0,34; day p = 0,34; condition*day p = 0,84), and, therefore, it did not show any significant effects. Likewise, the assumed sleep time (condition p = 0.87; day p = 0.67; condition*day p = 0.34), sleep efficiency (condition p = 0.25; day p = 0.89; condition*day p = 0.30), and sleep fragmentation index (condition p = 0.43; day p = 0.26; condition*day p = 0.34) did not differ, no matter the conditions. The L5 (condition p = 0.72; day p = 0.42; condition*day p = 0.91) and M10 (condition p = 0.23; day p = 0.53; condition*day p = 0.71) measured after BASELINE, SHAM, and STIM conditions did not show significant differences. Each analysis includes both the first and second day after each condition.
Motion sickness symptoms
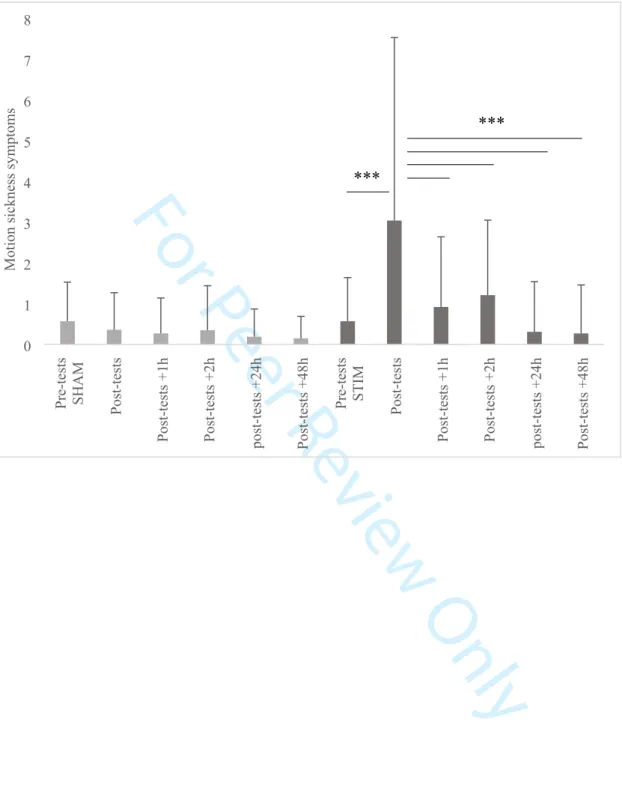
The statistical analysis of motion sickness symptoms measured by the graybiel scale demonstrated a significant interaction between condition (SHAM, STIM) and time (pre-tests, post-tests, post-tests +1 h, post-tests +2 h, post-tests +24 h, post-tests +48 h) factors (p < 0.001). In the STIM condition, post hoc analysis showed a significant increase in motion sickness symptoms between the tests (3.04 ± 4.49) and the pre-tests (0.57 ± 1.07), tests +1 h (0.92 ± 1.72), tests +2 h (1.21 ± 1.84), tests +24 h (0.31 ± 1.23), and post-tests +48 h (0.27 ± 1.19) (Figure 3). [Figure 3 here] 3 4 5 6 7 8 9 10 11 12 13 14 15 16 17 18 19 20 21 22 23 24 25 26 27 28 29 30 31 32 33 34 35 36 37 38 39 40 41 42 43 44 45 46 47 48 49 50 51 52 53 54 55 56 57 58 59 60
For Peer Review Only
DiscussionThe present study aimed at investigating the impact of vestibular stimulation induced by a rotatory chair on the rest/activity rhythm recorded by actigraphy. The main results demonstrated a decrease in the average activity level measured after vestibular stimulation by comparing it to the SHAM condition. In addition, it revealed a small but, nonetheless, significant 1.15 h phase advance on the second day following the vestibular stimulation session. However, the vestibular stimulation did not influence actigraphic estimates of the sleep/wake cycle. Motion sickness symptoms increased significantly after vestibular stimulation.
Our results showed a decreased activity level in the evening following the vestibular stimulation at 18:00h. This result reinforces the hypothesis of the implication of vestibular afferents on the rest/activity rhythm in humans by modulating the motor activity rhythm. It corroborates similar findings about the increase in motor activity level in patients with bilateral vestibular loss during the rest period (Martin et al. 2016). Reports in the literature have demonstrated that swinging stimulation releases anxiety and stress by decreasing heart rate, blood pressure, and cortisol level (Snyder et al. 2001; Kumar et al. 2014). We assume that the relaxing effect of vestibular stimulation could explain the decreased activity level following the stimulation. The increased symptoms of motion sickness caused by vestibular stimulation present an alternative explanation for the decrease in activity level. The participants felt nauseous and drowsy, so they naturally reduced their movements.
The current study showed that a significant phase advance of the rest/activity rhythm occurred after the late-afternoon (18:00h) vestibular stimulation. This result supports the hypothesis of the potential effect of vestibular stimulation on the circadian rhythms. To date,
3 4 5 6 7 8 9 10 11 12 13 14 15 16 17 18 19 20 21 22 23 24 25 26 27 28 29 30 31 32 33 34 35 36 37 38 39 40 41 42 43 44 45 46 47 48 49 50 51 52 53 54 55 56 57 58 59
For Peer Review Only
rhythms. Regular physical training activity in individuals working at night maintains biological rhythmicity (Mauvieux et al. 2007). Early evening aerobic exercise was found to cause a significant phase advance of melatonin secretion compared to a non-exercise group (Buxton et al. 2003). Conversely, late night exercise can cause phase delay of melatonin secretion (Barger et al. 2004). The vestibular system is thus more solicited during activity periods, and particularly during physical activity. The phase advance caused by vestibular stimulation when timed at 18:00h in the current study suggests that the effect of physical activity on circadian rhythmicity can be, at least partially, conveyed though the vestibular system. Although mechanisms are not clearly understood, macular gravity receptors seem to be involved in the regulation of biological rhythms by vestibular afferents (Fuller et al. 2002; Fuller & Fuller 2006). The phase advance effect of the rest/activity rhythm occurred two days after the stimulation session. These results were unexpected, since most previous studies that investigated the acute impact of the exercise session have mainly focused on the effect on the day following the exercise session (Buxton et al. 2003; Baehr et al. 2003). Moreover, the above-mentioned human studies mainly focused on a biological variable, such as melatonin, but a different response of the circadian timing system to a non-photic stimulus among the studied circadian rhythms is not unexpected. Indeed, Yamanaka et al. (2010) observed a different resynchronization of the sleep/wake schedule and melatonin to the same exercise stimulus. These authors hypothesized that a different type of synchronization to non-photic stimuli occurred for the sleep/wake cycle when compared to melatonin. Additionally, the vestibular stimulation induced by the rotatory chair is different from the natural stimulation experienced with usual movements. Our repetitive stimulation is unusual and certainly non-optimal, which perhaps helps explain the delayed effect.
This study would, therefore, constitute the preliminary step in the potential use of vestibular stimulation to modulate biological rhythmicity. Some methodological limits should
3 4 5 6 7 8 9 10 11 12 13 14 15 16 17 18 19 20 21 22 23 24 25 26 27 28 29 30 31 32 33 34 35 36 37 38 39 40 41 42 43 44 45 46 47 48 49 50 51 52 53 54 55 56 57 58 59 60
For Peer Review Only
be discussed. We decided to use mechanical vestibular stimulation induced by a rotatory chair. This technic naturally stimulates the vestibular system compared to the caloric vestibular stimulation or galvanic vestibular stimulation. Some studies focusing on the effects of swinging beds have used similar methods to induce canalicular and/or otolithic stimulation (Woodward et al. 1990; Bayer et al. 2011). However, this technique induces significant motion sickness symptoms, and 6 participants had to stop the experiment due to severe symptoms. The nauseogenic effect depends on each individual’s sensitivity as well as stimulation parameters, such as velocity and angle tilt (Denise et al. 1996).
In addition, behaviors can have a masking effect on the level of motor activity. Melatonin secretion and temperature need to be measured in further experimental protocol to confirm the role of vestibular afferents on the biological clock. One may suppose that vestibular stimulation would have modified light perception sensitivity. Fuller & Fuller (2006) evocated that the difference response to constant light or darkness between het and normal mice was due to abnormal light perception in het mice (Fuller & Fuller 2006). However, impact of vestibular stimulation on light perception, to the best of our knowledge, remains to be explored.
In conclusion, the present study highlights the possibility of training biological rhythms through vestibular stimulation. A decrease in activity level was observed on the evening following the rotatory chair stimulation. We also found a phase advance effect on the rest/activity rhythm two days following the 18:00h scheduled stimulation session. It is unknown if the impact of vestibular stimulation is circadian rhythm-dependent such that when scheduled at other circadian times would exert more, comparable, or less such effect. However, our current observations support findings reported in the literature regarding the potent effect of non-photic stimuli as vestibular afferents on biological rhythm
3 4 5 6 7 8 9 10 11 12 13 14 15 16 17 18 19 20 21 22 23 24 25 26 27 28 29 30 31 32 33 34 35 36 37 38 39 40 41 42 43 44 45 46 47 48 49 50 51 52 53 54 55 56 57 58 59
For Peer Review Only
vestibular system, under usual everyday life, it causes significant motion sickness symptoms. Physical activity is a natural way to induce head accelerations, and its impact on biological rhythms has already been demonstrated. Further research is necessary to test and develop the use of vestibular stimulation in patients presenting biological disorders.
3 4 5 6 7 8 9 10 11 12 13 14 15 16 17 18 19 20 21 22 23 24 25 26 27 28 29 30 31 32 33 34 35 36 37 38 39 40 41 42 43 44 45 46 47 48 49 50 51 52 53 54 55 56 57 58 59 60
For Peer Review Only
Funding detailsWhile working on her Ph.D; Florane Pasquier has been supported by the French Ministry of Higher Education and Research. This study was also supported by the U1075 Comete.
Disclosure of conflict of interest
The authors report no conflict of interest.
3 4 5 6 7 8 9 10 11 12 13 14 15 16 17 18 19 20 21 22 23 24 25 26 27 28 29 30 31 32 33 34 35 36 37 38 39 40 41 42 43 44 45 46 47 48 49 50 51 52 53 54 55 56 57 58 59
For Peer Review Only
ReferencesBaehr EK, Eastman CI, Revelle W, Olson SHL, Wolfe LF, Zee PC. 2003. Circadian phase-shifting effects of nocturnal exercise in older compared with young adults. Am J Physiol Regul Integr Comp Physiol. 284(6):R1542-1550.
Baloh RW, Honrubia V. 2011. Baloh and Honrubia’s Clinical Neurophysiology of the Vestibular System. [place unknown]: Oxford University Press.
Barger LK, Wright KP, Hughes RJ, Czeisler C. 2004. Daily exercise facilitates phase delays of circadian melatonin rhythm in very dim light. Am J Physiol Regul Integr Comp Physiol. 286(6):R1077-1084.
Bayer L, Constantinescu I, Perrig S, Vienne J, Vidal P-P, Mühlethaler M, Schwartz S. 2011. Rocking synchronizes brain waves during a short nap. Curr Biol CB. 21(12):R461-462.
Brunner E, Domhof S, Langer F. 2002. Nonparametric analysis of longitudinal data in factorial experiments. New York, NY : J. Wiley,.
Buxton OM, Lee CW, L’Hermite-Baleriaux M, Turek FW, Van Cauter E. 2003. Exercise elicits phase shifts and acute alterations of melatonin that vary with circadian phase. Am J Physiol Regul Integr Comp Physiol. 284(3):R714-724.
Cavdar S, Onat F, Aker R, Sehirli U, San T, Yananli HR. 2001. The afferent connections of the posterior hypothalamic nucleus in the rat using horseradish peroxidase. J Anat. 198(Pt 4):463–472.
Crivelli F, Omlin X, Rauter G, von Zitzewitz J, Achermann P, Riener R. 2016. Somnomat: a novel actuated bed to investigate the effect of vestibular stimulation. Med Biol Eng Comput. 54(6):877–889.
Denise P, Etard O, Zupan L, Darlot C. 1996. Motion sickness during off-vertical axis rotation: prediction by a model of sensory interactions and correlation with other forms of motion sickness. Neurosci Lett. 203(3):183–186.
Duffy JF, Wright KP. 2005. Entrainment of the human circadian system by light. J Biol Rhythms. 20(4):326–338.
Fuller CA. 1985. Influence of exposure to a prolonged hyperdynamic field on body temperature in the squirrel monkey. The Physiologist. 28(6 Suppl):S157-158.
Fuller PM, Fuller CA. 2006. Genetic evidence for a neurovestibular influence on the mammalian circadian pacemaker. J Biol Rhythms. 21(3):177–184.
Fuller PM, Jones TA, Jones SM, Fuller CA. 2002. Neurovestibular modulation of circadian and homeostatic regulation: Vestibulohypothalamic connection? Proc Natl Acad Sci U S A. 99(24):15723–15728.
Fuller PM, Jones TA, Jones SM, Fuller CA. 2004. Evidence for macular gravity receptor modulation of hypothalamic, limbic and autonomic nuclei. Neuroscience. 129(2):461–471.
3 4 5 6 7 8 9 10 11 12 13 14 15 16 17 18 19 20 21 22 23 24 25 26 27 28 29 30 31 32 33 34 35 36 37 38 39 40 41 42 43 44 45 46 47 48 49 50 51 52 53 54 55 56 57 58 59 60
For Peer Review Only
Graybiel A, Wood CD, Miller EF, Cramer DB. 1968. Diagnostic criteria for grading the severity of acute motion sickness. Aerosp Med. 39(5):453–455.
Grossman GE, Leigh RJ, Bruce EN, Huebner WP, Lanska DJ. 1989. Performance of the human vestibuloocular reflex during locomotion. J Neurophysiol. 62(1):264–272.
Haffen E. 2009. [Measuring circadian rhythm]. L’Encephale. 35 Suppl 2:S63-67.
Holley DC, DeRoshia CW, Moran MM, Wade CE. 2003. Chronic centrifugation (hypergravity) disrupts the circadian system of the rat. J Appl Physiol. 95(3):1266–1278. Horne JA, Ostberg O. 1976. A self-assessment questionnaire to determine morningness-eveningness in human circadian rhythms. Int J Chronobiol. 4(2):97–110.
Horowitz SS, Blanchard J, Morin LP. 2005. Medial vestibular connections with the hypocretin (orexin) system. J Comp Neurol. 487(2):127–146.
Inouye ST, Kawamura H. 1979. Persistence of circadian rhythmicity in a mammalian hypothalamic “island” containing the suprachiasmatic nucleus. Proc Natl Acad Sci U S A. 76(11):5962–5966.
Kompotis K, Hubbard J, Emmenegger Y, Perrault A, Mühlethaler M, Schwartz S, Bayer L, Franken P. 2019. Rocking Promotes Sleep in Mice through Rhythmic Stimulation of the Vestibular System. Curr Biol. 29(3):392-401.e4.
Kumar S, Archana R, Mukkadan JK. 2014. Controlled Vestibular Stimulation: A Physiological Method of Stress Relief. J Clin Diagn Res JCDR. 8(12):BM01–BM02.
Martin T, Mauvieux B, Bulla J, Quarck G, Davenne D, Denise P, Philoxène B, Besnard S. 2014. Vestibular loss disrupts daily rhythm in rats. J Appl Physiol Bethesda Md 1985. 118(3):310–318.
Martin T, Moussay S, Bulla I, Bulla J, Toupet M, Etard O, Denise P, Davenne D, Coquerel A, Quarck G. 2016. Exploration of Circadian Rhythms in Patients with Bilateral Vestibular Loss. PLOS ONE. 11(6):e0155067.
Mauvieux B, Gouthière L, Sesboüé B, Denise P, Davenne D. 2007. Effets de l’entraînement physique et sportif sur le rythme circadien de la température et le rythme veille–sommeil chez la personne vieillissante. Exemples chez des retraités et des travailleurs de nuit. ResearchGate. 55(3):205–207.
Mistlberger RE, Skene DJ. 2004. Social influences on mammalian circadian rhythms: animal and human studies. Biol Rev Camb Philos Soc. 79(3):533–556.
Moore RY, Silver R. 1998. Suprachiasmatic nucleus organization. Chronobiol Int. 15(5):475– 487.
Murakami DM, Erkman L, Hermanson O, Rosenfeld MG, Fuller CA. 2002. Evidence for vestibular regulation of autonomic functions in a mouse genetic model. Proc Natl Acad Sci U S A. 99(26):17078–17082. 3 4 5 6 7 8 9 10 11 12 13 14 15 16 17 18 19 20 21 22 23 24 25 26 27 28 29 30 31 32 33 34 35 36 37 38 39 40 41 42 43 44 45 46 47 48 49 50 51 52 53 54 55 56 57 58 59
For Peer Review Only
Noguchi K, Gel YR, Brunner E, Konietschke F. 2012. nparLD: An R Software Package for the Nonparametric Analysis of Longitudinal Data in Factorial Experiments. J Stat Softw. 50(1):1–23.
Oyama J. 1975. Response and adaptation of beagle dogs to hypergravity. Life Sci Space Res. 13:11–17.
Oyama J, Platt WT, Holland VB. 1971. Deep-body temperature changes in rats exposed to chronic centrifugation. Am J Physiol. 221(5):1271–1277.
Peterson BW, Richmond FJ. 1988. Control of Head Movement. [place unknown]: Oxford University Press.
Pinheiro J, Bates D. 2006. Mixed-Effects Models in S and S-PLUS. [place unknown]: Springer Science & Business Media.
Portaluppi F, Smolensky MH, Touitou Y. 2010. Ethics and methods for biological rhythm research on animals and human beings. Chronobiol Int. 27(9–10):1911–1929.
Snyder M, Tseng Y, Brandt C, Croghan C, Hanson S, Constantine R, Kirby L. 2001. A glider swing intervention for people with dementia. Geriatr Nurs N Y N. 22(2):86–90.
Stephan FK, Zucker I. 1972. Circadian rhythms in drinking behavior and locomotor activity of rats are eliminated by hypothalamic lesions. Proc Natl Acad Sci U S A. 69(6):1583–1586. Van Someren EJ, Swaab DF, Colenda CC, Cohen W, McCall WV, Rosenquist PB. 1999. Bright light therapy: improved sensitivity to its effects on rest-activity rhythms in Alzheimer patients by application of nonparametric methods. Chronobiol Int. 16(4):505–518.
Woodward S, Tauber ES, Spielmann AJ, Thorpy MJ. 1990. Effects of otolithic vestibular stimulation on sleep. Sleep. 13(6):533–537.
Yamanaka Y, Hashimoto S, Tanahashi Y, Nishide S-Y, Honma S, Honma K-I. 2010. Physical exercise accelerates reentrainment of human sleep-wake cycle but not of plasma melatonin rhythm to 8-h phase-advanced sleep schedule. Am J Physiol Regul Integr Comp Physiol. 298(3):R681-691.
Zordan MA, Rosato E, Piccin A, Foster R. 2001. Photic entrainment of the circadian clock: from Drosophila to mammals. Semin Cell Dev Biol. 12(4):317–328.
Zouabi A, Quarck G, Martin T, Grespinet M, Gauthier A. 2016. Is there a circadian rhythm of postural control and perception of the vertical? Chronobiol Int. 33(10):1320–1330.
3 4 5 6 7 8 9 10 11 12 13 14 15 16 17 18 19 20 21 22 23 24 25 26 27 28 29 30 31 32 33 34 35 36 37 38 39 40 41 42 43 44 45 46 47 48 49 50 51 52 53 54 55 56 57 58 59 60
For Peer Review Only
Table 1. Parameters of the circadian rhythm of rest/activity two days after the BASELINE, SHAM, and STIM conditions
df AIC BIC loglik LRT p-value Null model (constant)
Session effect: none 3 137915,9 137937,8 -68954,95 Cosinor model
Session effect: none 5 137511,0 137547,5 -68750,53 408,8525 < 0,001
Cosinor model
STIM session effect: phase 6 137500,8 137544,5 -68744,40 12,2533 < 0,001
Cosinor model STIM session effect: phase
SHAM session effect: phase 7 137499,4 137550,4 -68742,68 3,4464 0,0634 3 4 5 6 7 8 9 10 11 12 13 14 15 16 17 18 19 20 21 22 23 24 25 26 27 28 29 30 31 32 33 34 35 36 37 38 39 40 41 42 43 44 45 46 47 48 49 50 51 52 53 54 55 56 57 58 59
For Peer Review Only
Figure 1:BASELINE SHAM STIM
0 50 100 150 200 250 300 350 Activit y level (count /min) ** 3 4 5 6 7 8 9 10 11 12 13 14 15 16 17 18 19 20 21 22 23 24 25 26 27 28 29 30 31 32 33 34 35 36 37 38 39 40 41 42 43 44 45 46 47 48 49 50 51 52 53 54 55 56 57 58 59 60
For Peer Review Only
Figure 2: 3 4 5 6 7 8 9 10 11 12 13 14 15 16 17 18 19 20 21 22 23 24 25 26 27 28 29 30 31 32 33 34 35 36 37 38 39 40 41 42 43 44 45 46 47 48 49 50 51 52 53 54 55 56 57 58 59For Peer Review Only
Figure 3:Pre-tests SHAM Post-tests
Post-tests +1h Post-tests +2h post-tests +24h Post-tests +48h
Pre-tests STIM Post-tests
Post-tests +1h Post-tests +2h post-tests +24h Post-tests +48h
0 1 2 3 4 5 6 7 8 Motion sickne ss symptom s *** *** 3 4 5 6 7 8 9 10 11 12 13 14 15 16 17 18 19 20 21 22 23 24 25 26 27 28 29 30 31 32 33 34 35 36 37 38 39 40 41 42 43 44 45 46 47 48 49 50 51 52 53 54 55 56 57 58 59 60
For Peer Review Only
Figure 1: Average activity level (score ± SD) for the three conditions (BASELINE, SHAM, STIM). ** p < 0.01.
Figure 2: Rest/activity cosinor curves for STIM (black) and (BASELINE + SHAM) (grey) conditions. A significant phase advance (1.15 h) is observed in the STIM condition (3:22 p.m), compared to BASELINE + SHAM (4:37 p.m.). Mesor (146.59 ± 3.89) and amplitude (123.31 ± 5.48) did not differ in the three conditions.
Figure 3: Mean motion sickness level (score ± SD) for SHAM and STIM sessions for pre-tests, and post-tests (+1h, +2h, +24h, +48h) measures. *** p < 0.001
3 4 5 6 7 8 9 10 11 12 13 14 15 16 17 18 19 20 21 22 23 24 25 26 27 28 29 30 31 32 33 34 35 36 37 38 39 40 41 42 43 44 45 46 47 48 49 50 51 52 53 54 55 56 57 58 59
For Peer Review Only
Figure 1:BASELINE SHAM STIM
0 50 100 150 200 250 300 350 Activit y level (count /min) ** 3 4 5 6 7 8 9 10 11 12 13 14 15 16 17 18 19 20 21 22 23 24 25 26 27 28 29 30 31 32 33 34 35 36 37 38 39 40 41 42 43 44 45 46 47 48 49 50 51 52 53 54 55 56 57 58 59 60
For Peer Review Only
Figure 2: 3 4 5 6 7 8 9 10 11 12 13 14 15 16 17 18 19 20 21 22 23 24 25 26 27 28 29 30 31 32 33 34 35 36 37 38 39 40 41 42 43 44 45 46 47 48 49 50 51 52 53 54 55 56 57 58 59For Peer Review Only
Pre-tests SHAM Post-tests
Post-tests +1h Post-tests +2h post-tests +24h Post-tests +48h
Pre-tests STIM Post-tests
Post-tests +1h Post-tests +2h post-tests +24h Post-tests +48h
0 1 2 3 4 5 6 7 8 Motion sickne ss symptom s
Figure 1: Average activity level (score ± SD) for the three conditions (BASELINE, SHAM, STIM). ** p < 0.01. *** *** 3 4 5 6 7 8 9 10 11 12 13 14 15 16 17 18 19 20 21 22 23 24 25 26 27 28 29 30 31 32 33 34 35 36 37 38 39 40 41 42 43 44 45 46 47 48 49 50 51 52 53 54 55 56 57 58 59 60
For Peer Review Only
Figure 2: Rest/activity cosinor curves for STIM (black) and (BASELINE + SHAM) (grey) conditions. A significant phase advance (1.15 h) is observed in the STIM condition (3:22 p.m), compared to BASELINE + SHAM (4:37 p.m.). Mesor (146.59 ± 3.89) and amplitude (123.31 ± 5.48) did not differ in the three conditions.
Figure 3: Mean motion sickness level (score ± SD) for SHAM and STIM sessions for pre-tests, and post-tests (+1h, +2h, +24h, +48h) measures. *** p < 0.001
3 4 5 6 7 8 9 10 11 12 13 14 15 16 17 18 19 20 21 22 23 24 25 26 27 28 29 30 31 32 33 34 35 36 37 38 39 40 41 42 43 44 45 46 47 48 49 50 51 52 53 54 55 56 57 58 59