HAL Id: hal-01590823
https://hal-pjse.archives-ouvertes.fr/hal-01590823
Submitted on 20 Sep 2017HAL is a multi-disciplinary open access archive for the deposit and dissemination of sci-entific research documents, whether they are pub-lished or not. The documents may come from teaching and research institutions in France or abroad, or from public or private research centers.
L’archive ouverte pluridisciplinaire HAL, est destinée au dépôt et à la diffusion de documents scientifiques de niveau recherche, publiés ou non, émanant des établissements d’enseignement et de recherche français ou étrangers, des laboratoires publics ou privés.
Women’s Political Reservation, Early Childhood
Development, and Learning in India
Yuvraj Pathak, Karen Macours
To cite this version:
Yuvraj Pathak, Karen Macours. Women’s Political Reservation, Early Childhood Development, and Learning in India. Economic Development and Cultural Change, University of Chicago Press, 2017, 65 (4), pp.741-766. �10.1086/692114�. �hal-01590823�
Women’s Political Reservation, Early Childhood Development and Learning in India1
Yuvraj Pathak (University of Chicago) and
Karen Macours (Paris School of Economics and INRA)
April 2016 Abstract
This paper analyzes the long-term impacts of reservation of local political seats for women on children’s learning and nutritional outcomes in rural Andhra Pradesh. Using the random rotation of seats reserved for women over different election cycles, and three rounds of a panel dataset, we analyze the impact of exposure to political reservation during critical periods in early childhood. The paper shows that the reservation policy for female leaders had the largest impact on learning outcomes in primary school when children were exposed to reservation in utero and very early in life.
1 Acknowledgements: The data used in this publication come from Young Lives, a 15-year study of the changing nature of childhood poverty in Ethiopia, India, Peru and Vietnam (www.younglives.org.uk). Young Lives is core-funded by UK aid from the Department for International Development (DFID) and co-funded from 2010 to 2014 by the Netherlands Ministry of Foreign Affairs. The views expressed here are those of the author(s). They are not necessarily those of Young Lives, the University of Oxford, DFID or other funders. We are grateful to the Young Lives team for assistance with the data and to the associate editor, two anonymous referees, Marc Gurgand and participants at the 2013 Young Lives conference for helpful comments on an earlier version of this paper. All remaining errors are ours.
1. INTRODUCTION
Early childhood experiences are often thought to be crucial determinants of children’s cognitive and non-cognitive development (Heckman, 2008). Many children in the developing world are exposed to a multitude of risk factors, hampering their cognitive development from very early on (Grantham-McGregor et al. 2007). This is thought to lead to subsequent lack of human capital accumulation, resulting in poverty and continued inequality. Increasingly, policies therefore focus on improving health, nutrition and educational outcomes during early childhood. And as there typically is a strong relationship between mother’s characteristics and children’s cognitive and educational outcomes, policies addressing constraints on the mothers of these children are often believed to be particularly promising (World Bank, 2011). This is even more so if women have stronger preferences for human capital investments (as hypothesized, for instance, by Thomas 1990, 1993), and policies that increase women’s decision-making power could potentially have large implications for the human capital of the next generation. Yet very little is known about the longer-term impact of such policies on children’s human capital outcomes.
This paper contributes by analyzing the impact of women’s representation in elected bodies on children’s learning and nutritional status more than 10 years later and tests whether political reservation for women resulted in improvements in children’s longer-term learning and nutritional outcomes. Understanding the impact of female reservation policy on children’s human capital accumulation is of high interest given existing evidence on children’s delays in physical growth, cognition and learning outcomes in India. Stunting rates, for instance, have remained extremely high in India despite economic growth (Deaton and Dreze, 2009; Jayachandran and Pande, 2015) and lack of learning in school has been highlighted as a particular challenge (Beatty and Pritchet, 2013; Muralidharan, 2013).
The 73rd Amendment of the Constitution of India of 1992 prescribes that one third of the seats in all local councils, as well as one third of the leadership positions, must be reserved for women.2 These local councils
can affect children’s outcomes through their responsibilities for public good provision in the Gram Panchayat (GP, the lowest administrative level). They also decide the allocation of private benefits, such as housing or toilet construction, public employment or food subsidies for the poor. Exploiting the random allocation of the seats reserved for women in local elections, several studies have shown that reservations had important impacts on policy choices in the short-term. Chattopadhayay and Duflo (2004) show that female reservation increased investment in infrastructure related to the expressed development priorities of women in West Bengal and Rajasthan. Duflo and Topalova (2004) further show for a sample covering 24
2 Seats in councils and leadership positions were also reserved for the two disadvantaged minorities in India, Scheduled Castes and Scheduled Tribes, in the form of mandated representation proportional to each minority's population share in each district.
states that GPs reserved for women invest more in public goods, and that the measured quality of these goods is at least as high as in non-reserved GPs. This is particularly the case for drinking water infrastructure. Bhalotra and Clots-Figueras (2011) find that female leaders are more likely to invest in rural health infrastructure than men. And Beaman et al. (2009) show that reservation for women has not only led to a decrease in bias amongst voters against women candidates, but has also resulted in a subsequent increase in the percentage of female local leaders. More broadly, political reservation for the Scheduled caste, Scheduled Tribe and women has been linked to more policy influence for these groups (Pande, 2003). Pande and Ford (2011) further show the effectiveness of quotas in changing attitudes towards women leaders and giving them more policy influence. And exposure to female leaders can raises parents’ aspirations for their girls (Beaman et al., 2012) and increase women’s participation in political processes (Beaman et al, 2010). Reservation can also otherwise affect women’s outcomes, with evidence by Jha et al (2011), for instance, documenting how improvements in water availability lead to higher participation of women in the labor market and more productive work. Ghani, Kerr and O’Connell (2013) find a positive impact on female entrepreneurship.
Focusing more specifically on child-related indicators, the available evidence suggests short-term positive impacts, but also substantial heterogeneity of such impacts. Clots-Figueras (2012) shows that female leaders have a positive effect on primary education attainment of children in urban India, though not in rural areas. Beaman et al (2012) suggests education investments might be particularly important for girls, as having a GP reserved for a female leader reduces the gender gap in school attendance. And Kumar and Prakash (2012) similarly find positive impacts of women leaders on child mortality in Bihar, but the impacts are only found for the wealthier quintiles of the population. Less is known about impacts on children’s health and nutrition status during early childhood.
More generally, not all the available evidence points to positive impacts. Ban and Rao (2008) show that women’s reservation in four Southern States, including Andhra Pradesh, does not lead to more investments congruent with women’s preferences. Bardhan, Mookherjee and Para Torrado (2010) further show that female reservation can lead to worse targeting of private benefits within villages, and as such potentially limit the impact of the public good investments. Yet Besley, Pande and Rao (2005) find no such impact on targeting. Sathe et al. (2013) find better service delivery in villages with female leaders who have been in power for 3.5 years, but worse in those where female leaders only recently came to power. And related, Afridi, Iversen and Sharan (2013) find more leakage in NREGA programs with female leadership, but improvement in governance as female leaders gain more experience. Deininger et al. (2015) also found that quality of service provision might be worse on the short run, but better on the long run. Finally, Iyer et al
(2012) show how female reservation increased reporting of crime against women, which they interpret as a positive development.
Taken together the literature hence suggests a relatively wide variety of mechanisms through which the reservation policy could affect children’s human capital. If female leaders indeed favor policies beneficial to human capital, they could increase investments in education and health care infrastructure or vaccination programs. They may also affect children’s food intake, for instance by increasing the number of households benefitting from public food distribution system. Increased bargaining power resulting from higher earning potential can enhance some of these effects. But giving women political power does not necessarily lead to better human capital investments, as it is not automatically true that women would favor such investments (Duflo, 2012). Indeed, both Chattopadhayay and Duflo (2004) and Ban and Rao (2008) show that female and male preferences can be quite heterogeneous between GPs, so that one would not necessarily expect reservation to lead to similar investments in all GPs. And if reservation has positive impacts on women’s labor market outcomes, this may come at the cost of time spend for childcare. That said, even if women focus more directly on their own needs, such as their access to food and preventive health care, this could result in indirect benefits for children, in particular through better protection during the critical in utero period. Any longer term impacts may well depend then on the ages at which children were exposed to potential benefits from having a female elected leader.
This paper builds on the existing literature and contributes by showing long-term impacts of reservation of seats for women in the Gram Panchayat elections on children’s learning and nutritional outcomes in rural Andhra Pradesh. We do not aim to attribute these results to specific policy choices by female leaders, but instead analyze potential critical periods during early childhood in which such policies can be particularly effective. Specifically, we analyze children’s test scores at age 8 comparing children exposed to reservation in utero and very early in life, with children exposed after age 5. Using the 3 waves of the Young Lives panel dataset that follows children from 2002 to 2009, we show that women’s political reservation improved nutritional and health outcomes very early in the children’s life, and measure the longer-term impacts on children’s test scores capturing both math and language achievement, and on their nutritional status. We are able to attribute causality to the reservation policy in the Panchayat as the seats to be reserved were randomly allocated through a rotating mechanism. Specifically, we focus on a cohort of children (12 to 17 months in 2002) who were exposed to reservation in utero if their GP was randomly selected to receive reservation between 1995 and 2001, while they only benefited from reservation after the age of five if their GP was randomly selected for reservation between 2006 and 2011. We then compare the outcomes for this cohort when they are 8 years old between GPs reserved in 1995 versus 2006. This allows drawing lessons regarding the relative impact of being exposed to reservation in utero and very early in life.
The results show that children in GPs that were randomly reserved for women prior to the child’s birth have significantly better outcomes on test scores in 2009 when compared to GPs that were reserved after the child turned 5. As such, this paper also contributes to the literature on the long-term impacts of early life interventions (Barnett, 1995; Garces, Thomas and Currie, 2002; Walker et al., 2005; Maluccio et al., 2009; Barham, 2012) and the critical periods for such interventions (Barker 1992; Adair 1999, Doyle et al. 2009; Almond and Currie, 2010; Barham, Macours and Maluccio, 2013).
The paper is structured as follows: the next section discusses the data sources, provides details about the reservation policy, the random rotation of reserved seats, and the balance for the cohort of interest. It further discusses identification and the empirical specification. Section 3 then shows the long-term impact of having a women legislator on child learning and nutritional outcomes, comparing exposure in utero and very in life with exposure after age five. Section 4 provides further evidence for other cohorts and section 5 concludes.
2. DATA, IDENTIFICATION AND EMPIRICAL STRATEGY 2.1. The reservation policy and the cohort of interest
We use the Young Lives Survey (YLS) dataset for Andhra Pradesh, a 3-wave panel dataset (2002, 2007 and 2009) focused on childhood poverty covering 20 mandals in 6 rural districts.3 The YLS survey instrument consists of a child questionnaire, a household questionnaire, and a community questionnaire. YLS follows 2011 children that were between 6 and 17 months of age in 2002.4 For the initial sampling, each mandal was divided in 4 geographical areas, and one village was randomly selected in each area. YLS then randomly sampled 100 households with a one-year old child in each mandal. Our overall target sample in particular consists of 1547 children, as we exclude 464 children from urban areas, where the GP reservation is irrelevant (the local election system being different for urban areas).
The Panchayat is a system of village-level (Gram Panchayat), mandal-level (Panchayat Samiti), and district-level (Zilla Parishad) councils, with membership determined through local elections. Their main
3 YLS sampled 6 rural districts, two districts in each of three agro-climatic regions and selecting one poor and one non-poor district in each region: Srikakulam and West Godavari in the Coastal region; Anantapur and Cuddapah in Rayalaseema; and Mahboobnager and Karimnaga in Telangana. The mandal or block is the administrative unit just below the district. After ranking all the mandals sites in these districts on the basis of a selected set of indicators of economic, human development and infrastructure, 20 mandals were sampled from these districts.
4 In parallel, YLS also sampled a second group of 1000 children that were on average 8 years old in 2002. We do not use this second sample given the focus on early childhood. More generally, the YLS initiative collected data on 12,000 children in 4 countries over 15 years. It is led by a team in the Department of International Development at the University of Oxford in association with research and policy partners.
responsibility is the administration of local public goods. Each mandal consist of various GPs and each GP encompasses between 1,000 and 10,000 individuals in a group of villages (between 1 and 15). In 1992, the 73rd Amendment of the Constitution of India gave new powers to the Panchayats and provided that one third of the seats in all Panchayat councils, as well as one third of the leadership positions, must be reserved for women. Seats and leadership positions were also reserved for the two disadvantaged minorities in India, Scheduled Castes and Scheduled Tribes, in the form of mandated representation proportional to each minority's population share in each district.5
In Andhra Pradesh, for all practical purposes, this act came into effect with the Andhra Pradesh Panchayat Raj act of 1994, which mandates the elections for the seat of the ‘sarpanch’ or the head of the Gram Panchayat. For each subsequent election, one third of the total seats were reserved for women and this was to be done by rotation.6 Only women candidates could contest the election for these seats, thereby ensuring
a woman sarpanch in the reserved GPs, without any exception. The first panchayat or GP elections after the Andhra Pradesh Panchayati Raj Act were held in the March 1995. The next elections took place in July-August of 2001 and 2006. Given the rotation rule, a GP reserved in 1995, could not be reserved in 2001 or 2006, and by 2006 every GP had been reserved once. There are hence 3 treatment episodes relevant for this paper: 1995 to 2001, 2001 to 2006, and 2006 to 2011. The state election commission typically announced the dates for the elections 1-2 months in advance and the term of the newly elected sarpanch started immediately after each election.
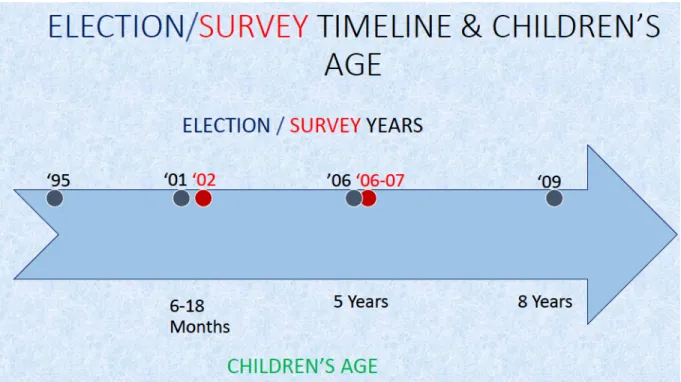
The first round of YLS was conducted from September to December 2002, approximately one year after the sarpanch elected in 2001 came into power, and 7 years after the first election with reservation. See figure 1 for a timeline of elections and data collection. At that point the children in the sample were 6 to 17 months old. The second round of data was collected from January to July 2007, i.e. 6-12 months after the 2006 election. The third round of YLS was mostly conducted in the second half of 2009, i.e. more than 3 years after the 2006 election. The YLS hence does not allow characterizing the situation prior to the start of the reservation policy. Given the randomized rotation of the reservation we do not need such baseline information for identification. The lack of baseline does imply that only the characteristics unlikely to have
5 In this paper, we use the term reservation specifically for the reservation of the sarpanch position for women. We do not consider the reservation for minorities, for lack of exogenous variation in the later.
6The Andhra Pradesh Panchayat Raj act of 1994 mandates that the office of sarpanch of the GPs in the state be reserved in the following manner: a) Of the total number of GPs in the state, the State election commissioner shall reserve number of GPs for Scheduled caste and Scheduled tribe, such that the proportion of reserved GPs to total GPs reflect the ratio of SC/ST population to the total population. b) This reservation of seats for SC/ST has to be done by rotation, which implies that a GP reserved for SC/ST in the first election year is not to be reserved for SC/St in the next election year. An exception to this case though is possible in theory subject to the constraint that the total number of seats reserved must reflect the proportion of population of SC/ST in the state. c) A minimum of one third of the GPs reserved for SC/ST must be reserved for women. This is also to be done by rotation; and d) A minimum of one third of the GPs, including the ones reserved for SC/ST are to be reserved for women. This is also to be done by rotation. (http://www.apsec.gov.in/HANDBOOK/Election%20Law%20of%20PR%20Act%20-2006.pdf)
been affected by the reservation can be used as control variables. The major advantage of the YLS data is that it allows to track the medium to longer-term impacts of the reservation policy at the child-level, and notably to investigate to what extent impacts on health and nutritional gains, very early in life, are reflected in longer term impacts on learning and nutritional status.
For identification purposes the key feature of the reservation policy is that the reserved seats were randomly allocated. It is this random allocation that most other papers on women’s reservation in India – as reviewed above – have also relied on for identifying the causal impact of the reservation. Ban and Rao (2006) describe the process of assignment of women reservation to GPs in some states of South India, including Andhra Pradesh as follows: GPs to be reserved for SC/ST in the first step, and GPs to be reserved for women in the next step are drawn by arranging the GPs in descending order of ratio of population of respective category for which it is to be reserved. Then the first, fourth, seventh and so on numbered GPs on the list were assigned reservation for the 1995 election. The second, fifth, eighth and so on GPs are assigned reservation for the 2001 election. And the third, sixth, ninth and so on GPs are assigned reservation in the 2006 election. Note that this rule implies that GPs reserved in 1995, on average, should have slightly higher female population ratios, but that conditional on these slight differences assignment is random. This may nevertheless be a potential concern for identification if higher female population ratios are also related through other mechanisms to children’s longer-term outcomes. We return to this point below.
Given that the YLS data sampled children age 6 to 17 months in the fall of 2002, reservation had been in place approximately 6 years prior to their birth in the GPs reserved from 1995 to 2001. While they had limited direct exposure to reservation after birth, they may have continued to benefit from policies implemented during reservations. In addition, for the 12 to 17 months old, reservation was still in place when they were in utero. Children that were between 6 and 11 months old in the fall of 2002, on the other hand, had limited in utero exposure. In contrast, in the GPs reserved from 2001 to 2006, reservation starts almost at the same time or just before the children in the sample are born, and reservation was in place until they were about 5 years old. As it is likely that results of reservation on policy implementation was not immediate, they may not have benefited much in utero or very early in life. Finally, in the GPs reserved from 2006 to 2011, reservation took place when children were older than 5, i.e. at the moment they were entering primary school age.
Hence there are potentially important differences between cohorts as well as and between GPs in terms of being affected by reservation. In particular, we focus on children aged 12 to 17 months in the first round of the YLS survey: they were exposed to reservation in utero if their GP was randomly selected to receive
reservation in the 1995 election, while they only benefited from reservation after the age of five if their GP was randomly selected for the 2006 reservation. By comparing the outcomes of this cohort between 1995 and 2006 reservation GPs in 2009, we can hence draw lessons regarding the relative impact of being exposed to reservation in utero and very early in life. By the time the third round of the survey is conducted in 2009, the children in the sample are about 8 years old. This allows evaluating the longer-term impacts of the reservation policy, and in particular to analyze whether the differential timing of exposure leads to longer-term differences in learning and nutritional outcomes.
2.2. Random rotation of reservation and balance
We first use data from the 1991 census to verify that villages in GPs reserved in 1995, 2001 and 2006 were indeed similar prior to reservation. To do so, we merge the 1991 census data with the GP election reservation data for Andhra Pradesh, for the 660 villages in mandals included in the rural YLS sample. The election data is freely available and comes from the Andhra Pradesh State election commission. We were able to obtain election data for the years 2001 and 2006. As expected there are no GPs that were reserved for a female sarpanch in both years. Indeed, since the election reservation is done on a rotation basis, and each election had female reservation for 1/3 of the GPs, this data also implicitly contains the election reservation data for the 1995 election (the GPs which did not receive reservation in 2001 and 2006, must have received reservation in 1995). Due to differences in village names between the election and the census data, the merge between the two data sources is imperfect but we manage to merge 289 out of 660. For those that can be merged, we find very few differences between villages reserved in 1995 and 2006, and notably no clear differences in health, water or education infrastructure.7 As expected, the female
population ratio in the GPs reserved in 1995 is slightly larger than in the GPs reserved in 2006. The difference is small (.501 compared to .493) though significant at the 1%. Overall, these results confirm previous findings in the literature regarding the random rotation of female reservation.
The YLS cannot be merged with the census data for confidentiality reasons. 8 We hence cannot repeat this
exercise for the specific villages in the YLS sample. But given the random selection of villages into the YLS sample, there is no a priori reason to believe these results would be different. That said, as was the case for the census data, not all the YLS villages could be merged to the election reservation data (election data was merged for 59 out of 82 villages), and this imperfect match could create imbalances. To verify this, we use both the YLS village and household surveys of 2002, and focus on characteristics unlikely to
7 We compared the 1995 reservation villages with the 2006 reservation villages yields for 84 characteristics covering demographics (including female literacy and labor force participation), education, health, and water infrastructure, power, and other services. Three variables are significant at the 5%, and 1 variables at 10%. Similar results are obtained for the 2001-2006 comparison, or when using villages of all mandals in AP. Detailed results available from the authors.
8 The election reservation data was merged to the YLS dataset by the YLS team, and the names of the GPs were removed to guarantee confidentiality and assure anonymity.
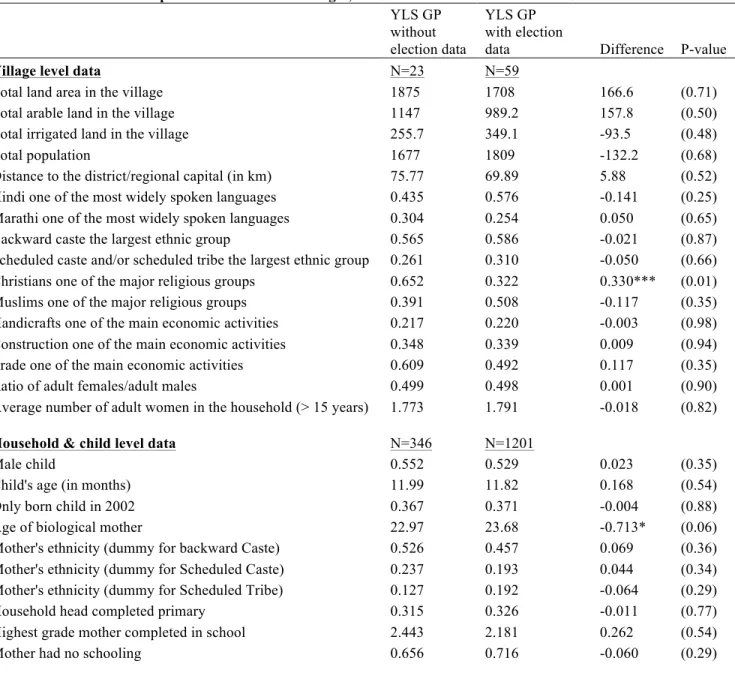
have changed because of reservation policies.9 Table 1 first analyzes whether villages that could not be
merged to the election data differ from those for whom the reservation status is known. Overall there are few significant differences, with only one of the 16 village-level variables, as well as one out of 10 from the household survey being significantly different. Overall these results suggest no large selection bias into the sample.
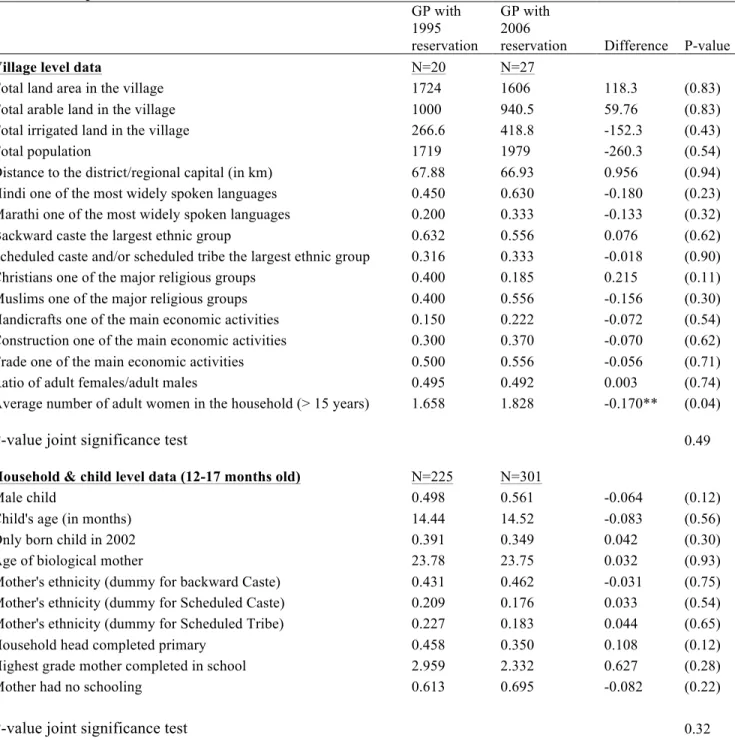
Table 2 then shows the same characteristics by the reservation status of the GP to which the village belongs.10 It shows in particular that the villages that were reserved in 1995 and 2006 are very similar in
observed characteristics, with the exception of the average number of female adults per household in the village.11 Also at the household and child level, variables unlikely to be affected by the reservation policies
such as mother’s age and ethnicity, child’s gender and birth order seem to be well balanced, suggesting there was no selective selection between the 1995 and 2006 reservation villages.12 Broadly similar results
are obtained when focusing on children 6-11 months though for this age group there is an imbalance on children’s age. We will therefore control for monthly age fixed effects in all estimations. Note also that while infant mortality is not negligible for the population of interest, there are no significant differences between the 1995 and 2006 reservation villages in the likelihood that the mother has lost a previous child.13
Hence mortality selection does not seem to be a major concern. Finally, attrition rates within the YLS matched sample of the 1995 and 2006 reservation villages is very low, with only 4% of children originally sampled in 2002 missing test scores or height-for-age z-scores in 2009, and this attrition is uncorrelated to reservation year (P-values 0.43).
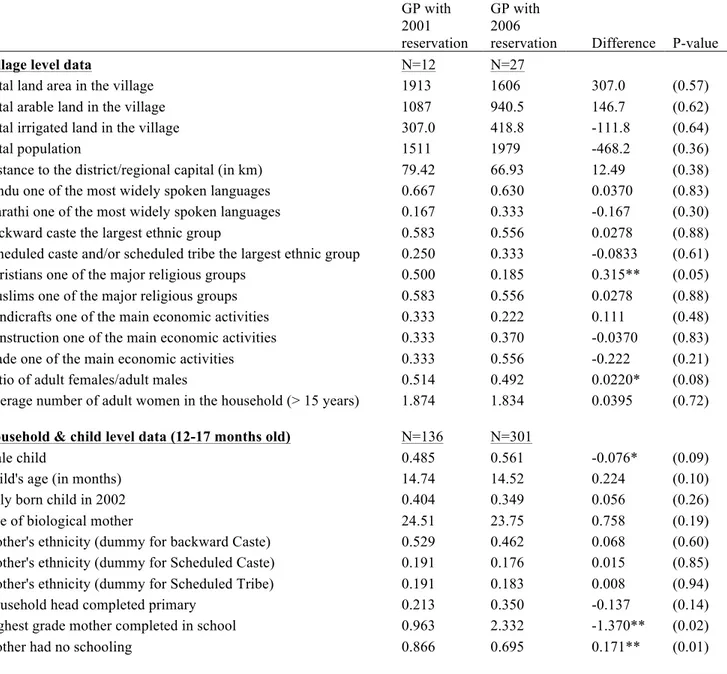
However, more imbalances are observed when comparing the 2001 and 2006 reservation villages, with notably relatively large differences in the level of education of the mothers (see Table 3). The differences are negative so unlikely to be a result of reservation policies. Given the importance of parental education for children’s human capital (Behrman and Rosenzweig, 2005; Carneiro, Meghir and Parey, 2011), this imbalance is a potential concern. It probably results from the relatively small sample of villages with 2001 reservation. In the sample of 59, 20 were reserved in 1995, only 12 in 2001 and 27 in 2006. The low
9 We exclude variables with very little variation in the data. For instance, we do not report whether agriculture is reported as one of the main income sources because this is the case in all villages.
10 Due to the YLS sampling design every village in the sample corresponds to a different GP. We hence use village and GP interchangeable when discussing the results.
11 In contrast to the census data, the sample shows balance on the estimated female population ratio. This could be just because of the small number of villages, or because the female population ratio in the YLS is a noisy estimate for the true female population ratio, as it is based on only the households in the sample.
12 Given the wide scope of potential impacts of reservation documented in the literature, the set of variables unlikely to have been affected is limited to demographic and village population characteristics. Note that even if reservation may well affect female education, we include parental education in these balance checks both because of its importance for children’s human capital, and because average ages of mothers and the extremely low level of education (with 70% of mothers having no education at all) suggest that their education levels observed in 2001 likely reflect 1995 education levels.
number in 2001 suggests that there is a proportional large share of the 2001 reservation villages among the 23 that could not be matched (as in expectation 1/3 of all villages should be reserved in each of the years). Given these results, the comparison of the 2001 reservation villages with the 2006 villages should be interpreted with more caution. The main focus of the paper will hence be on the comparison between the 1995 and 2006 reservation villages. 14
Finally, we note that while the implementation of many policies affecting child outcomes happens at the GP level, budgets for such policies are determined at the mandal level, and separate reservation rules were used for the mandal authorities. We will therefore include mandal fixed effects in all estimations. GPs with 1995 and 2006 reservation status cover 16 mandals, and on an average there are 4.3 GPs per mandal. The number of GPs reserved per mandal on average was 1.5 in 1995.
2.3. Empirical specification
We estimate simple intent-to-treat regressions, comparing outcomes of children born in GPs with reserved seats for women between 1995 and 2001 with children born in GPs with seats reserved from 2006 to 2011. Specifically we estimate:
𝑌!"# = 𝛽!+ 𝛽! 𝑇95!"+ 𝑋!"#𝛾 + Σ𝛿𝜂!+ 𝜀!"#,
where 𝑌!"# is the outcome of interest for child i in GP g and mandal m. Given the randomized rotation of the reservation, the estimates of 𝛽! measure the differential impacts of having been exposed to the 1995
reservation, as compared to the 2006 reservation. As such they capture the impact of exposure in utero and very early in the child’s life, as compared to after the age of 5. We will refer to this as “early” versus “late” exposure to reservation. The vector of child-level controls X includes child’s gender and age (using monthly age dummies).15 Given the lack of baseline, we only add controls that likely reflect baseline information: mother’s age, ethnicity (dummy variables for scheduled tribe, scheduled caste and other backward caste) and education (highest grade level achievement and a dummy for no education). As Table 2 showed imbalance in the average number of adult females per household, we also control for this
14 Of the total of 1547 children 6 to 17 months old in the dataset, 1201 are in mandals with reservation data. Among them, 384 are in GPs reserved in 1995, 240 in GPs reserved in 2001 and 577 in GPs reserved in 2006. For children 12 to 17 months old (the main group of interest) there are 225 are in GPs reserved in 1995, 159 in GPs reserved in 2001 and 301 in GPs reserved in 2006.
15 There are a few children in the dataset younger than 6 months or older than 17 months, despite the fact that sampling was meant to only include children from 6 to 17 months old. As we use age-month fixed effects, we round the age of 5 months old children to 6 months, and those of more than 17 months down to 17 months. Results are robust to exclusion of these observations.
variable.16 Mandal fixed effects are included to control for all the unobservables that are fixed at the mandal
level, 𝜂!.
Our main interest is in the estimation of this regression for children aged 12 to 17 months in 2002, as this is the group of children born before the end of the reservation if they were born in a GP reserved in 1995. We also separately estimate the same specification for children aged 6 to 11 months in 2002, to look at differential impacts for this younger cohort, for whom exposure due to the timing of the elections was more limited. By using separate estimations for the two cohorts, we allow the mandal fixed effects and other controls to separately control for any factors that may be specific for these age groups.17
The outcomes of primary interest are the longer-term impacts (in 2009) of reservation on children’s test scores. The 8-year old children were given the Early Grade Reading Assessment (EGRA) test, which measures the basic skills required for literacy acquisition in early years of schooling. It includes recognizing letters of the alphabet, reading simple words, understanding sentences and paragraphs, and listening with comprehension.18 They were also given a math test with basic computing exercises appropriate for 8-year old children, as well as the PPVT (Peabody Picture Vocabulary Test), a popular test for assessing receptive vocabulary, often used as a proxy for cognition. Z-scores of these tests were calculated by subtracting the mean and dividing by the standard deviation. We also calculate the average of these tests to account for multiple inferences. The second main outcome we focus on is the children’s nutritional status, in particular their height-for-age z-scores and stunting levels, which can be tracked through the three rounds of the survey.
3. LONG TERM IMPACTS OF EARLY EXPOSURE TO RESERVATION
Prior to estimating the full model with all the controls and fixed effects, Figure 2 first provides the raw evidence for the main outcomes of interest. The graph shows the height-for-age z-scores and the average test scores for all children in 2009. The figure clearly shows that the oldest children born in early reservation GPs are doing better than children of the same age born in late reservation GPs. This holds for both height-for-age z-scores and test scores. The difference is positive for children aged 12-13 months or older, and learning differences are the largest for the oldest children. This is consistent with the oldest children benefitting both from in utero exposure, and from better early life health care. For the youngest
16 All results are robust to controlling in addition for the estimated female population ratio. Results are also robust to adding controls for the share of scheduled castes or scheduled tribes.
17 Evidence presented by Menon and Brainerd (2014) indicates, for instance, that religion can be differentially related to nutrition for these two age groups.
children, the differences for height-for-age is less clear while the test score results suggests they might be doing worse in early reservation GPs.
Table 4 then shows the main estimates for children 12-17 months old in 2002, comparing outcomes of children born in GPs reserved from 1995 to 2001 with children from GPs reserved from 2006 to 2011. Hence these estimates compare the main cohort of interest, as they were exposed in utero and during very early childhood in the early reservation GPs, but not in the late reservation GPs. The results show that 8 year olds children born in 2001 in GPs that have been randomly exposed to reservation in the 1995-01 period have significantly better test outcomes than 8 year olds who had reached the age of five before their GPs were exposed to reservation. The differences are positive for all tests and on average children in early reservation GPs have test scores that are .19 standard deviations (SD) higher than those of the same cohort of children in late reservation GPs. In addition, children in early reservation GPs have height-for-age z-scores that are .26 standard deviations larger, a sizable impact given the low average height-for-age z-z-scores in the population of -1.60. The probability of stunting is also lower, though not significantly so.19 Overall
these differences are substantial, in particular given that the 2006 reservation may still have affected the children in late reservation GPs.
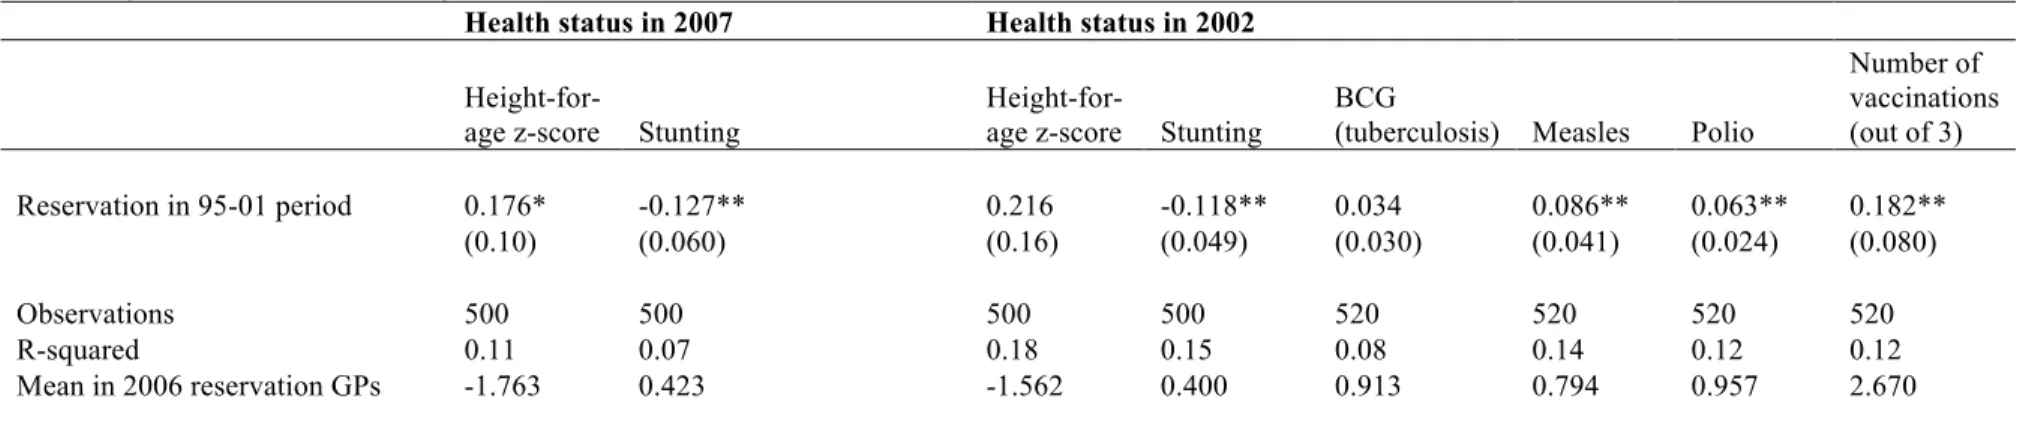
Table 5 shows that these outcomes reflect nutritional and health gains made earlier in the same children’s lives.20 Indeed, in 2007 (when the children were 5 to 6 years old) and in 2002 (when they were 12-17
months old) they already had higher height-for-age z-scores and a significantly lower probability of stunting. The impact on stunting is large, indicating a reduction of 12 percentage points (of a mean of about 40) for children born in early reservation GPs. The same children early on also showed a significantly higher probability of having received the major vaccinations by 2002 and hence were better protected against childhood diseases from very early on. Note also that the GPs with 2006 reservation had not yet had any reservation by the time of the 2002 survey. This allows us to interpret results for 2002 as the absolute short-term impact of being born in a GP exposed to reservation for the last 6 years.
Overall the results in Table 4 and 5 hence suggest that reservation in 1995 to 2001 led to an early advantage in health and nutrition status of children born towards the end of this period, and that this advantage was largely maintained from 2002 to 2007 and 2009. When these children reach the age of 8 (in 2009) they also show substantially better test-scores, consistent with better health and nutrition in early childhood leading to cognitive gains. These gains are still observed in 2009, despite the fact that in the early reservation GPs
19 There is no significant heterogeneity in results for learning or nutrition status by gender, caste or mother’s education (results available from the authors).
20 Table 5 specifically focuses on indicators of health status that are directly observable (anthropometric measurement) or verifiable (vaccinations were verified on a vaccination card, where available).
(with reservation in 95-01 period), reservation had not been in place for already 8 years, while reservation in fact was in place at that point in the late reservation GPs(with reservation in 06-11 period).
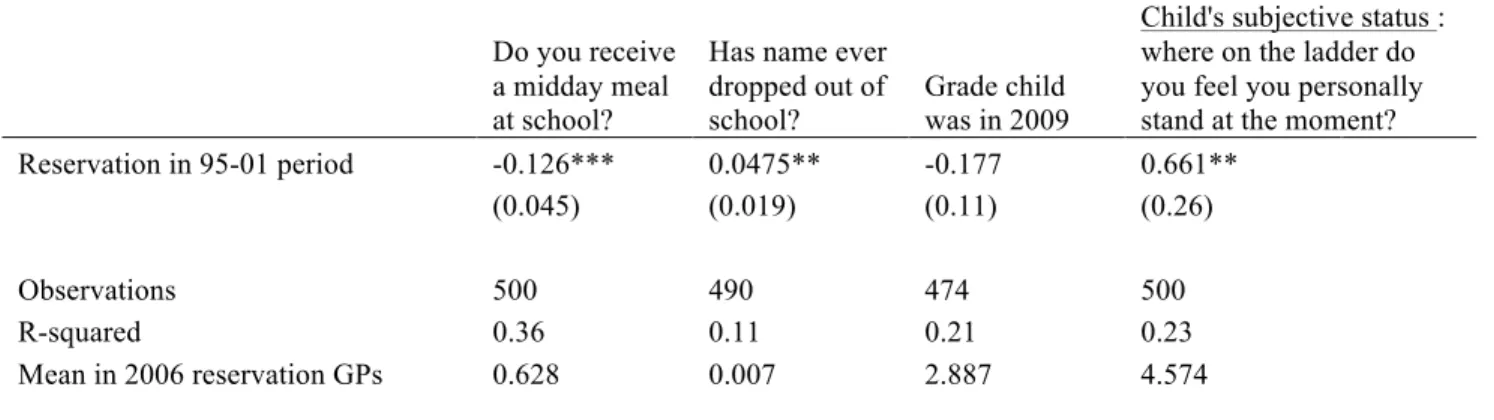
To further understand these findings, table 6 shows a number of schooling outcomes. Previous literature on female reservation has indicated that female leaders often invest in schooling or school meals, and GPs with reservation in place in 2006 might therefore, a priori, be expected to have a schooling advantage. Table 6 indeed provides some indications of such advantages, as the children in the early GPs are significantly less likely to have school meals and are significantly more likely to have dropped out of school. They also appear to be in a lower grade (though not significantly so). This helps to further interpret the test score results in Table 4. Children exposed to early reservation have higher test scores despite apparent disadvantages in a number of schooling indicators in 2009. 21 Children’s own perceptions of their performance are also significantly higher for the early than for the late reservation group, consistent with their higher test scores. Overall, the results suggest that reservation policies may have the highest potential for human capital accumulation when affecting the life circumstances of children very early in their young lives.
To put the magnitude of the test score results in context, Table 7 shows the coefficients of a set of bivariate regressions of test scores on schooling indicators. The effect on test scores of .19 SD amounts to about half a grade of schooling of the child, and to about 2.5 years of schooling of the mother. Given that this is a differential result, this suggests a sizable long-term impact of being exposed to reservation in early childhood. We can also compare the magnitude with other evidence on early childhood exposure to better nutrition or health environments. The differential impact of .19 SD is slightly higher than the .15 SD differential impact found in Barham, Macours and Maluccio (2013) who compare early versus late exposure to a 3 year CCT program in Nicaragua after 10 years. On the other hand it is smaller than typical impacts of intensive interventions combining nutrition, health care and stimulation in other developing countries that can show short-term impacts of more than 1 SD (Engle et al., 2007). Evidence on impacts of such interventions when children are in primary school is scarcer. A potentially interesting comparison is however the well-known Jamaica early childhood home visiting program (Grantham-McGregor et al, 1997). This intensive intervention combining nutrition and stimulation in early childhood, showed very small gains at age 7, even if large impacts were found both immediately after the two year intervention (when children were about 4 years old), and again when children were adults (.6 SD, see Walker et al,
21 Note however that reservation policies in early reservation GPs may well have increased educational quality during the years of reservation and beyond in ways that are not captured in the data. Children born in GPs with earlier reservations could then have benefited for a longer period of such higher quality. When they entered the schooling system, the quality improvements may already have materialized, while for children born in 2006 reservation GPs the quality improvements would not have been there when they entered.
2011). If this means that cognitive gains are hard to observe for this age group, it could imply that our estimates provide a lower bound for the longer-term impacts of female reservation.
4. IMPACTS ON OTHER COHORTS
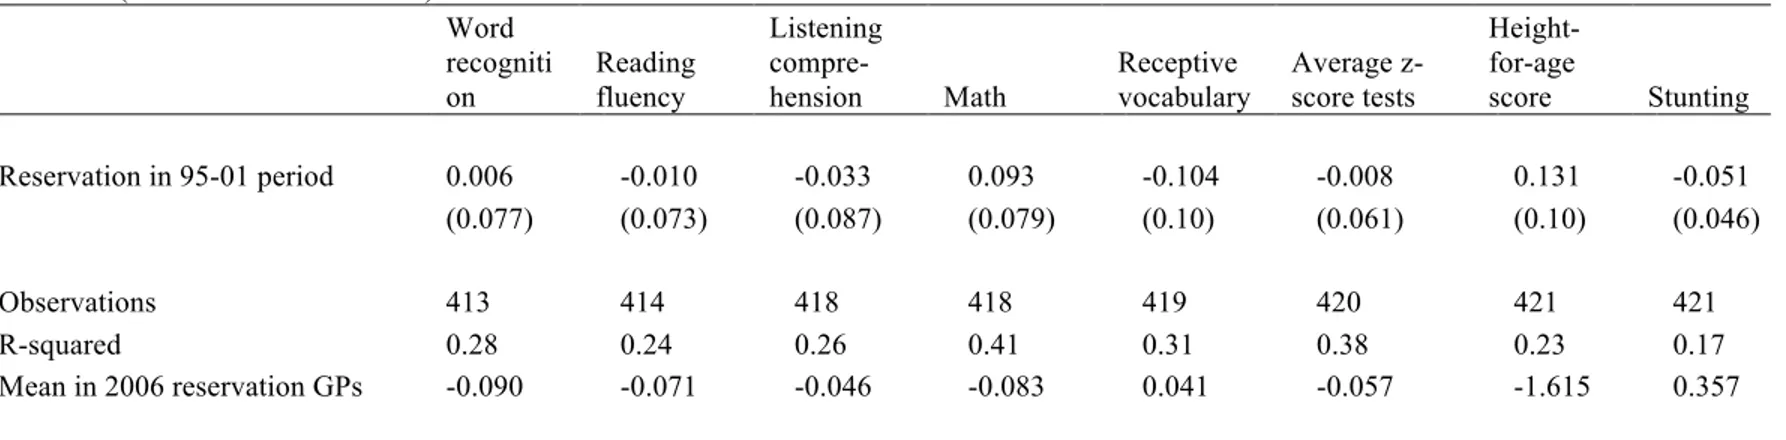
To further understand the relationship between exposure during early childhood and long-term learning and nutritional gains, Table 8 shows results for the cohort of children that was born right after the 1995 to 2001 reservation, i.e. the children aged 6 to 11 months in the fall of 2002. For this cohort, and in contrast to those children exposed in utero, we find no long-term differential effects on either average test scores or on height-for-age z-scores. While the results of the two cohorts are not statistically different from each other, the contrast nevertheless is striking. Table 9 further shows that the short-term results on nutrition and health indicators are also not comparable with the older cohort. There are, in particular, no significant impacts on vaccination or stunting levels. This suggests that the policies causing short-term impacts of reservation on children’s health in utero and during very early childhood did not persist after reservation was no longer in place.
The results in Table 10 are further in line with these findings. Table 10 shows the results for the comparison of the children born in GPs reserved from 2001 to 2006 versus GPs reserved from 2006 to 2011. The results for the 12 to 17 months old show that children born before the 2001 reservation started in their GP do not show any significant differences compared to children in the 2006 GPs. Indeed point estimates are negative, though not significant. On the other hand, the results for 6 to 11 months old suggest that children born after the start of the reservation in the 2001 GPs, and potentially having benefitted from reservation in their GPs the next 5 years, have significantly higher test scores and nutritional status, compared to those in the GPs with reservations in 2006. As indicated earlier, these comparisons should be interpreted with caution, given the evidence of imbalance presented in Table 3, and the overall low number of GPs reserved in 2001. While all estimates control for the variables that were found not to be balanced, it is possible that other unobservable characteristics are not balanced. But even if the evidence is less definite, the pattern in data further supports the main findings of this paper, which indicates that having been exposed to reservation very early in life can lead to long-term learning and nutritional gains.
5. CONCLUSION
This paper shows long-term impacts of reservation of local political seats for women on learning and nutritional outcomes in rural Andhra Pradesh. It relies on three rounds of the Young Lives panel dataset to analyze the impact of exposure to political reservation during different stages of young children’s life. We are able to attribute causality to the reservation policy in the Panchayat as the leadership positions to be reserved were randomly allocated through a rotating mechanism. Using this exogenous variation, we show that reservation policies can be particularly effective in increasing learning outcomes when they occur very early during a child’s life. The results further show that political reservation improved the health and nutritional environment in utero and during the first years of life which can help explain the long-term impacts on children’s learning.
The data used in this paper does not allow analyzing in more detail which specific policy decisions resulting from the female reservation are driving the long-term impacts. The available evidence in the literature suggests moreover that policies favored by female leaders differ across GPs based on heterogeneity of female preferences and needs, so that different policies might have been affected in different places. 22 The
results in this paper reveal that on average, these policy choices led to better health status of children in 2002, which continued in 2007, and translated in higher learning by 2009. While the paper does not investigate the causal pathway, we note that these results are at least consistent with female leaders prioritizing key constraints for children’s human capital, constraints that may well differ from GP to GP. The results in this paper further suggest that any potential advantages of being exposed to reservation-related policies affecting schooling during primary school years did not offset the early nutrition and health gains. 23
These findings go beyond the existing evidence on reservation policies by shedding light on their potential longer-term impacts. They suggest in particular that empowering female leaders might be especially important for improving the health and nutrition of very young children, and that this in turn can lead to substantial longer-term impacts. The evidence also suggests that gains from interventions early in a child’s life can be observed many years later, indicating that evaluations of policies targeting early childhood may
22 As the first round of YLS data was only collected in 2002, it is not well suited to analyze specific policy choices during the early reservation period from 1995 to 2001. Analysis of a wide range of possible intermediate outcomes for the later reservation periods, do not provide support for one particular mechanism. Similarly, data on village infrastructure changes in the different periods do not reveal any robust changes, consistent with reservation leading to different investments in different GPs.
23 An alternative interpretation of the findings could be the potential decrease in effectiveness of reservation policies to affect policy choices. When the reservation first came into place in 1995, it might have had a shock effect and the impact of reservation might have diminished in subsequent cycles, in 2001 and 2006. This could be because other political actors might have been able to respond to the initial shock of reservation and possibly made it ineffective in affecting policy choices by the time the third group of GPs benefited from reservation.
benefit from a sufficiently long horizon. From a broader policy perspective, the results provide support for interventions that improve children’s conditions very early in their lives and suggest that when targeting improvements in learning outcomes, it can be worth considering interventions targeting early childhood in addition to policies directly targeting primary school children.
REFERENCES
Adair Linda S., 1999. “Filipino Children Exhibit Catch-Up Growth from Age 2 to 12 Years.” The Journal of Nutrition, 129(6): 1140-1148.
Afridi, Farzana, Vegard Iversen, and M.R. Sharan, 2013. “Women Political Leaders, Corruption and Learning: Evidence from a Large Public Program in India” Discussion Paper 13-02, Indian Statistical Institute.
Almond, Doug, and Janet Currie, 2011. “Human Capital Development Before Age Five.” in Orley Ashenfelter and David Card (eds.) Handbook of Labor Economics, Volume 4b., Chapter 15, 1315-1486.
Ban, Radu and Vijayendra Rao, 2008. "Tokenism or Agency? The Impact of Women’s Reservations on Village Democracies in South India," Economic Development and Cultural Change, vol. 56: 501-530.
Barham, Tania, 2012. “The Effects of Child Health Interventions on Later Life Cognitive Functioning: Evidence from Matlab in Bangladesh.” American Economic Journal: Applied Economics, 4(1): 245-73.
Barham, Tania, Karen Macours, and John Maluccio, 2013. “Boys’ Cognitive Skill Formation and Physical Growth: Long-term Experimental Evidence on Critical Ages for Early Childhood Interventions”, American Economic Review Papers and Proceedings, 103(3): 467–471.
Bardhan, Pranab, Dilip Mookherjee, and Monica Parra Torrado, 2010. “Impact of Political Reservations in West Bengal Local Governments on Anti-Poverty Targeting”, Journal of Globalization and Development, 1(1): 1948-1837.
Barker, David. J.P, 1992. “The Fetal and Infant Origins of Adult Disease.” British Medical Journal, 17; 301(6761):1111.
Barnett, Steven, 1995. “Long Term Effects of Early Childhood Programs on Cognitive and School Outcomes.” The Future of Children 5: 25–50.
Beaman, Lori, Raghabendra Chattopadhyay, Esther Duflo, Rohini Pande, and Petia Topalova, 2009. “Powerful Women: Does exposure reduce bias?” The Quarterly Journal of Economics, vol. 124(4): 1497-1540.
Beaman, Lori, Esther Duflo, Rohini Pande, and Petia Topalova, 2010. “Political Reservation and Substantive Representation: Evidence from Indian Village Councils.” India Policy Forum, 2010.
Beaman, Lori, Esther Duflo, Rohini Pande, and Petia Topalava, 2012. “Female Leadership Raises Aspirations and Educational Attainment for Girls: A Policy Experiment in India” Science 335, Issue 6068, pp. 582-586.
Beatty, Amanda, and Lant Pritchett, 2013. “The Negative Consequences of Over-Ambitious Curriculum in Developing Countries.” Harvard, mimeo.
Behrman, Jere R., and Mark R. Rosenzweig, 2005. "Does Increasing Women's Schooling Raise the Schooling of the Next Generation? Reply," American Economic Review, 95(5):1745-1751.
Besley, Timothy, Rohini Pande, and Vijayendra, Rao, 2005. "Participatory Democracy in Action: Survey Evidence from South India," Journal of the European Economic Association, vol. 3(2-3), 648-657, 04/05.
Bhalotra, Sonia, and Irma Clots-Figueras, 2011. “Health and the Political Agency of Women”, American Economic Journal: Economic Policy, 6(2): 164-07
Carneiro, Pedro, Costas Meghir, and Matthias Parey, 2012. "Maternal Education, Home Environments and the Development of Children and Adolescents," Journal of the European Economic Association, vol 11(s1): 123-160.
Chattopadhyay, Raghabendra, and Esther Duflo, 2004. "Women as Policy Makers: Evidence from a Randomized Policy Experiment in India," Econometrica, 72(5): 1409-1443.
Clots-Figueras, Irma, 2012. "Are Female Leaders Good for Education? Evidence from India," American Economic Journal: Applied Economics, 4(1): 212-44.
Deaton, Angus, and Jean Dreze, 2009. “Food and Nutrition in India: Facts and Interpretation.” Economic and Political Weekly, vol xliv No 7
Deininger, Klaus, Songqing Jin, Hari Nagarajan, and Xia Fang, 2015. “ Does Female Reservation Affect Long-Term Political Outcomes? Evidence from Rural India”, Journal of Development Studies, 51(1): 32-49.
Doyle, Orla, Colm P. Harmon, James J. Heckman, and Richard E. Tremblay, 2009. “Investing in early Human Development: Timing and Economic Efficiency.” Economics and Human Biology, 7(1), 1-6.
Duflo, Esther, and Petia Topalova, 2004. “Unappreciated Service: Performance, Perceptions, and Women Leaders in India”, mimeo, MIT.
Duflo, Esther, 2012. “Women Empowerment and Economic Development”, Journal of Economic Literature, 50(4): 1051-1079.
Engle, P. L., M. M. Black, J. R. Behrman, M. Cabral de Mello, P. J. Gertler, L. Kapiriri, R. Martorell, M. Eming Young, and The International Child Development Steering Group, 2007. “Strategies to avoid the loss of developmental potential in more than 200 million children in the developing world.” The Lancet 369 (9557): 229–242.
Eriksson, Johan G., Eero Kajantie, Clive Osmond, Kent Thornburg, and David J.P. Barker, 2010. “Boys Live Dangerously in the Womb.” American Journal of Human Biology, 22:330 – 335.
Garces, Eliana, Duncan Thomas, and Janet Currie, 2002. “Longer-term Effects of Head Start.” The American Economic Review, 92(4): 999–1012.
Ghani, Ejaz, William Kerr and Steven O’Connell, 2013. “Political Reservations and Women’s Entrepreneurship in India”, World Bank Policy Research Working Paper 6307.
Grantham-McGregor, S, Y. Cheung, S. Cueto, P. Glewwe, L. Richter, B. Strupp and the International Child Development Steering Group, 2007. "Developmental potential in the first 5 years for children in developing countries". Lancet 2007; 369: 60–70.
Grantham-McGregor, S., S. Walker, S. Chang, and C. Powell, 1997. Effects of early childhood
supplementation with and without stimulation on later development in stunted Jamaican children. American Journal of Clinical Nutrition 66 (2), 247–253.
Heckman, James J., 2008. “Schools, Skills and Synapses,” Economic Inquiry, 46(3): 289-324.
Iyer, Lakshmi, Anandi Mani, Prachi Mishra, and Petia Topalova, 2012. "The Power of Political Voice: Women's Political Representation and Crime in India," American Economic Journal: Applied Economics, 4(4): 165-93.
Jayachandran, Seema, and Rohini Pande, 2015. “Why Are Indian Children So Short? The Role of Birth Order and Son Preference”, NBER Working Papers 21036.
Jha, Raghbendra, Sharmistha Nag, and Hari K. Nagarajan, 2011. “Political Reservations, Access to Water and Welfare Outcomes: Evidence from Indian Villages”, ASARC Working Paper 2011/15, Australian National University.
Kumar, Santosh, and Nishit Prakash, 2012. “Political Decentralization, Women’s Reservation and Child Health Outcomes: A Case Study of Rural Bihar”, Working papers 2012-19. University of Connecticut, Department of Economics
Maluccio, John A., John Hoddinott, Jere R. Behrman, Reynaldo Martorell, Agnes R. Quisumbing, and Aryeh D. Stein, 2009. "The Impact of Improving Nutrition During Early Childhood on Education among Guatemalan Adults." Economic Journal, 119(537): 734-63.
Brainerd, Elizabeth, and Nidhiya Menon, 2013. “Religion and Health in Early Childhood: Evidence from the Indian Subcontinent”, Working Paper 65, Brandeis University, Department of Economics and International Business School.
Figure 2: Nutritional status and test scores in 2009 for children born in GPs reserved in 1995 versus 2006
Note: results of kernel-weighted local polynomial regression height-for-age z-scores and average test scores on age in months in 2002, seperately for the 1995 and 2006 reservation groups. Average test scores are calculated as the mean of 5 internally-standardized test scores measuring word recognition, reading fluency, listening comprehension, mathematics skills and receptive vocabulary.
-1 .6 5 -1 .6 -1 .5 5 -1 .5 -1 .4 5 -1 .4 6 8 10 12 14 16 18
age in months in fall 2002 95 reservation 06 reservation Height-for-age z-scores -. 2 -. 1 0 .1 .2 .3 6 8 10 12 14 16 18
age in months in fall 2002 95 reservation 06 reservation In te rn a lly st a n d a rd ize d t e st sco re
Average test scores
H e ig h t-f o r-a g e z-sco re
Table 1:Selection into sample: characteristics of villages, households and children with and without election data YLS GP without election data YLS GP with election
data Difference P-value
Village level data N=23 N=59
Total land area in the village 1875 1708 166.6 (0.71) Total arable land in the village 1147 989.2 157.8 (0.50) Total irrigated land in the village 255.7 349.1 -93.5 (0.48) Total population 1677 1809 -132.2 (0.68) Distance to the district/regional capital (in km) 75.77 69.89 5.88 (0.52) Hindi one of the most widely spoken languages 0.435 0.576 -0.141 (0.25) Marathi one of the most widely spoken languages 0.304 0.254 0.050 (0.65) Backward caste the largest ethnic group 0.565 0.586 -0.021 (0.87) Scheduled caste and/or scheduled tribe the largest ethnic group 0.261 0.310 -0.050 (0.66) Christians one of the major religious groups 0.652 0.322 0.330*** (0.01) Muslims one of the major religious groups 0.391 0.508 -0.117 (0.35) Handicrafts one of the main economic activities 0.217 0.220 -0.003 (0.98) Construction one of the main economic activities 0.348 0.339 0.009 (0.94) Trade one of the main economic activities 0.609 0.492 0.117 (0.35) Ratio of adult females/adult males 0.499 0.498 0.001 (0.90) Average number of adult women in the household (> 15 years) 1.773 1.791 -0.018 (0.82)
Household & child level data N=346 N=1201
Male child 0.552 0.529 0.023 (0.35) Child's age (in months) 11.99 11.82 0.168 (0.54) Only born child in 2002 0.367 0.371 -0.004 (0.88) Age of biological mother 22.97 23.68 -0.713* (0.06) Mother's ethnicity (dummy for backward Caste) 0.526 0.457 0.069 (0.36) Mother's ethnicity (dummy for Scheduled Caste) 0.237 0.193 0.044 (0.34) Mother's ethnicity (dummy for Scheduled Tribe) 0.127 0.192 -0.064 (0.29) Household head completed primary 0.315 0.326 -0.011 (0.77) Highest grade mother completed in school 2.443 2.181 0.262 (0.54) Mother had no schooling 0.656 0.716 -0.060 (0.29)
Note: *** p<0.01, ** p<0.05, * p<0.1 s.e. clustered at GP level. Results are similar when s.e. are clustered at the mandal
Table 2:Descriptive statistics in 2002 for the GPs reserved in 1995 and 2006 GP with 1995 reservation GP with 2006
reservation Difference P-value
Village level data N=20 N=27
Total land area in the village 1724 1606 118.3 (0.83) Total arable land in the village 1000 940.5 59.76 (0.83) Total irrigated land in the village 266.6 418.8 -152.3 (0.43) Total population 1719 1979 -260.3 (0.54) Distance to the district/regional capital (in km) 67.88 66.93 0.956 (0.94) Hindi one of the most widely spoken languages 0.450 0.630 -0.180 (0.23) Marathi one of the most widely spoken languages 0.200 0.333 -0.133 (0.32) Backward caste the largest ethnic group 0.632 0.556 0.076 (0.62) Scheduled caste and/or scheduled tribe the largest ethnic group 0.316 0.333 -0.018 (0.90) Christians one of the major religious groups 0.400 0.185 0.215 (0.11) Muslims one of the major religious groups 0.400 0.556 -0.156 (0.30) Handicrafts one of the main economic activities 0.150 0.222 -0.072 (0.54) Construction one of the main economic activities 0.300 0.370 -0.070 (0.62) Trade one of the main economic activities 0.500 0.556 -0.056 (0.71) Ratio of adult females/adult males 0.495 0.492 0.003 (0.74) Average number of adult women in the household (> 15 years) 1.658 1.828 -0.170** (0.04)
P-value joint significance test 0.49
Household & child level data (12-17 months old) N=225 N=301
Male child 0.498 0.561 -0.064 (0.12) Child's age (in months) 14.44 14.52 -0.083 (0.56) Only born child in 2002 0.391 0.349 0.042 (0.30) Age of biological mother 23.78 23.75 0.032 (0.93) Mother's ethnicity (dummy for backward Caste) 0.431 0.462 -0.031 (0.75) Mother's ethnicity (dummy for Scheduled Caste) 0.209 0.176 0.033 (0.54) Mother's ethnicity (dummy for Scheduled Tribe) 0.227 0.183 0.044 (0.65) Household head completed primary 0.458 0.350 0.108 (0.12) Highest grade mother completed in school 2.959 2.332 0.627 (0.28) Mother had no schooling 0.613 0.695 -0.082 (0.22)
P-value joint significance test 0.32
Table 3:Descriptive statistics in 2002 for the GPs reserved in 2001 and 2006 GP with 2001 reservation GP with 2006
reservation Difference P-value
Village level data N=12 N=27
Total land area in the village 1913 1606 307.0 (0.57) Total arable land in the village 1087 940.5 146.7 (0.62) Total irrigated land in the village 307.0 418.8 -111.8 (0.64) Total population 1511 1979 -468.2 (0.36) Distance to the district/regional capital (in km) 79.42 66.93 12.49 (0.38) Hindu one of the most widely spoken languages 0.667 0.630 0.0370 (0.83) Marathi one of the most widely spoken languages 0.167 0.333 -0.167 (0.30) Backward caste the largest ethnic group 0.583 0.556 0.0278 (0.88) Scheduled caste and/or scheduled tribe the largest ethnic group 0.250 0.333 -0.0833 (0.61) Christians one of the major religious groups 0.500 0.185 0.315** (0.05) Muslims one of the major religious groups 0.583 0.556 0.0278 (0.88) Handicrafts one of the main economic activities 0.333 0.222 0.111 (0.48) Construction one of the main economic activities 0.333 0.370 -0.0370 (0.83) Trade one of the main economic activities 0.333 0.556 -0.222 (0.21) Ratio of adult females/adult males 0.514 0.492 0.0220* (0.08) Average number of adult women in the household (> 15 years) 1.874 1.834 0.0395 (0.72)
Household & child level data (12-17 months old) N=136 N=301
Male child 0.485 0.561 -0.076* (0.09) Child's age (in months) 14.74 14.52 0.224 (0.10) Only born child in 2002 0.404 0.349 0.056 (0.26) Age of biological mother 24.51 23.75 0.758 (0.19) Mother's ethnicity (dummy for backward Caste) 0.529 0.462 0.068 (0.60) Mother's ethnicity (dummy for Scheduled Caste) 0.191 0.176 0.015 (0.85) Mother's ethnicity (dummy for Scheduled Tribe) 0.191 0.183 0.008 (0.94) Household head completed primary 0.213 0.350 -0.137 (0.14) Highest grade mother completed in school 0.963 2.332 -1.370** (0.02) Mother had no schooling 0.866 0.695 0.171** (0.01)
Table 4: Differential long term effect of 1995 reservation on test scores and nutritional status in 2009 : children in utero during 95-01 reservation (12-17 months in fall 2002) Word recognition Reading fluency Listening compre-hension Math Receptive vocabulary Average z-score tests Height-for-age score Stunting Reservation in 95-01 period 0.191*** 0.250** 0.248* 0.026 0.222* 0.188** 0.258** -0.064 (0.065) (0.10) (0.12) (0.095) (0.11) (0.085) (0.12) (0.046) Observations 499 500 501 499 497 502 501 501 R-squared 0.23 0.22 0.22 0.28 0.21 0.29 0.10 0.05 Mean in 2006 reservation GPs -0.016 0.016 -0.003 0.151 0.033 0.035 -1.602 0.339
Note: *** p<0.01, ** p<0.05, * p<0.1 s.e. clustered at GP level (in parentheses). All estimations only include children in GPs that were either reserved in 1995 or in 2006. Controls include child’s gender and monthly age-dummies, dummy indicating whether child is first born, mother’s age, mother's ethnicity (dummies for SC, ST and BC), mother's highest educational grade completed and dummy for no schooling, average adult females in household in GP, and mandal fixed effects.
Table 5: Medium and short-term effects of 1995 reservation on nutritional and health status in 2007 and 2002: : children in utero during 95-01 reservation
(12-17 months in fall 2002)
Health status in 2007 Health status in 2002
Height-for-age z-score Stunting
Height-for-age z-score Stunting
BCG
(tuberculosis) Measles Polio
Number of vaccinations (out of 3) Reservation in 95-01 period 0.176* -0.127** 0.216 -0.118** 0.034 0.086** 0.063** 0.182** (0.10) (0.060) (0.16) (0.049) (0.030) (0.041) (0.024) (0.080) Observations 500 500 500 500 520 520 520 520 R-squared 0.11 0.07 0.18 0.15 0.08 0.14 0.12 0.12 Mean in 2006 reservation GPs -1.763 0.423 -1.562 0.400 0.913 0.794 0.957 2.670
Note: *** p<0.01, ** p<0.05, * p<0.1 s.e. clustered at GP level (in parentheses). All estimations only include children in GPs that were either reserved in 1995 or in 2006. Controls include child’s gender and monthly age-dummies, dummy indicating whether child is first born, mother’s age, mother's ethnicity (dummies for SC, ST and BC), mother's highest educational grade completed and dummy for no schooling, average adult females in household in GP, and mandal fixed effects. The last column sums up vaccination of BCG, Measles and Polio. 20 observations with missing values for anthropometric outcomes due to missing measurements and trimming of values below -5sd and above +5sd.
Table 6: Differences between 1995 and 2006 reservation groups on schooling outcomes in 2009: children in utero during 95-01 reservation (12-17 months in fall 2002) Do you receive a midday meal at school?
Has name ever dropped out of school?
Grade child was in 2009
Child's subjective status : where on the ladder do you feel you personally stand at the moment? Reservation in 95-01 period -0.126*** 0.0475** -0.177 0.661** (0.045) (0.019) (0.11) (0.26) Observations 500 490 474 500 R-squared 0.36 0.11 0.21 0.23 Mean in 2006 reservation GPs 0.628 0.007 2.887 4.574
Note: *** p<0.01, ** p<0.05, * p<0.1 s.e. clustered at GP level (in parentheses). All estimations only include children in GPs that were either reserved in 1995 or in 2006. Controls include child’s gender and monthly age-dummies, dummy indicating whether child is first born, mother’s age, mother's ethnicity (dummies for SC, ST and BC), mother's highest educational grade completed and dummy for no schooling, average adult females in household in GP, and mandal fixed effects.
Table 7: Correlation of tests scores with educational variables
Average z-score tests
coef se
Mother's year of schooling 0.074*** 0.004
Grade child was in 2009 0.355*** 0.008
Has name ever dropped out of
school? -0.641*** 0.008
Note: Each line shows the coefficient of separate bivariate regression. *** p<0.01, ** p<0.05, * p<0.1 s.e. clustered at GP level (in parentheses).