HAL Id: inserm-02950964
https://www.hal.inserm.fr/inserm-02950964
Submitted on 28 Sep 2020
HAL is a multi-disciplinary open access
archive for the deposit and dissemination of
sci-entific research documents, whether they are
pub-lished or not. The documents may come from
teaching and research institutions in France or
abroad, or from public or private research centers.
L’archive ouverte pluridisciplinaire HAL, est
destinée au dépôt et à la diffusion de documents
scientifiques de niveau recherche, publiés ou non,
émanant des établissements d’enseignement et de
recherche français ou étrangers, des laboratoires
publics ou privés.
G-Quadruplexes in the Archaea Domain
Václav Brázda, Yu Luo, Martin Bartas, Patrik Kaura, Otilia Porubiaková, Jiří
Šťastný, Petr Pečinka, Daniela Verga, Violette da Cunha, Tomio Takahashi, et
al.
To cite this version:
Václav Brázda, Yu Luo, Martin Bartas, Patrik Kaura, Otilia Porubiaková, et al.. G-Quadruplexes
in the Archaea Domain. Biomolecules, MDPI, 2020, 10 (9), pp.E1349. �10.3390/biom10091349�.
�inserm-02950964�
Biomolecules 2020, 10, 1349; doi:10.3390/biom10091349 www.mdpi.com/journal/biomolecules
Article
G-Quadruplexes in the Archaea Domain
Václav Brázda 1,*, Yu Luo 2, Martin Bartas 3, Patrik Kaura 4, Otilia Porubiaková 1,5, Jiří Šťastný 4,6, Petr Pečinka 3, Daniela Verga 2, Violette Da Cunha 7, Tomio S. Takahashi 7, Patrick Forterre 7, Hannu Myllykallio 8, Miroslav Fojta 1 and Jean-Louis Mergny 1,8,*
1 Institute of Biophysics of the Czech Academy of Sciences, Královopolská 135, 612 65 Brno, Czech Republic;
o.porubiakova@gmail.com (O.P.); fojta@ibp.cz (M.F.)
2 Universite Paris Saclay, CNRS UMR9187, INSERM U1196, Institut Curie, 91400 Orsay, France;
yu.luo@curie.fr (Y.L.); Daniela.Verga@curie.fr (D.V.)
3 Department of Biology and Ecology/Institute of Environmental Technologies, Faculty of Science,
University of Ostrava,710 00 Ostrava, Czech Republic; dutartas@gmail.com (M.B); petr.pecinka@osu.cz (P.P.)
4 Brno University of Technology, Faculty of Mechanical Engineering, Technicka 2896/2, 616 69 Brno, Czech
Republic; 160702@vutbr.cz (P.K); stastny@fme.vutbr.cz (J.S.)
5 Brno University of Technology, Faculty of Chemistry, Purkyňova 464/118, 612 00 Brno, Czech Republic 6 Mendel University in Brno, Zemědělská 1, Brno, 613 00, Czech Republic
7 Institut de Biologie Intégrative de la Cellule (I2BC), CNRS, Université Paris-Saclay, 91198 Gif-sur-Yvette
Cedex, France; violette.da.cunha.vdc@gmail.com (V.D.C.); tomio.takahashi@i2bc.paris-saclay.fr (T.S.T.); patrick.forterre@pasteur.fr (P.F.)
8 Laboratoire d’Optique et Biosciences, Ecole Polytechnique, CNRS, INSERM, Institut Polytechnique de
Paris, 91128 Palaiseau, France; hannu.myllykallio@polytechnique.edu (H.M.)
* Correspondence: jean-louis.mergny@inserm.fr (J.-L.M.); vaclav@ibp.cz (V.B.) Tel.: +420-541517-231; Fax:
+420-541211-293.
Received: 11 August 2020; Accepted: 18 September 2020; Published: 21 September 2020
Abstract: The importance of unusual DNA structures in the regulation of basic cellular processes is
an emerging field of research. Amongst local non-B DNA structures, G-quadruplexes (G4s) have gained in popularity during the last decade, and their presence and functional relevance at the DNA and RNA level has been demonstrated in a number of viral, bacterial, and eukaryotic genomes, including humans. Here, we performed the first systematic search of G4-forming sequences in all archaeal genomes available in the NCBI database. In this article, we investigate the presence and locations of G-quadruplex forming sequences using the G4Hunter algorithm. G-quadruplex-prone sequences were identified in all archaeal species, with highly significant differences in frequency, from 0.037 to 15.31 potential quadruplex sequences per kb. While G4 forming sequences were extremely abundant in Hadesarchaea archeon (strikingly, more than 50% of the Hadesarchaea archaeon isolate WYZ-LMO6 genome is a potential part of a G4-motif), they were very rare in the
Parvarchaeota phylum. The presence of G-quadruplex forming sequences does not follow a random
distribution with an over-representation in non-coding RNA, suggesting possible roles for ncRNA regulation. These data illustrate the unique and non-random localization of G-quadruplexes in Archaea.
Keywords: G4-forming motif; genome analysis; Archaea; unusual nucleic acid structures; sequence
prediction
1. Introduction
The Archaea domain was classified separately from Bacteria by Carl Woese and George Fox in 1977 [1]. Later on, it was found that all major molecular machinery, such as DNA replication, transcription, and translation, of archaea are much more similar to those of eukaryotes than to those
of bacteria [2,3]. This is also true for some important membrane proteins, such as ATP synthases and proteins of the Sec transport system [4,5], or for some proteins involved in cell division and vesicle trafficking [6]. Thus, the archaeal domain occupies a key position in the Tree of Life, and there is currently a hot debate about their exact relationships with eukaryotes [7,8]. A schematic phylogenic tree for the Archaea domain is proposed in Figure 1; this phylogeny is rapidly evolving with many new phyla recently identified via the accumulation of metagenome associated genomes (MAGs) and various new proposals for phylum definition and nomenclature [9,10]. The first detected archaea were isolated in harsh environments but later found in almost every environment, including the human microbiota, where they play important roles in the gut, mouth, and on the skin [11,12]. It has been hypothesized that archaea found in oceans are one of the most abundant groups of organisms on the planet with important roles both in the carbon and the nitrogen cycle [13]. The Archaea domain has several unique features, such as ether-linked lipids, while eukaryotes and most of the bacteria have ester-linked lipids [14]. Moreover, the stereochemistry of archaeal lipids has the opposite configuration as compare to the ones of eukaryotic and bacterial origin. Interestingly, methanogenesis, the production of greenhouse methane gas as a metabolic by-product, occurs only in the archaeal domain [15,16].
Figure 1. A schematic phylogenic tree for Archaea. This unrooted evolutionary tree of Archaea is
based on the schematic tree of Forterre (2015) [17] updated according to recent phylogenetic analyses [9,18]. BAT stands for Bathyarchaeota, Aigarchaeota, and Thaumarchaeota. DPANN is an acronym based on the first five groups discovered: Diapherotrites, Parvarchaeota, Aenigmarchaeota, Nanoarchaeota, and Nanohaloarchaeota. The term BAT superphylum has been proposed by Gaia et al. in 2018 [19], and the terms Eury and Cren superphyla are suggested here. The terms Cren superphylum is suggested here because the phyla Crenarchaeota, Verstratearchaeota Marsarchaeota, Nezaarchaeota, and Geothermarchaeota form a consensus monophyletic clade in all archaeal phylogeny. We included
Korarchaeota in this superphylum because they often branch as sister groups of the above phyla in
archaeal phylogenies, although the fast evolutionary rate made their positioning sometimes difficult. We suggested in parallel the term Eury superphylum because Euryarchaeota includes very diverse groups of cultivated and uncultivated Archaea which are difficult to the group in a single phylum, especially considering that phyla, such as Verstratearchaeota Marsarchaeota, or Nezaarchaeota only contain few uncultivated species only defined by a few metagenome associated genomes (MAGs). Names in bold letters correspond to subgroups that include cultivated species; names in thin letters correspond to subgroups that include only MAGs.
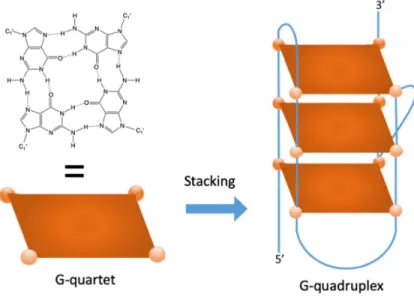
G-quadruplex structures (G4) formed by guanine rich sequences are among the most intensively studied local DNA/RNA structures [20]. G4s are formed by G:G Hoogsteen base pairing in a guanine quartet, and their formation requires the presence of stabilizing cations, such as potassium [21] (Figure 2). In both bacteria and eukaryotes, G4 formation regulates various processes, including gene expression [22], protein translation [23], and proteolysis [24]. G4 have been identified in a number of pathogens, including viruses, eukaryotes (e.g., Plasmodium falciparum) [25,26] or prokaryotes (e.g.,
Neissseria gonorrhoeae [27], and Mycobacterium tuberculosis) [28,29]. Moreover, many G4-binding
proteins are conserved in all organisms highlighting the importance of the G4 structure regulations [30], and novel G4 binding proteins have been identified, sharing the NIQI amino acid motif (RGRGRRGGGSGGSGGRGRG) [31]. Specific helicases have been identified both in eukaryotes and bacteria to unfold these structures, which can be extremely stable and would be problematic for the transcription or replication of G-rich motifs (e.g., the Pif1 or RecQ family helicases) [32]. Recently, G4Hunter was successfully used for the prediction of G-quadruplex-forming sequences in all complete bacterial genomes [33]. These results showed that G-quadruplex-forming sequences are present in all species with the highest frequencies in some extremophiles. In contrast to RNA, there is no correlation between genomic DNA GC% in Archaea (and in Bacteria) and the optimal growth temperature. This is likely because DNA in vivo is topologically closed, and topologically closed DNA is stable at least up to 107 °C [34]. We therefore cannot anticipate a higher density of G4-prone motifs in thermophiles, due to a GC-bias.A comparison with Extremophiles in bacteria is interesting [35]. Ding et al. hypothesized that stress-resistant bacteria found in the Deinococcales may utilize
putative quadruplex sequences (PQS) for gene regulatory purposes.An enrichment in prokaryote
PQS has been found in thermophilic organisms [33] but also in organisms with resistance to other stress factors, such as radiation [36,37]; thus, a direct correlation between temperature and G4 presence is not supported by these findings. In addition, while bacteria in the Deinococcus-Thermus group are the most abundant for PQS, it is striking that the mostly thermophilic and hyperthermophilic bacteria in the Thermotogae phylum have one of the lowest PQS frequencies. Correlation among thermophiles and G4s, therefore, depends on the phylum (Gram-negative vs. Gram-positive bacteria).
Due to the roles of G4s in the regulation of basic cellular processes, it is important to identify their location in genomes. Several algorithms are available to predict G-quadruplex-forming sequences [38–41]. Among them, the G4Hunter application was developed to provide quantitative analyses giving a propensity score as an output [41], and the G4Hunter web tool allows effective and fast analyses of PQS in large datasets [42].
Figure 2. A G-quartet involves four coplanar guanines establishing a cyclic array of H-bonds (left).
Stacking of two or more (three in this example) quartets leads to the formation of a G-quadruplex structure (right), stabilized by cations, such as potassium (not shown).
The prokaryotic genetic material is generally stored in circular chromosomes and plasmids [43]. The presence of quadruplex-prone motifs in over a hundred of bacterial genomes was determined over a decade ago [44]. In bacterial genomes, PQS are located non-randomly with a higher relative abundance in non-coding RNA (ncRNA), mRNA, and regions around tRNA and regulatory sequences. PQS also play roles in nitrate assimilation in Paracoccus denitrificans [45]. PQS in the hsdS, recD, and pmrA genes of Streptococcus pneumoniae contributes to host–pathogen interactions [46]. Such observations show the significant role of G4 in bacteria. The importance of another local DNA structure, the cruciform formed by inverted repeats, has been shown as an important regulatory feature of eukaryotic cell organelles, such as chloroplasts and mitochondria with circular DNA genomes [47,48]. Overall, the role of G4s in bacteria [27,49] and eukaryotes [50] is increasingly recognized.
In contrast, little is currently known regarding the abundancy and location of PQS in the archaeal domain. Ding et al. performed an initial search on bacterial and archaeal genomes using a modified Quadparser algorithm with relaxed parameters allowing long loops (up to 12 nucleotides) [35]. They found that thermophilic microorganisms (both archaea and bacteria) appear to favor PQS in their genomes. Dhapola et al. created the Quadbase2 web server, in which G4 motifs found in a variety of organisms, including archaea, may be searched but did not analyze G4 propensity in archaea [51]. Because G4s play many important biological roles in bacterial and eukaryotic cells, we assume that G4s are also likely to have important functions in archaea. Therefore, we comprehensively analyzed the presence and locations of PQS in all sequenced archaeal genomes by G4Hunter [41,42]. These data provide the first study analyzing the presence of G4-prone sequences in this important domain of life.
2. Materials and Methods
2.1. Selection of the DNA Sequences
The set of all archaeal genomic DNA sequences was downloaded from the Genome database of the National Center for Biotechnology Information [52]. We have used for our analyses all accessible archaeal genomes, including contig and scaffold sequences (3387 genomes), and we have selected one representative genome for each species (Supplementary Table S1). For PQS analyses of features, we restricted our analysis to the subset of 140 completely assembled genomes. In total, we have
analyzed the presence of G4 forming sequences in 3,387 genomes from the archaeal Domain representing a total of 6,423 Mbps.
2.2. Process of Analysis
We used the computational core of our DNA analyzer software written in Java programming language [53]. For our analyses, we used a new G4Hunter algorithm implementation [42]. Default parameters for G4Hunter were set to “25” for window size and 1.2 or above for the G4H score (G4HS). PQS score was grouped to the five intervals: 1.2–1.4, 1.4–1.6, 1.6–1.8,1.8 –2.0, and 2.0 and more. Overall results for each species group contained a list of species with size of its genomic DNA sequence and number of putative G4 sequences found (Supplementary Table S2A); for clarity, the results for Groups and Subgroups are in separate files (Supplementary Table S2B and S2C). These data were processed by python jupyter using pandas with statistical tools [54]. Graphs were generated from the pandas tables using the “seaborn” graphical library. Note that the distinction between overlapping or discrete (non-overlapping) G4 motifs may create issues in the way potential motifs are counted. For this reason, we also provide a %PQS factor, which corresponds to the probability that any given nucleotide in the group or subgroup belongs to a G4-prone region (G4H > 1.2).
The default window value for G4Hunter has been discussed and tested in previous publications [41]. The value is chosen here (25 nt) corresponds more or less to the size of a typical intramolecular quadruplex. We considered shorter windows (20 nt) in previous studies. However, we noticed that for low thresholds (< 1.2), a single GGGGGG run would give a hit; while intermolecular G4 formation is indeed possible with this motif, we hypothesized that intramolecular structures would be more relevant.
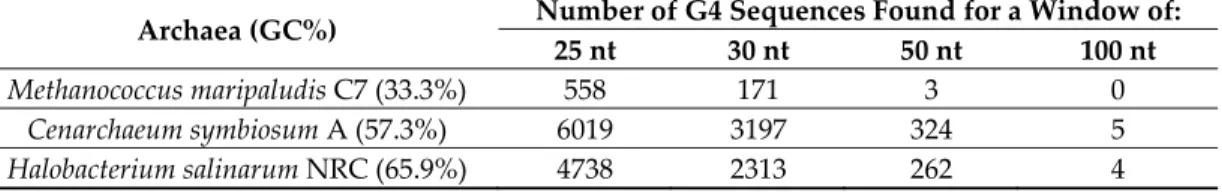
A slightly longer window (e.g., 30 nucleotides) further contributes to eliminating such motifs, but at the cost of significantly decreasing the number of hits (by a factor of 2 to 3; see Table 1): This larger window would, therefore, increase the number of false negatives, i.e., miss “real” intramolecular G4. On the other hand, a much larger window (50–100 nt) would be interesting to identify “G4 clusters” in which multiple tandem quadruplexes may be formed. We present the number of sequences found in three different complete archaeal genomes using four different window sizes and a threshold of 1.2:
Table 1. A number of putative quadruplex sequences (PQS) were found using four different window
sizes in three complete archaeal genomes.
Archaea (GC%) Number of G4 Sequences Found for a Window of: 25 nt 30 nt 50 nt 100 nt
Methanococcus maripaludis C7 (33.3%) 558 171 3 0
Cenarchaeum symbiosum A (57.3%) 6019 3197 324 5
Halobacterium salinarum NRC (65.9%) 4738 2313 262 4 As shown in Table 1, long G-rich prone regions, potentially supporting the formation of multiple quadruplexes, are present, but far less frequent (by a factor of 19 to 186 for a window of 50 vs. 25) than the classically defined G4Hunter motifs. In these three genomes, a large majority (95–99%) of the G4-prone regions would only support the formation of a single individual quadruplex.
2.3. Analysis of Putative G4 Sequences Around Annotated NCBI Features
We downloaded feature tables from the NCBI database along with genomic DNA sequences. Feature tables contain annotations of known features found in DNA sequences. We performed an analysis of G4-prone sequences occurrence inside recorded features. Features were grouped by their name stated in the feature table file (gene, rRNA, tRNA, ncRNA, and repeat region). From this analysis, we obtained a file with feature names and numbers of putative G4 forming sequences found inside and around features for each group of species analyzed. Search for putative G4 forming
sequences took place inside feature boundaries; note that frequencies of inverted repeats in mitochondrial DNA (mtDNA) [48], as well in the G4 prone sequences in bacteria [33], are distributed with different frequencies in close proximity to specific features. Further processing was performed in Microsoft Excel and the data are available as Supplementary Table S3.
2.4. Statistical Analysis
A cluster dendrogram of PQS characteristics was constructed in program R, version 3.6.3, library
pvclust [55], to further reveal and graphically depict similarities between particular archaeal
subgroups. Mean, Min, Max, and % PQS values were used as input data (Supplementary Table S4). The following parameters were used for analysis: Cluster method ‘ward.D2′, distance ‘Euclidean’, number of bootstrap resampling was set to 10,000. Statistically significant clusters (based on AU values (blue) above 95, equivalent to p-values less than 0.05) are highlighted by rectangles marked with broken red lines. R code is provided in Supplementary Table S4). Statistical evaluations of differences in G4 forming sequences presence in various phylogenetic groups were made by a Kruskal–Wallis test with a Bonferroni adjustment in STATISTICA, with p-value cut-off 0.05; data are available in Supplementary Table S5.
2.5. Quadruplex Formation In Vitro
Representative examples of the candidate sequences identified by G4Hunter were experimentally tested for G4 formation using different techniques: Isothermal difference spectra (IDS) and Circular dichroism (CD as described previously [41]).
2.5.1. Samples
Oligonucleotides were purchased from Eurogentec, Belgium, as dried samples purified by RP cartridge purification. Stock solutions were prepared at 250 μM strand concentration in ddH2O.
2.5.2. Experimental Conditions
Most experiments were performed in a 10 mM Lithium Cacodylate pH 7.1 buffer supplemented with 100 mM KCl (since Hadesarchaea has not been cultivated, it is impossible to know their intracellular potassium concentration. However, this is in the range of intracellular potassium concentration for other archaea, such as Thermococcales).
2.5.3. Isothermal Spectra
2.5 μM oligonucleotide solutions were prepared in 10 mM Lithium Cacodylate buffer at pH 7.1. The solutions were kept at 95 °C for 5 min and slowly cooled to room temperature and kept at 4 °C overnight. Absorbance spectra were recorded on a Cary 300 (Agilent Technologies, France) spectrophotometer at 37 °C (scan range: 500–200 nm; scan rate: 600 nm/min; automatic baseline correction). After recording these first series of spectra (unfolded as no potassium was present) 1 M KCl (100 μL) was added to the samples, and UV-absorbance spectra were recorded after 15 min equilibration, and corrected for dilution. Each IDS corresponds to the arithmetic difference between the initial (unfolded) and final (folded, corrected for dilution) spectra.
2.5.4. Circular Dichroism
2.5 μM oligonucleotide solutions were prepared in 10 mM lithium cacodylate buffer at pH 7.1 supplemented with 100 mM KCl. The solutions were kept at 95 °C for 5 min and slowly cooled to room temperature and kept at 4 °C overnight. CD spectra were recorded on a JASCO J-1500 (France) spectropolarimeter at room temperature or at 80 °C, using a scan range of 400–210 nm, a scan rate of 200 nm/min, and averaging four accumulations (Supplementary figure S1).
For G-quadruplex binding proteins prediction, based on previously published G-quadruplex binding motif (RGRGRGRGGGSGGSGGRGRG) [31], the BLASTp algorithm was used [56]. The target organisms were limited to the Archaea domain (NCBI taxid ID: 2157). E-value cut-off was set to 0.05. For similarity search of RecQ helicase from Escherichia coli (UNIPROT ID: P15043), BLASTp algorithm [56] was used with an E-value cut-off of 0.0001 and the same restriction to the Archaea domain, as above. BLASTp analyses are enclosed in Supplementary Table S6. FIMO search [57,58] for G-quadruplex binding motif (RGRGRGRGGGSGGSGGRGRG) [31] in Methanosarcina mazei complete proteome was carried out on a set of 15722 known protein sequences downloaded from NCBI, with q-value (p-value corrected for multiple testing by Benjamini and Hochberg method) cut-off of 0.05 (Supplementary Table S7). The most similar protein of RecQ helicase from Escherichia coli (UNIPROT ID: P15043) in Hadesarchaea archaeon isolate WYZ-LMO6 was searched using tBLASTn [59], and the resulting best hit was translated using Expasy Translate Tool [60,61] and functional domain were visualized using NCBI CDD [62] (Supplementary Table S8).
3. Results
3.1. Prediction of G4 Forming Sequences in Archaea
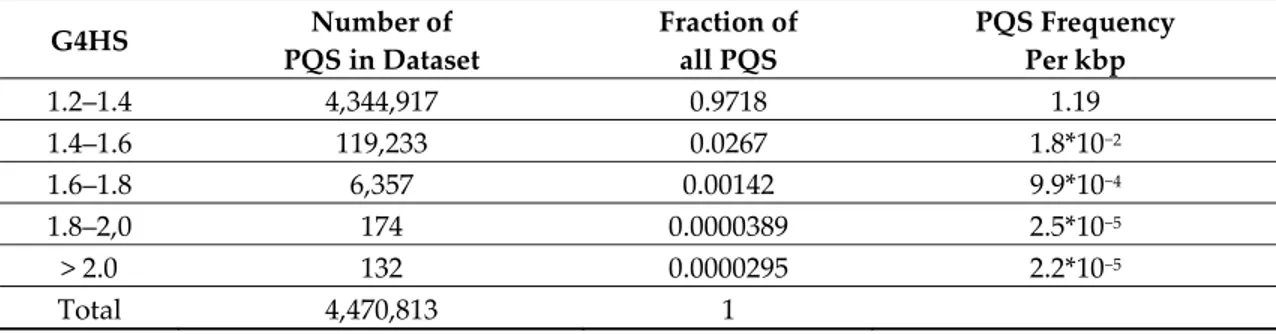
We analyzed the occurrence of putative G4 sequences (PQS) with G4Hunter in 3387 archaeal genomes. The length of sequenced archaeal genomes in our dataset varied from 100 kbps to 13.4 Mbps (list provided in Supplementary Table 1). The average GC content was 46.51%, with a minimum of 24.30% for Nanobsidianus stetteri isolate SCGC AB-777 (Nanoarchaeota) and a maximum of 70.95% for Halobacteriales archaeon SW_7_71_33 (phylum Euryarchaeota). Using standard parameters for the G4Hunter search algorithm (window size of 25 and G4HS ≥ 1.2) we found 4,470,813 PQS in these 3387 archaeal genomes using a default threshold of 1.2. The higher the G4HS score is, the higher the stability of the structure. Over 90% and 98% of sequences with a score above 1.2 or 1.5, respectively, were experimentally demonstrated to form a stable quadruplex in vitro [41]. Figure 3A provides an example of G-rich motifs found in archaea with G4HS between 1.32 and 3.0. As expected from previous analyses on eukaryotes and bacteria, most (97%) PQS have a relatively low (1.2 to 1.4) G4Hunter score. More stable motifs are rarer, with a sharp decrease in the number of retrieved sequences with scores above 1.4, as shown in Table 2. Only 132 PQS with a G4Hunter score of 2 or more were found. A summary of all PQS found in ranges of G4Hunter score intervals and precomputed PQS frequencies per 1000 bp is provided in Table 2.
Figure 3. Examples of sequences with different G-quadruplexes (G4)Hunter scores (G4HS) and
(corresponding to the window size chosen for the analysis) for which G4Hunter scores are provided within parentheses. Isolated guanines are shown in red, all other guanines in bold red characters. Longer archaea motifs with high G4H scores are provided in Table 3. (B) Distribution of G4-prone motifs according to the G4Hunter score. 1.2 means any sequence with a score between 1.2 and 1.399; 1.4 between 1.4 and 1.599, etc. These numbers are normalized by the total number of PQS found in bacteria, archaea, and compared with Homo sapiens. The first category represents 97.9% and 97.2% of all PQS sequences in bacteria and archaea, respectively. Note the log scale on the Y-axis.
Table 2. Number of PQS found and their frequencies per 1000 bp in all 3387 archaeal genomes,
grouped by G4Hunter score (1.2-1.4 means any sequence with a score between 1.2 and 1.399; 1.4 between 1.4 and 1.599, etc.).
G4HS Number of PQS in Dataset Fraction of all PQS PQS Frequency Per kbp 1.2–1.4 4,344,917 0.9718 1.19 1.4–1.6 119,233 0.0267 1.8*10−2 1.6–1.8 6,357 0.00142 9.9*10−4 1.8–2,0 174 0.0000389 2.5*10−5 > 2.0 132 0.0000295 2.2*10−5 Total 4,470,813 1
The comparison of G4 prone sequences found in archaea with bacteria genomes revealed that in both domains, frequencies sharply decreased with G4HS as compared to the human genome, in which highly stable G4s are relatively more frequent (see Figure 3B). This result indicates an overall stronger relative selection pressure against stable G4 motifs in both archaea and bacteria as compared to humans, and likely most eukaryotes, as the relative number of G4Hunter high scoring motifs is even higher in yeast [63]. Guo and Bartel suggested that eukaryotes have robust machinery that globally unfolds RNA G-quadruplexes, whereas some bacteria have instead undergone evolutionary depletion of G-quadruplex-forming sequences [64]. Our analysis suggests that archaea behave like bacteria, except for the slight difference found for the most stable motifs (G4HS >2), which were less selected against in archaea than in bacteria.
3.2. Variation in Frequency for G4 Forming Sequences in Archaea
The total number of analyzed sequences in particular phylogenetic categories, together with a median length of the genome, shortest genome, longest genome, mean, minimal, and maximal observed frequency PQS per kbp, and total PQS counts are shown in Table 3. For this analysis, Archaea have been divided into five superphyla that form monophyletic assemblages (clades) in the most recent phylogenetic analysis and 41 subgroups that correspond to different taxonomic ranks (suffix aeota for phylum, candidate phylum, suffix ales for orders). Seven subgroups have an average GC content above 50%, the highest GC content being observed in Halobacteriales (63.95%), which is also the archaeal group containing the highest number of available genome sequences– 440), all other groups have average GC contents below 50%.
Table 3. Genomic sequences sizes, GC%, total count of PQS, and mean frequencies of quadruplex
motifs. Seq (total number of sequences), Median (median length of sequences), Short. (shortest sequence), Long. (longest sequence), GC % (average GC content), PQS (total number of predicted PQS), Mean f (mean frequency of predicted PQS per 1000 bp), Min f (lowest frequency of predicted PQS per 1000 bp), Max f (highest frequency of predicted PQS per 1000 bp). %PQS corresponds to the probability that any given nucleotide in the group or subgroup belongs to a G4-prone region (G4H > 1.2). Colors correspond to phylogenetic tree depiction.
Kingdom Seq. Median Short Long GC% PQS Mean f Min f Max f % PQS
Archeae 3387 1686930 100212 13399915 46.51 7927775 1.21 0.04 15.31 3.58
Superphylum Seq. Median Short Long GC% PQS Mean f Min f Max f % PQS
BAT 320 1180629 164795 3506105 43.07 421678 1.16 0.05 8.42 3.49 Cren 379 1808184 210860 6451204 43.05 1009660 1.56 0.09 9.44 4.75 Asgard 71 2322715 291515 5684038 38.75 74647 0.47 0.12 1.50 1.39 DPANN 309 832169 100212 6604953 39.22 219058 0.70 0.08 4.20 2.18 Eury 2308 1826841 137797 13399915 48.77 6202732 1.25 0.04 15.31 3.68
Phylum Seq. Median Short Long GC% PQS Mean f Min f Max f % PQS
Bathyarchaeota 128 1208976.5 200493 3506105 46.29 245162 1.54 0.23 8.42 3.00 Thaumarchaeota 192 1173909.5 164795 3441569 40.93 176516 0.91 0.05 5.32 2.73 Thermoproteales 147 1581744 242587 3969448 45.86 513053 2.07 0.11 7.38 6.31 Sulfolobales 118 2223757.5 210860 3034024 38.20 200842 0.79 0.34 4.58 2.38 Desulfurococcales 29 1580347 807477 2148448 46.99 99211 2.29 0.40 6.37 6.95 Verstraetearchaeota 18 1171913.5 419172 1937662 46.76 40586 1.83 0.10 3.43 5.50 Marsarchaeota 15 1915630 351358 3731392 46.72 52853 1.64 0.47 2.94 5.01 Geothermarchaeota 6 1183145.5 803797 1671866 42.72 16582 2.15 0.96 7.03 6.65 Nezhaarchaeota 2 1332140.5 1315707 1348574 43.53 2016 0.76 0.75 0.77 2.27 Korarchaeota 18 1542873 834209 2942065 48.39 68434 2.63 1.05 9.44 7.95 Unclassified Crenarchaeota 27 1203892 301027 6451204 37.01 19361 0.44 0.09 1.49 1.29 Lokiarchaeota 29 1892624 320847 5143417 32.77 25479 0.41 0.21 1.50 1.24 Odinarchaeota 1 1460710 1460710 1460710 38.05 1038 0.71 0.71 0.71 2.16 Thorarchaeota 29 2770204 291515 4389059 46.55 40006 0.60 0.24 1.18 1.76 Heimdallarchaeota 12 2167091 432340 5684038 34.42 8124 0.27 0.12 0.50 0.82 Aenigmarchaeota 35 751672 248182 1410470 39.33 17990 0.71 0.11 3.78 2.12 Nanohaloarchaeota 17 815638 565289 1480846 44.53 8672 0.48 0.09 1.82 1.50 Woesearchaeota 72 966794.5 518295 2944567 40.77 57833 0.66 0.08 3.92 1.96 Pacearchaeota 60 719507 279432 6604953 33.74 37675 0.56 0.08 2.99 1.73 Nanoarchaeota 25 577110 204081 1162239 32.83 9940 0.59 0.13 4.20 1.70 Micrarchaeota 39 887931 658716 1333875 50.41 42298 1.17 0.15 2.86 3.47 Diapherotrites 19 568419 302064 1130899 37.42 6077 0.49 0.11 2.33 1.46 Unclassified DPANN 40 858043.5 100212 3188023 35.57 33846 0.67 0.15 2.39 2.04 Hadesarchaeota 12 857575 451393 1241441 53.77 56369 4.61 1.26 15.31 14.55 Persephonarchaeota 33 637942 137797 1412535 44.06 34905 1.49 0.59 2.36 4.49 Thermococcales 60 1867904.5 207909 2388527 46.77 191492 1.72 0.47 7.53 5.15 Theinoarchaeota 2 4165806 3559548 4772064 41.57 5480 0.66 0.65 0.67 1.94 Methanofastidiosa 96 992372 156656 13399915 40.71 141192 0.83 0.08 3.64 2.54 Methanococcales 24 1717483 1207361 1936387 32.01 15065 0.39 0.20 0.86 1.19 Methanobacteriales 224 2001036 1157521 3466370 33.62 175191 0.39 0.04 2.32 1.14 Methanopyrales 3 1430309 1421621 1694969 58.94 10798 2.34 1.97 3.00 6.84 Methanomassilicoccales 91 1404109 640223 2641216 56.22 257340 1.85 0.22 4.41 5.38 Thermoplasmatales 135 1621237 593453 2816557 42.71 246832 1.13 0.11 7.03 3.42 Acidoprofondum/DHV2-2 11 1731076 519420 2981805 40.55 16609 1.21 0.29 4.12 3.59 Archaeoglobales 53 1901943 478535 3408041 42.98 117470 1.22 0.57 3.29 3.66 Methanosarcinales 279 2913215 208261 5751492 44.99 845394 1.19 0.15 7.52 3.54 Methanomicrobiales 146 2228967.5 622799 3978804 54.97 783172 2.38 0.23 7.20 7.07 Methanocellales 5 2957635 1465272 3243770 50.96 16825 1.21 0.41 1.88 3.51 Halobacteriales 440 3585981 397623 5605381 63.95 2271600 1.56 0.08 4.25 4.50 Unclassified Diaforarchaea 97 1460542 233168 2294894 47.38 136115 1.03 0.18 2.55 3.02 Unclassified other 597 1400198 258312 7416915 46.88 862962 1.02 0.07 5.16 3.00
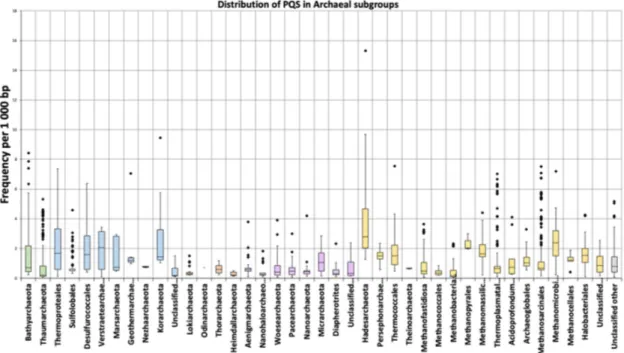
The mean frequency of PQS per kbp for all archaeal genomes was 1.207. The lowest mean frequency was for the Heimdallarchaeota (0.273), followed by Methanococcales and Methanobacteriales (0.39). The highest density of PQS was found in the Hadesarchaea subgroup (4.607), followed by
Korarchaeota (2.626). The highest absolute frequency of PQS was found in Hadesarchaea archaeon isolate
WYZ-LMO6 with 15.3 PQS per 1000bp (i.e., one quadruplex every 65 bp), and the lowest frequency was found in Methanobrevibacter sp. 87.7: Interestingly, only 71 PQS were found in its 1.92 Mb long genome (Supplementary Table S2A). Detailed statistical characteristics for PQS frequencies per kbp (including mean, variance, outliers) are depicted in boxplots for all inspected subgroups (Figure 4). The Hadesarchaea subgroup has a higher PQS frequency in comparison to other subgroups. The comparison of the five main superphyla BAT, Cren, Asgard, Eury, and DPANN (Diapherotrites,
Parvarchaeota, Aenigmarchaeota, Nanoarchaeota, and Nanohaloarchaeota) (Figure 1) revealed the highest
mean PQS frequency in Cren superphylum (1.15) and the lowest in Asgard superphylum (0.48). However, the Hadesarchaea subgroup, which exhibits the highest frequency among subgroups, is
found in the Eury superphylum. The detailed data for superphyla are in Supplementary Table S2B, for subgroups in Supplementary Table S2C.
Figure 4. Frequencies of PQS in subgroups of analyzed archaeal genomes. Data within boxes span the
interquartile range, and whiskers show the lowest and highest values within 1.5 interquartile range. Black points denote outliers. Horizontal black lines inside boxplots are median values.
A cluster dendrogram shows the similarities among subgroups based on the PQS data (Figure 5). This dendrogram shows that the Hadesarchaeota subgroup is the most distant one (the shortest branch length) compare to other subgroups. The cluster dendrogram based on PQS characteristics is similar to the phylogenetic relationships (see Figure 1). For example, all of the Asgard subgroups (Odinarchaeota, Heimdallarchaeota, Thorarchaeota, and Lokiarchaeota) lie close together, in one bigger cluster (Figure 5, left part). Other examples are the Woesearchaeota, Aenigmarchaeota, and Nanoarchaeota subgroups, which are members of the DPANN superphylum, and lie adjacent to each other in PQS based cluster tree. On the other hand, all of the subgroups with the prefix “-thermo”, indicative of high-temperature environments, are clustered together (Thermoplasmatales, Thermococcales,
Thermoproteales, and Geothermarchaeota). These subgroups are relatively PQS rich, but lack
Figure 5. Cluster dendrogram of PQS characteristics of archaeal subgroups. Cluster dendrogram of
PQS characteristics (Supplementary Table S4) was made in R v. 3.6.3 (code provided in Supplementary Table S4) using pvclust package with these parameters: Cluster method ‘ward.D2′, distance ‘euclidean’, number of bootstrap resamplings was 10,000. AU values are in blue and indicate the statistical significance of particular branching (values above 95 are equivalent to p-values lesser than 0.05). Statistically significant clusters are highlighted by red dashed rectangles.
We then analyzed the relationship between overall %GC content and PQS frequency (Figure 6). PQS frequencies tend to correlate with GC content as G4-prone motifs need to be relatively G-rich; however, there are interesting exceptions to this rule, and this correlation is poorer than anticipated. Ding et al. already noticed that Methanomicrobia and Thermococci have greater densities of PQS than the theoretical values based on the GC% of their genomes [35]. Organisms with higher than expected PQS frequencies based on their GC content (over 50% of the maximal observed PQS frequency, Figure 6) are highlighted in color; the whole figure is separated into smaller segments according to inspected G4Hunter score intervals. The most extreme outlier is Hadesarchaea archaeon, for which 51% of its genome has a G4Hunter score above 1.2, despite a GC content of 54%, i.e., only modestly above the 46.5% average for all sequences tested here, and far below the most GC rich archaea genomes. Cherry-picked examples of G-rich motifs with high G4 Hunter scores (G4HS) in Hadesarchaea archaeon are provided in Table 4. We have also carried out additional statistical evaluation of PQS differences between all groups and subgroups; detailed results are found in Supplementary Table S5. Nearly all comparisons were significant, i.e., there are significant differences between PQS frequencies of particular groups and subgroups.
Figure 6. Relationship between the observed frequency of PQS per 1000 bp and GC content. Different
G4Hunter score intervals are considered. In each G4Hunter score interval miniplot, frequencies were normalized according to the highest observed frequency of PQS. Organisms with max. frequency per 1000 bp greater than 50% are described and highlighted in color.
Table 4. Long G4-prone motifs with high G4HS found in Hadesarchea archeon.
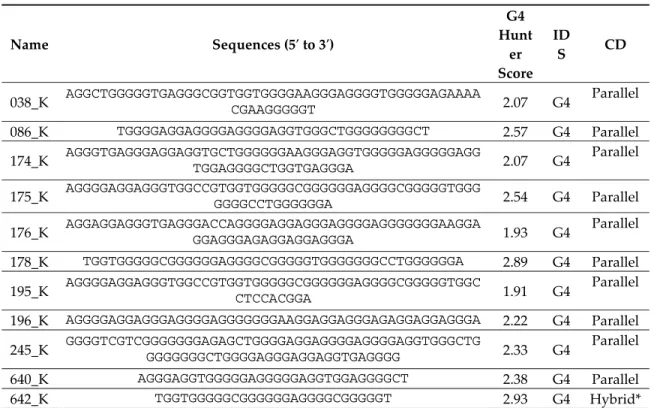
Name Sequences (5′ to 3′) G4 Hunt er Score ID S CD
038_K AGGCTGGGGGTGAGGGCGGTGGTGGGGAAGGGAGGGGTGGGGGAGAAAACGAAGGGGGT 2.07 G4 Parallel
086_K TGGGGAGGAGGGGAGGGGAGGTGGGCTGGGGGGGGCT 2.57 G4 Parallel
174_K AGGGTGAGGGAGGAGGTGCTGGGGGGAAGGGAGGTGGGGGAGGGGGAGGTGGAGGGGCTGGTGAGGGA 2.07 G4 Parallel
175_K AGGGGAGGAGGGTGGCCGTGGTGGGGGCGGGGGGAGGGGCGGGGGTGGGGGGGCCTGGGGGGA 2.54 G4 Parallel
176_K AGGAGGAGGGTGAGGGACCAGGGGAGGAGGGAGGGGAGGGGGGGAAGGAGGAGGGAGAGGAGGAGGGA 1.93 G4 Parallel
178_K TGGTGGGGGCGGGGGGAGGGGCGGGGGTGGGGGGGCCTGGGGGGA 2.89 G4 Parallel
195_K AGGGGAGGAGGGTGGCCGTGGTGGGGGCGGGGGGAGGGGCGGGGGTGGCCTCCACGGA 1.91 G4 Parallel
196_K AGGGGAGGAGGGAGGGGAGGGGGGGAAGGAGGAGGGAGAGGAGGAGGGA 2.22 G4 Parallel 245_K GGGGTCGTCGGGGGGGAGAGCTGGGGAGGAGGGGAGGGGAGGTGGGCTGGGGGGGGCTGGGGAGGGAGGAGGTGAGGGG 2.33 G4 Parallel
640_K AGGGAGGTGGGGGAGGGGGAGGTGGAGGGGCT 2.38 G4 Parallel
643_K AGGCTGGGGGTGAGGGCGGTGGTGGGGAAGGGAGGGGTGGGGGAGAAAACGAAGGGGGT 2.07 G4 Parallel
644_K AGGGCGGTGGTGGGGAAGGGAGGGGTGGGGGA 2.41 G4 Parallel
645_K GGCGGGGGGGGAGTCCTTCATCCTGGGGTAGGGG 1.74 G4 Parallel
* Sequence 642_K adopts a hybrid structure at room temperature, which is converted to a parallel conformation at high temperatures.
Figure 7 shows the relationship between GC percentage and mean PQS frequencies (or mean percentage of PQS length of the genome) in particular archaeal subgroups. Overall, we found some correlation (although far from perfect, as shown by R2=0.7) between mean PQS frequencies (expressed
as the mean fraction of nucleotides of the genomes involved a PQS motif) and increasing GC% content. The highest mean percentage of PQS length of the genomes was found in subgroup
Hadesarchaea, in which more than 10% of their genomes are involved in a potential PQS.
Figure 7. Relationship between GC percentage and % of PQS in genomes of particular archaeal
subgroups. The Fitted equation with the R2 coefficient is depicted on the top side of the plot.
3.3. Localization of PQS in Genomes
To evaluate the position of PQS in archaeal genomes, we downloaded the described “features” of all archaeal genomes and analyzed the presence of all PQS in annotated sequences (Figure 8). Overall, we find a higher density of G4-prone motifs in non-protein coding RNAs (tRNA, rRNA, and other ncRNA) than in protein-coding genes. G4 density in ncRNA is clearly above average genomic G4 density, while mRNA G4 density is close to the genomic average. This may derive in part from the observation that rRNA and tRNA genes are especially GC-rich in hyperthermophilic archaea, in order to stabilize folding under harsh conditions [65]. On the other hand, we can probably expect a stronger selection pressure against the formation of intramolecular quadruplexes within the relatively small tRNA core, as this would disrupt its three-dimensional shape and alter its biological function. In line with this hypothesis, the PQS frequencies are actually lower in tRNA than in ncRNA and rRNA [66]. Interestingly, the 5′ end of some human tRNA genes is often G-rich and has been reported to allow G4 formation: Ivanov and colleagues have shown that mature cytoplasmic tRNAs are cleaved during stress response to produce tRNA fragments that function to repress translation in vivo and that these bioactive tRNA fragments assemble into intermolecular RNA G4s [67]. The 5′
fragment of tRNAAla involves a predominant hairpin structure that starts with the 5′-GGGGGU motif,
allowing the formation of tetramolecular quadruplex structures with five tetrad layers. Interestingly, tRNA-derived fragments have also been described in archaea. For example, a 26-residue-long fragment (5′ GGGUUGGUGGUCUAGUCUGGUUAUGA) originating from the 5′ part of valine tRNA is the most abundant tRNA fragment in Haloferax volcanii [68]. This fragment, while exhibiting a relatively G-rich 5′ end (starting with GGGUUGG), may, in principle, allow intermolecular quadruplex formation as well.
Figure 8. Differences in PQS frequency by DNA locus. The chart shows PQS frequencies normalized
per 1000 bp annotated locations from the NCBI database and shows a comparison between Archaea and Bacteria. Archaea G4-prone motifs are strongly over-represented in ncRNA and rRNA compared to the average G4 density in Archaea (mean f = 1.207), but also compared to bacteria. PQS count is provided in Supplementary Table S3 Excel file.
Unfortunately, other features in archaeal genomes are so poorly annotated that we cannot use these data for evaluation. Comparison of PQS frequencies in annotated sequences with analyses of Bacteria shows the same trend for ncRNA, rRNA, protein-coding gene, and tRNA features. In contrast, the frequency in bacteria for ncRNA is 1.7 per kbp, and the frequency in archaea for ncRNA is 5.3 per kbp. On the other hand, the PQS frequency in repeat regions is lower in archaea than in the bacteria genome. We have to take into account that the data could be influenced by poor annotation in archaea genomes, and also by a low number of annotated sequences in Archaea; only 141 representative archaeal genomes are annotated, compared to 1627 representative bacteria annotated genomes. The strong abundance of the PQS in ncRNA compare to other locations pointing to its functional relevance. ncRNAs are present in the cells as single-stranded molecules in contrast to DNA, and therefore, they can easily adopt the G4 structures as a part of their 3D arrangement similarly to mRNAs [69,70]. It has been shown that ncRNAs play important roles in many cellular processes, including the regulation of gene transcription, post-transcriptional, and epigenetic regulations [71,72].
Other specific regions, such as replication origins or promoter regions, were not included in this graph. The oriC 10.0 database (http://tubic.org/doric/public/index.php) contains 226 archaeal origins of replication obtained by both in vitro studies and in silico predictions ([73]), prediction and experimental data are available for the Thermococcales [74,75], the Haloarchaea, and the Sulfolobales [76]. Archaeal replicators, as in bacteria, are composed of three main elements: A cluster of binding sites for the initiator Cdc6, the DNA unwinding element (DUE), and binding sites for regulatory proteins [75]. Interestingly, it was found in several Haloarchaea species that a specific (TGGGGGGG) motif occurs in one of the two origins of replication (oriC1) [77]. This long G-rich motif was shown to be
necessary for efficient replication initiation in Haloarcula hispanica [78,79] and predicted to be prone to inter-molecular quadruplex formation.
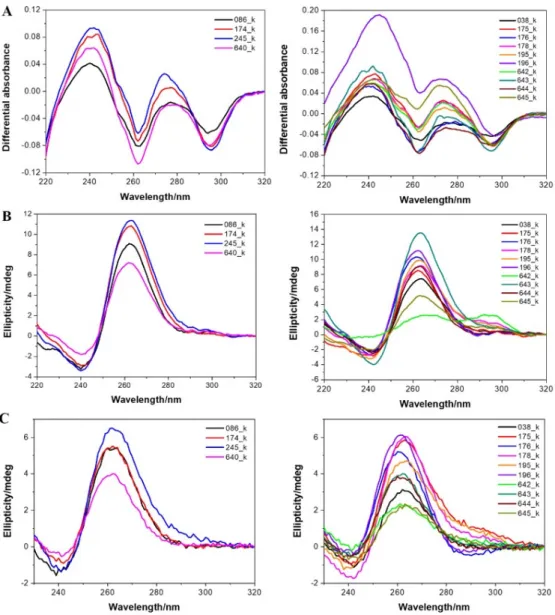
3.4. Experimental Demonstration of Quadruplex Formation In Vitro.
Next, we selected a few DNA G4-prone motifs found in Hadesarchaea and experimentally tested if they formed a G4 structure under classical conditions. As inferred from isothermal difference spectra (IDS) (Figure 9a) and circular dichroism (CD) spectra (Figure 9b), all motifs clearly formed G-quadruplexes at room temperature. However, as these motifs are found in an archeon expected to live at a high temperature, we also recorded the spectra at 80 °C. As shown in Figure 9c, these quadruplexes were thermally stable and still formed at high temperatures. Of note, most spectra are indicative of a parallel fold. This bias is the result of a high threshold for G4Hunter (all motifs have scores > 1.7). As a consequence, these motifs are very G-rich, with runs of G separated by short spacers, often 1–2 nt. As short loops tend to be propeller-type, this sequence bias will favor a parallel conformation.
Figure 9. Experimental evidence for quadruplex formation with archaea sequences. Isothermal
differential absorbance (IDS; panel A) and circular dichroism (CD; panels B and C) spectra of
Hadesarchaea archeon DNA sequences were recorded at 20 °C (panels A and B) or at a high temperature
3.5. G4-Binding Proteins from Archaea.
Given that G4-prone motifs are found in Archaea, and actually extremely abundant in some subgroups, it was interesting to check if potential helicases are present to solve these structures. A number of DNA and RNA G4-helicases have been identified in eukaryotes, e.g., Pif1, DOG, Rhau/DHX36, WRN, BLM; for a review [80]. Little or no experimental data is currently available on archaea enzymes able to unfold G-quadruplexes. As RecQ has been reported to unfold G4 structures in bacteria, we searched for RecQ homologs in Archaea. A BLASTp search using RecQ (UNIPROT ID: P15043) from E. coli as a query revealed 1206 homologous protein sequences in a archaeal domain with an E-value cut-off = 0.0001. A listing of all candidates identified is presented in supplementary information (Supplementary Table S6). Five proteins have an identity with G-quadruplex RecQ resolvase higher than 50%, and 312 proteins have more than 50% aa positives hits in the sequence, suggesting that they share the G4 unfolding functionality in archaea genomes. Besides protein actively unfolding G4 structures, other peptides may actually bind to single-strand G-rich sequences and passively contribute to G4 unfolding by conformational selection. This is the case for a single-strand binding protein isolated from Methanococcus jannaschii, which was used to design an assay to detect G4 formation [79]. Apart from proteins that actively or passively unfold quadruplexes, others may bind to and sometimes promote G4 formation. The amino acid composition of 77 G-quadruplex binding proteins from Homo sapiens revealed unique features of quadruplex binding proteins, with prominent enrichment for glycine (G) and arginine I [31]. Human-binding proteins share a 20 amino acid long motif/domain (RGRGR GRGGG SGGSG GRGRG), which is similar to the previously described RG-rich domain of the FMR1 G-quadruplex binding protein. The search for this 20 amino acid-long motif in archaea proteome found 23 hits/potential G-quadruplex binding proteins with an E-value threshold of 0.05; the identity was found, e.g., for RNA DEAD box helicase or for two 30S ribosomal proteins S4 (Supplementary Table S6, list 2). We searched protein sequences in the proteome of the mesophylic archaeon Methanosarcina mazei (for which the largest amount of proteins is known) for the presence of this motif. For highly significant p values (p < 10−6), we found four
proteins with a potential quadruplex-binding motif (Supplementary Table S7), while significantly
more (193) hits were found for p-values < 1x10⁻⁵. Three of them are without any known function
(DUF134 domain-containing protein, PGF-pre-PGF domain-containing protein, and DUF5320 domain-containing protein). Even if the full proteome of Hadesarchaea archaeon is not known, it is interesting to note that this RG-domain is present in a number of putative proteins. In addition, while a true RecQ homolog was not found, one Hadesarchaea archaon 600aa-polypeptide has a good similarity with RecQ in its N-terminal half (Supplementary Table S8). The presence of the NIQI motif in the “DNA-directed RNA polymerase subunit” is also interesting and possibly logical, given the necessity of unraveling G-quadruplexes during transcription. The presence in archaeal genomes of potential G4-binding and G4-unfolding proteins supports the formation of quadruplex structures in archaeal cells.
4. Discussion
We provide here the first comprehensive study of PQS occurrences, frequencies, and distributions in archaeal genomes. The overall analysis made on global frequency hides extreme differences between species and subgroups, which can be explained by differences in GC content and possibly codon usage.
At one end of the G4 spectrum, some subgroups of archaea, such as Parvarchaeota or
Heimdallarchaeota, have very low PQS frequencies, and PQS cover 1% or less of their genomes. In
sharp contrast, we found an unprecedented enrichment of PQS for some subgroups, often living under extreme conditions. For example, over 50% of the genome of Hadesarchaea archaeon may potentially adopt a quadruplex fold. This Hadesarchaea is living under extreme conditions, as it was found in South African gold mines 3 km underground, without light and oxygen (Hades is the Greek god of the underworld). Following this analysis, we used the BioSample NCBI database [78] to compare the living environment of the archaea organisms with the highest PQS frequencies. Data for all genomes with PQS frequency above 6 per kbp are shown in Table 5. A majority of organisms with
extremely high PQS frequencies are found in hot springs sediments or in deep-sea hydrothermal vent sediments, and this high PQS frequency may be associated with their extremophilic life, although more work will be necessary to compare G4 density in acidophilic, thermophilic, halophilic and psychrophilic organisms. For example, in bacteria, in the Gram-positive subgroup
Deinococcus-Thermus, a high PQS frequency was associated with their extremophilic origin [35,81], while the
gram-negative extremophilic bacteria subgroup Thermotogae are among organisms with a low PQS frequency [33]. We suggest that the high stability of G4 structures compare to dsDNA structure could play important roles in archaea and Gram-positive extremophiles organisms. We then experimentally confirmed G4 formation with a few archaea sequences to confirm that our in silico predictions are verified: All predicted experimentally tested formed stable G-quadruplexes in vitro. This absence of false positives is hardly surprising given that we chose high scoring motifs. From our published [41] and unpublished data on now over 500 sequences, false positives for sequences with scores above 1.5 are extremely rare (<1.5%), and we have yet to find a false positive with a score > 1.75.Some of the sequences considered were long and may even allow the formation of two juxtaposed G4 structures. In a few cases, we can even propose a topology, as for example, TGGTGGGGGCGGGGGGAGGGGCGGGGGT (642K), in which the predicted guanine tracks (underlined) may either be: TGGTGGGGGCGGGGGGAGGGGCGGGGGT or TGGTGGGGGCGGGGGGAGGGGCGGGGGT, and different folds may result from these possibilities (the latter would be likely parallel, as experimentally observed at 80 °C, while the former may adopt a non-parallel fold, as observed at room temperature). Note, however, that G4 hunter does not make any hypothesis on the G tracts involved in G4 formation, in contrast with Quadparser, for example, where one actively seeks the four runs of G involved in G-quartet formation. G4 formation is (still) full of surprises, and correctly predicting which runs (or individual guanines) participate in G-quartet formation is far from trivial and requires extensive experimental validation.
The extreme enrichment found in some archaea challenges our existing views on “noncanonical” DNA structures to which G-quadruplexes belong, as it is plausible that a substantial part of the
Hadesarchaea genome may be packed into G-quadruplex structures. The complementary C-rich strand
may also fold into a different quadruplex structure called the i-motif [82] that is favored by acidic pH. Further studies will be dedicated to i-DNA formation in Archaea.
Table 5. Detailed characteristics of archaeal species with PQS frequency per 1000 bp greater than 6.00.
Living environments data were obtained from the BioSample NCBI database [83].
Organism name GC Content PQS f % PQS Living Environment (Isolated from) Hadesarchaea archaeon isolate WYZ-LMO6 65.01 15.310 51.15
Hot springs sediment, Yellowstone NP, USA
Hadesarchaea archaeon
isolate WYZ-LMO4 56.17 9.685 31.10
Hot springs sediment, Jinze hot spring, China
Hadesarchaea archaeon
isolate WYZ-LMO5 56.04 9.581 30.69
Hot springs sediment, Jinze hot spring, China
Korarchaeota archaeon
isolate B35_G17 65.01 9.445 28.80
Deep-sea hydrothermal vent sediments, Guaymas Basin, Gulf of California,
Mexico
Bathyarchaeota archaeon
B23 61.78 8.418 26.12
Deep-sea hydrothermal vent sediments, Guaymas Basin, Gulf of California,
Mexico
Bathyarchaeota archaeon
isolate M10_bin139 58.42 7.858 24.55
Deep-sea hydrothermal vent sediments, Guaymas Basin, Gulf of California,
Mexico
Thermococcus celer JCM
8558 57.21 7.534 24.52
Solfataric marine water hole on a beach of Vulcano, Italy
Methanosaeta harundinacea isolate
UBA152
62.01 7.518 23.12 Waste water, Suncor tailings pond 6,
Canada
Bathyarchaeota archaeon
isolate B23_G15 57.67 7.397 22.90
Deep-sea hydrothermal vent sediments, Guaymas Basin, Gulf of California,
Mexico
Thermocladium modestius
JCM 10088 53.14 7.381 25.59
Mud from a spring pool, Noji-onsen, Fukushima, Japan
Methanoculleus
chikugoensis JCM 10825 62.36 7.198 22.90
Paddy field soil, Chikugo, Fukuoka, Japan
Methanosaeta harundinacea isolate
UBA281
61.14 7.089 21.80 Wastewater, North Alberta, Canada
Geothermarchaeota
archaeon ex4572_27 60.54 7.032 22.01
Deep-sea hydrothermal vent sediments, Guaymas Basin, Gulf of California,
Mexico
Thermoplasmata archaeon
isolate CSSed11_322R1 61.82 7.028 22.57
Hypersaline soda lake sediment, Kulunda Steppe, Russia
Methanosarcinales
archaeon Methan_02 60.8 6.738 20.67
Anaerobic digester metagenome, Australia
Methanosaeta
harundinacea 6Ac 60.6 6.721 20.66
isolated from an upflow anaerobic sludge blanket reactor treating beer-manufacture wastewater in Beijing,
China. (ref PMID:16403877)
Thermoplasmatales
archaeon ex4484_36 54.25 6.673 21.15
Deep-sea hydrothermal vent sediments, Guaymas Basin, Gulf of California,
Mexico
Aeropyrum camini SY1 =
JCM 12091 56.73 6.370 19.72
Deep-sea hydrothermal vent chimney, the Suiyo Seamount in the Izu-Bonin
Arc, Japan
Bathyarchaeota archaeon
isolate B46_G17 61.92 6.332 19.03
Deep-sea hydrothermal vent sediments, Guaymas Basin, Gulf of California,
Mexico
Thermoplasmata archaeon
isolate B14_G15 53.83 6.327 20.11
Deep-sea hydrothermal vent sediments, Guaymas Basin, Gulf of California,
Mexico
Thermoplasmata archaeon
isolate B23_G1 53.66 6.240 19.72
Deep-sea hydrothermal vent sediments, Guaymas Basin, Gulf of California,
Mexico
Pyrobaculum
neutrophilum V24Sta 59.91 6.233 19.52 isolated from a hot spring in Iceland Thermoplasmata archaeon
isolate B23_G9 52.98 6.164 19.65
Deep-sea hydrothermal vent sediments, Guaymas Basin, Gulf of California,
Mexico
Hadesarchaea archaeon isolates WYZ-LMO4, WYZ-LMO5, WYZ-LMO6 are archaeal species
isolated from hydrothermal spring sediments. Besides high temperatures, often above 50 °C, these ecological niches usually have high salinity. Interestingly, most G-quadruplexes withstand high temperatures (their melting point is often above 70 °C) and are further stabilized by positively charged ions such a K+ and Na+ [84,85]. Such conditions may have naturally favored G-quadruplexes
more frequent (Figure 5). In addition, all hyperthermophilic organism genomes encode a reverse gyrase, which positively supercoil DNA, possibly to protect the genome [86]. In future studies, it would be very interesting to carry out a genome-wide wet-lab experiment, for example, direct DNA sequencing of G-quadruplex loci as described in [87,88] or direct visualization of G-quadruplexes in living cells using specific antibodies, such as BG4 [89].
5. Conclusions
Overall, our results indicate that archaea are, like eukaryotes and bacteria, prone to G-quadruplex formation: G-G-quadruplexes are here, there, and everywhere! Important differences in G4 densities were found among species, and experimental validation was obtained in vitro for a few candidate sequences. Follow-up studies may check if specific archaeal PQS loci—for example, in important genes, show some phylogenetic conservation. If confirmed, this could serve as a new (additional) phylogenetic marker and give us some extended clues about the evolution and function of G-quadruplex forming sequences in Archaea. This study will stimulate further studies on G4 presence in Archaea, and help to establish whether some regulatory mechanisms may only apply to a given domain or be truly universal.
Supplementary Materials: The following are available online at www.mdpi.com/xxx/s1/ Table S1: The accession
codes and phylogenetic classification of all archaeal genomic DNA sequences, Table S2: Overall results of PQS frequencies found in each analyzed genomic sequence (all (A), superphylum (B) or phylum (C)) together with GC content, sequence length and other parameters, Table S3: Feature counts, Table S4: PQS characteristics used for the dendrogram shown in Figure 6, Table S5: Statistical evaluation, Table S6: BLASTp search for RecQ and NIQI in Archaea, Table S7: FIMO search for putative quadruplex binding motif, Table S8: The most similar protein of RecQ (E. coli) in Hadesarchaea archaeon.
Author Contributions: Conceptualization, V.B. and J.L.M.; methodology, P.K.; software, O.P., J.Š., and P.P.;
validation,; V.B., P.K. and M.B.; formal analysis, M.B.; resources, M.B., P.F., V.D.C.; data curation, V.B., M.B., P.F., V.D.C., J.L.M..; Experimental validation, Y.L., D.V.; writing—original draft preparation, V.B., M.F. and J.L.M.; writing—review and editing, P.P. H.M., T.S.T., P.F., H.M., V.D.C., J.L.M.; visualization, V.B., J.L.M.; supervision, V.B., J.L.M.; project administration, V.B., M.F.; funding acquisition, V.B., M.F., J.L.M. All authors have read and agreed to the published version of the manuscript.
Funding: This work was funded by the Czech Science Foundation (18-15548S) and by the SYMBIT project Reg.
no. CZ.02.1.01/0.0/0.0/15_003/0000477 financed from the ERDF.
Conflicts of Interest: The authors declare no conflict of interest. The funders had no role in the design of the
study; in the collection, analyses, or interpretation of data; in the writing of the manuscript, or in the decision to publish the results.
References
1. Woese, C.R.; Fox, G.E. Phylogenetic structure of the prokaryotic domain: The primary kingdoms. Proc. Natl.
Sci. Acad. USA 1977, 74, 5088–5090.
2. Olsen, G.J.; Woese, C.R. Archaeal genomics: An overview. Cell 1997, 89, 991–994, doi:10.1016/s0092-8674(00)80284-6.
3. Forterre, P. Archaea: What can we learn from their sequences? Curr. Opin. Genet. Dev. 1997, 7, 764–770, doi:10.1016/s0959-437x(97)80038-x.
4. Grüber, G.; Manimekalai, M.S.S.; Mayer, F.; Müller, V. ATP synthases from archaea: The beauty of a molecular motor. Biochim. Biophys. Acta 2014, 1837, 940–952, doi:10.1016/j.bbabio.2014.03.004.
5. Bolhuis, A. The archaeal Sec-dependent protein translocation pathway. Philos. Trans. R. Soc. Lond. B Biol.
Sci. 2004, 359, 919–927, doi:10.1098/rstb.2003.1461.
6. Samson, R.Y.; Dobro, M.J.; Jensen, G.J.; Bell, S.D. The Structure, Function and Roles of the Archaeal ESCRT Apparatus. Subcell. Biochem. 2017, 84, 357–377, doi:10.1007/978-3-319-53047-5_12.
7. Spang, A.; Eme, L.; Saw, J.H.; Caceres, E.F.; Zaremba-Niedzwiedzka, K.; Lombard, J.; Guy, L.; Ettema, T.J.G. Asgard archaea are the closest prokaryotic relatives of eukaryotes. PLoS Genet. 2018, 14, e1007080, doi:10.1371/journal.pgen.1007080.
8. Da Cunha, V.; Gaia, M.; Nasir, A.; Forterre, P. Asgard archaea do not close the debate about the universal tree of life topology. PLoS Genet. 2018, 14, e1007215, doi:10.1371/journal.pgen.1007215.
9. Adam, P.S.; Borrel, G.; Brochier-Armanet, C.; Gribaldo, S. The growing tree of Archaea: New perspectives on their diversity, evolution and ecology. ISME J. 2017, 11, 2407.
10. Spang, A.; Caceres, E.F.; Ettema, T.J.G. Genomic exploration of the diversity, ecology, and evolution of the archaeal domain of life. Science 2017, 357, doi:10.1126/science.aaf3883.
11. Pennisi, E. Survey of archaea in the body reveals other microbial guests. Science 2017, 358, 983, doi:10.1126/science.358.6366.983.
12. Chaudhary, P.P.; Conway, P.L.; Schlundt, J. Methanogens in humans: Potentially beneficial or harmful for health. Appl. Microbiol. Biotechnol. 2018, 102, 3095–3104, doi:10.1007/s00253-018-8871-2.
13. Vuillemin, A.; Wankel, S.D.; Coskun, Ö.K.; Magritsch, T.; Vargas, S.; Estes, E.R.; Spivack, A.J.; Smith, D.C.; Pockalny, R.; Murray, R.W. Archaea dominate oxic subseafloor communities over multimillion-year time scales. Sci. Adv. 2019, 5, eaaw4108.
14. Jain, S.; Caforio, A.; Driessen, A.J.M. Biosynthesis of archaeal membrane ether lipids. Front. Microbiol. 2014,
5, 641, doi:10.3389/fmicb.2014.00641.
15. Nobu, M.K.; Narihiro, T.; Kuroda, K.; Mei, R.; Liu, W.-T. Chasing the elusive Euryarchaeota class WSA2: Genomes reveal a uniquely fastidious methyl-reducing methanogen. ISME J. 2016, 10, 2478–2487, doi:10.1038/ismej.2016.33.
16. Aouad, M.; Borrel, G.; Brochier-Armanet, C.; Gribaldo, S. Evolutionary placement of Methanonatronarchaeia. Nat. Microbiol. 2019, 4, 558–559, doi:10.1038/s41564-019-0359-z.
17. Forterre, P. The universal tree of life: An update. Front. Microbiol. 2015, 6, doi:10.3389/fmicb.2015.00717. 18. Dombrowski, N.; Lee, J.-H.; Williams, T.A.; Offre, P.; Spang, A. Genomic diversity, lifestyles and
evolutionary origins of DPANN archaea. FEMS Microbiol. Lett. 2019, 366, fnz008.
19. Gaia, M.; Forterre, P. The Tree of Life. In Molecular Mechanisms of Microbial Evolution (Grand Challenges in
Biology and Biotechnology); Rampelotto, P.H., Ed.; Springer: New York City, NY, USA, 2018.
20. Sun, Z.-Y.; Wang, X.-N.; Cheng, S.-Q.; Su, X.-X.; Ou, T.-M. Developing Novel G-Quadruplex Ligands: From Interaction with Nucleic Acids to Interfering with Nucleic Acid–Protein Interaction. Molecules 2019, 24, doi:10.3390/molecules24030396.
21. Harkness, R.W.; Mittermaier, A.K. G-quadruplex dynamics. BBA Proteins Proteomics 2017, 1865, 1544–1554, doi:10.1016/j.bbapap.2017.06.012.
22. Siddiqui-Jain, A.; Grand, C.L.; Bearss, D.J.; Hurley, L.H. Direct evidence for a G-quadruplex in a promoter region and its targeting with a small molecule to repress c-MYC transcription. Proc. Natl. Acad. Sci. USA
2002, 99, 11593–11598, doi:10.1073/pnas.182256799.
23. Lee, S.C.; Zhang, J.; Strom, J.; Yang, D.; Dinh, T.N.; Kappeler, K.; Chen, Q.M. G-Quadruplex in the NRF2 mRNA 5′ Untranslated Region Regulates De Novo NRF2 Protein Translation under Oxidative Stress. Mol.
Cell. Biol. 2016, 37, doi:10.1128/MCB.00122–16.
24. Crenshaw, E.; Leung, B.P.; Kwok, C.K.; Sharoni, M.; Olson, K.; Sebastian, N.P.; Ansaloni, S.; Schweitzer-Stenner, R.; Akins, M.R.; Bevilacqua, P.C.; et al. Amyloid Precursor Protein Translation is Regulated by a 3’UTR Guanine Quadruplex. PLoS ONE 2015, 10, doi:10.1371/journal.pone.0143160.
25. Gage, H.L.; Merrick, C.J. Conserved associations between G-quadruplex-forming DNA motifs and virulence gene families in malaria parasites. BMC Genomics 2020, 21, 236, doi:10.1186/s12864-020-6625-x. 26. Gazanion, E.; Lacroix, L.; Alberti, P.; Gurung, P.; Wein, S.; Cheng, M.; Mergny, J.; Gomes, A.; Lopez-Rubio,
J. Genome wide distribution of G-quadruplexes and their impact on gene expression in malaria parasites.
PLoS Genetics 2020, doi:10.1371/journal.pgen.1008917.
27. Cahoon, L.A.; Seifert, H.S. An alternative DNA structure is necessary for pilin antigenic variation in Neisseria gonorrhoeae. Science 2009, 325, 764–767.
28. Thakur, R.S.; Desingu, A.; Basavaraju, S.; Subramanya, S.; Rao, D.N.; Nagaraju, G. Mycobacterium tuberculosis DinG is a structure-specific helicase that unwinds G4 DNA implications for targeting g4 dna as a novel therapeutic approach. J. Biol. 2014, 289, 25112–25136.
29. Mishra, S.K.; Shankar, U.; Jain, N.; Sikri, K.; Tyagi, J.S.; Sharma, T.K.; Mergny, J.-L.; Kumar, A. Characterization of G-Quadruplex Motifs in espB, espK, and cyp51 Genes of Mycobacterium tuberculosis as Potential Drug Targets. Mol. Ther. Nucleic. Acids 2019, 16, 698–706.
30. Brazda, V.; Haronikova, L.; Liao, J.C.; Fojta, M. DNA and RNA Quadruplex-Binding Proteins. Int. J. Mol.
31. Brázda, V.; Červeň, J.; Bartas, M.; Mikysková, N.; Coufal, J.; Pečinka, P.; Brázda, V.; Červeň, J.; Bartas, M.; Mikysková, N.; et al. The Amino Acid Composition of Quadruplex Binding Proteins Reveals a Shared Motif and Predicts New Potential Quadruplex Interactors. Molecules 2018, 23, 2341,
doi:10.3390/molecules23092341.
32. Ribeyre, C.; Lopes, J.; Boulé, J.-B.; Piazza, A.; Guédin, A.; Zakian, V.A.; Mergny, J.-L.; Nicolas, A. The yeast Pif1 helicase prevents genomic instability caused by G-quadruplex-forming CEB1 sequences in vivo. PLoS
Genet. 2009, 5, e1000475.
33. Bartas, M.; Čutová, M.; Brázda, V.; Kaura, P.; Šťastný, J.; Kolomazník, J.; Coufal, J.; Goswami, P.; Červeň, J.; Pečinka, P. The Presence and Localization of G-Quadruplex Forming Sequences in the Domain of Bacteria.
Molecules 2019, 24, 1711, doi:10.3390/molecules24091711.
34. Marguet, E.; Forterre, P. DNA stability at temperatures typical for hyperthermophiles. Nucleic Acids Res.
1994, 22, 1681–1686, doi:10.1093/nar/22.9.1681.
35. Ding, Y.; Fleming, A.M.; Burrows, C.J. Case studies on potential G-quadruplex-forming sequences from the bacterial orders Deinococcales and Thermales derived from a survey of published genomes. Sci. Rep.
2018, doi:10.1038/s41598-018-33944-4.
36. Kota, S.; Dhamodharan, V.; Pradeepkumar, P.I.; Misra, H.S. G-quadruplex forming structural motifs in the genome of Deinococcus radiodurans and their regulatory roles in promoter functions. Appl. Microbiol.
Biotechnol. 2015, 99, 9761–9769, doi:10.1007/s00253-015-6808-6.
37. Mishra, S.; Chaudhary, R.; Singh, S.; Kota, S.; Misra, H.S. Guanine Quadruplex DNA Regulates Gamma Radiation Response of Genome Functions in the Radioresistant Bacterium Deinococcus radiodurans. J.
Bacteriol. 2019, 201, doi:10.1128/JB.00154–19.
38. Todd, A.K.; Johnston, M.; Neidle, S. Highly prevalent putative quadruplex sequence motifs in human DNA. Nucleic Acids Res. 2005, 33, 2901–2907.
39. Huppert, J.L.; Balasubramanian, S. Prevalence of quadruplexes in the human genome. Nucleic Acids Res.
2005, 33, 2908–2916.
40. Eddy, J.; Maizels, N. Gene function correlates with potential for G4 DNA formation in the human genome.
Nucleic Acids Res. 2006, 34, 3887–3896, doi:10.1093/nar/gkl529.
41. Bedrat, A.; Lacroix, L.; Mergny, J.L. Re-evaluation of G-quadruplex propensity with G4Hunter. Nucleic
Acids Res. 2016, doi:10.1093/nar/gkw006.
42. Brázda, V.; Kolomazník, J.; Lýsek, J.; Bartas, M.; Fojta, M.; Šťastný, J.; Mergny, J.-L. G4Hunter web application: A web server for G-quadruplex prediction. Bioinformatics 2019, 35, 3493–3495, doi:10.1093/bioinformatics/btz087.
43. Finan, T.M. The divided bacterial genome: Structure, function, and evolution. Microbiol. Mol. Biol. Rev. 2017,
81, e00019–17.
44. Yadav, V.K.; Abraham, J.K.; Mani, P.; Kulshrestha, R.; Chowdhury, S. QuadBase: Genome-wide database of G4 DNA-occurrence and conservation in human, chimpanzee, mouse and rat promoters and 146 microbes. Nucleic Acids Res. 2008, 36, D381–D385, doi:10.1093/nar/gkm781.
45. Waller, Z.A.; Pinchbeck, B.J.; Buguth, B.S.; Meadows, T.G.; Richardson, D.J.; Gates, A.J. Control of bacterial nitrate assimilation by stabilization of G-quadruplex DNA. Chem. Commun. 2016, 52, 13511–13514. 46. Rawal, P.; Kummarasetti, V.B.R.; Ravindran, J.; Kumar, N.; Halder, K.; Sharma, R.; Mukerji, M.; Das, S.K.;
Chowdhury, S. Genome-wide prediction of G4 DNA as regulatory motifs: Role in Escherichia coli global regulation. Genome Res. 2006, 16, 644–655, doi:10.1101/gr.4508806.
47. Brázda, V.; Lýsek, J.; Bartas, M.; Fojta, M. Complex Analyses of Short Inverted Repeats in All Sequenced Chloroplast DNAs. BioMed Res. Int. 2018, 2018, 1097018, doi:10.1155/2018/1097018.
48. Čechová, J.; Lýsek, J.; Bartas, M.; Brázda, V. Complex analyses of inverted repeats in mitochondrial genomes revealed their importance and variability. Bioinformatics 2018, 34, 1081–1085, doi:10.1093/bioinformatics/btx729.
49. Cahoon, L.A.; Seifert, H.S. Transcription of a cis-acting, noncoding, small RNA is required for pilin antigenic variation in Neisseria gonorrhoeae. PLoS Pathog. 2013, 9, e1003074.
50. Neidle, S. The structures of quadruplex nucleic acids and their drug complexes. Curr. Opin. Struct. Biol.
2009, 19, 239–250, doi:10.1016/j.sbi.2009.04.001.
51. Dhapola, P.; Chowdhury, S. QuadBase2: Web server for multiplexed guanine quadruplex mining and visualization. Nucleic Acids Res. 2016, 44, W277–W283.