HAL Id: hal-01498602
https://hal.inria.fr/hal-01498602
Submitted on 30 Mar 2017
HAL is a multi-disciplinary open access
archive for the deposit and dissemination of
sci-entific research documents, whether they are
pub-lished or not. The documents may come from
teaching and research institutions in France or
abroad, or from public or private research centers.
L’archive ouverte pluridisciplinaire HAL, est
destinée au dépôt et à la diffusion de documents
scientifiques de niveau recherche, publiés ou non,
émanant des établissements d’enseignement et de
recherche français ou étrangers, des laboratoires
publics ou privés.
Sparse Bayesian Non-linear Regression for Multiple
Onsets Estimation in Non-invasive Cardiac
Electrophysiology
Sophie Giffard-Roisin, Hervé Delingette, Thomas Jackson, Lauren Fovargue,
Jack Lee, Aldo Rinaldi, Nicholas Ayache, Reza Razavi, Maxime Sermesant
To cite this version:
Sophie Giffard-Roisin, Hervé Delingette, Thomas Jackson, Lauren Fovargue, Jack Lee, et al.. Sparse
Bayesian Non-linear Regression for Multiple Onsets Estimation in Non-invasive Cardiac
Electrophys-iology. Functional imaging and modelling of the heart 2017, Jun 2017, Toronto, Canada. pp.230-238,
�10.1007/978-3-319-59448-4_22�. �hal-01498602�
Multiple Onsets Estimation in Non-invasive
Cardiac Electrophysiology
Sophie Giffard-Roisin1, Herv´e Delingette1, Thomas Jackson2,
Lauren Fovargue2, Jack Lee2, Aldo Rinaldi2, Nicholas Ayache1,
Reza Razavi2, and Maxime Sermesant1
1 Universit´e Cˆote d’Azur, Inria, France. 2
Department of Biomedical Engineering, King’s College London, United Kingdom.
Abstract. In the scope of modelling cardiac electrophysiology (EP) for understanding pathologies and predicting the response to therapies, patient-specific model parameters need to be estimated. Although per-sonalisation from non-invasive data (body surface potential mapping, BSPM) has been investigated on simple cases mostly with a single pac-ing site, there is a need for a method able to handle more complex situa-tions such as sinus rhythm with several onsets. In the scope of estimating cardiac activation maps, we propose a sparse Bayesian kernel-based re-gression (relevance vector machine, RVM) from a large patient-specific simulated database. RVM additionally provides a confidence on the result and an automatic selection of relevant features. With the use of specific BSPM descriptors and a reduced space for the myocardial geometry, we detail this framework on a real case of simultaneous biventricular pacing where both onsets were precisely localised. The obtained results (mean distance to the two ground truth pacing leads is 18.4mm) demonstrate the usefulness of this non-linear approach.
Keywords: ECG Imaging, Personalisation, Relevance Vector Machine, Cardiac Electrophysiology
1
Introduction
Modelling cardiac electrophysiology (EP) can help in understanding pathologies and predicting the response to therapies such as cardiac resynchronization ther-apy (CRT). However estimating accurately patient-specific model parameters is then crucial, and it often involves invasive measurements [1]. In order to replace these invasive measurements -risky for the patient-, Giffard-Roisin et al. [2] per-sonalised the cardiac EP model from body surface potential mappings (BSPM). The onset activation location and the global conduction velocity were estimated in different pacing locations from several patients. However, personalisation may often be needed in more complex situations, such as multiple activation onsets, heterogeneous myocardial tissue (scar) or a particular pathology. Estimation of
2 Sophie Giffard-Roisin, Herv´e Delingette, Thomas Jackson et al.
heterogeneous myocardial conduction using a Bayesian framework has been re-cently explored by Dhamala et al. [3], but the other parameters such as the onset are supposed to be known, and the uncertainty on the result is not estimated. The contributions of this work are the extension of a cardiac EP personalisation in order to handle non-linear situations (from single to multiple onsets) and to acquire information relative to the confidence on the results. The methodology, based on a relevance vector regression and on a myocardial shape dimension re-duction, is tested and compared with the method from [2] on a real biventricular pacing dataset. The methodology is summarised in Figure 1.
Fig. 1. Pipeline: The RVM (relevance vector machine) regression is performed between BSPM features and a reduced shape space where the patient-specific training activation maps were projected. For a new sample (BSPM data) we estimated its activation map and the regression error. In this paper, the onset locations were further extracted from this estimated activation map.
2
Materials and Methods
2.1 Clinical Data
In this study, we considered a patient dataset composed of BSPM signals, ven-tricular myocardial geometry (since only the QRS complex is studied, the atria were not included in the model), torso leads and pacing leads locations. The BSPM potentials (from a CardioInsight jacket) were acquired during the pro-cedure at a sampling rate of 1kHz, with a number of torso sensors of 205. The protocol of this study was approved by the local research ethics committee. The approximated myocardial surface as well as the location of the torso sensors and the pacing leads were extracted from 3D imaging (CT scanner). On a rigidly reg-istered generic and volumetric mesh, cardiac fiber orientations were estimated with a rule-based method (elevation angle between −70◦ to 70◦).
2.2 Non-invasive Personalisation of a Cardiac EP Model
We used a fast forward EP model derived from the anisotropic Mitchell-Schaeffer cardiac model and a current dipole formulation for computing simultaneously the cardiac electrical sources and body surface potentials [2]. From the generation of a large database of simulated transmural myocardial potentials and torso signals, we learned patient-specific parameters of the EP cardiac model. In order to retain the important aspects of the QRS complex from the BSPM signals, specific descriptors on the normalized BSPM signals were extracted (such as timings, area under the curve, sign of extremum). Specifically, the location of the onset activation was estimated by firstly regressing the activation times of the transmural myocardial mesh, before localizing the minimal time. Every simulated set of BSPM signals vi was perturbed by a Gaussian random noise of
mean 0 and std = 2e − 3 × norm(vi). This was done for robustness and in order
to give more confidence to electrodes closer to the heart: where the potentials are of higher amplitude, the signal-to-noise ratio would be larger.
2.3 Dimensionality Reduction of the Myocardial Shape
The myocardial tetrahedral mesh can have a large number of elements or vertices. At the same time, the signal to be reconstructed, the activation map, is strongly correlated spatially due to the propagation of the electric potential throughout the myocardium. Therefore, it is meaningful to reduce the dimension of the regression variable, the activation times. A simple way would be to use a coarser mesh but this would be at the expense of reducing the accuracy of the onset locations. Instead, we propose to use a hierarchical decomposition of the mesh, naturally provided by the eigenmodes of a structural matrix. To this end we chose the eigen-decomposition of the stiffness matrix associated with the Laplacian operator. This decomposition has been widely used in various spectral shape analysis [4, 5] and is closely related to the modes of vibration of the myocardium. The extracted eigenvectors are naturally sorted by ascending order to spatial frequency. By selecting the first few eigenmodes, we only keep the large spatial variations. If we call t the vector of N activation times at each vertex of the myocardial mesh, we get the following reduction and reconstruction formulas:
tred= VMt ; trec= VMTtred
with tredthe coordinates of t in the reduced space, VM the N × M matrix of the
first M eigenvectors of the stiffness matrix, and trecthe reconstructed activation
times. The matrix VM is independent of t and is thus computed only once. An
example of reconstructed activation map (on 14K vertices) using 400 modes is shown in Figure 2(c). From Figure 2(a), we can see that the mean reconstruction error is less than 2 ms (max: 7 ms) for 400 modes.
2.4 Parameter Estimation using Relevance Vector Regression In order to regress the myocardial activation times from the BSPM features, we use the Relevance Vector Machine (RVM) regression method [6]. This
ap-4 Sophie Giffard-Roisin, Herv´e Delingette, Thomas Jackson et al.
(a) Reconstruction error (b) Original (c) Reconstruction
Fig. 2. Example of reconstruction of an activation map (on 14430 vertices) from the eigenvectors of the stiffness matrix: (a) Reconstruction error wrt. the number of modes (b) original activation map (c) reconstructed activation map from 400 modes.
proach performs sparse kernel regression based on a sparsity inducing prior on the weight parameters within a Bayesian framework. Unlike the commonly used Elastic-Net or Lasso approaches (based on L1 Norm a.k.a Laplacian prior), the RVM method does not require to set any regularization parameters through cross-validation. Instead, it automatically estimates the noise level in the input data and performs a trade-off between the number of basis (complexity of the representation) and the ability to represent the signal. Furthermore, unlike SVM regression or Elastic-Net, it provides a posterior probability of each estimated quantity which is reasonably meaningful if that quantity is similar to the training set. In our setting, we used Gaussian kernels for the non-linear regression whose variance of the kernel parameters need to be defined. The RVM regression only selects the input BSPM feature set that can best explain the activation map in the training set, thus limiting the risk of overfitting. RVM is a multivariate but single-valued approach and therefore the regression was directly performed on the reduced space of section 2.3: only 400 regressions are needed to perform an estimation of the 14K activation times. We used a Gaussian radial basis function with a kernel bandwidth of 1e4 (from cross-validation). On an EliteBook Intel Core i7, a regression of 1000 training samples and 1235 features runs in 40 sec.
3
Application to the Personalisation of a Simultaneous
Biventricular Pacing
3.1 Simultaneous Biventricular Pacing Personalisation
We consider here a non-ischaemic implanted CRT patient that underwent a pac-ing lead optimization procedure with a BSPM device. In particular, the 205 work-ing torso electrodes recorded a biventricular simultaneous pacwork-ing. The anatomy as well as the location of the torso sensors and the pacing leads were extracted from CT images. Because of important artifacts coming from the pacemaker, only a coarse epicardial geometry of the myocardium is visible. That is why a
generic volumetric myocardial mesh of roughly 65K tetrahedra was manually registered and scaled to the epicardial geometry. The CardioInsight Technolo-gies software also solves the inverse problem on this epicardial surface (based on the standard formulation using a Tikhonov regularization and the general-ized minimal residual algorithm), see Figure 3(a). In this work, we used this activation map as part of the evaluation of our method. From this simultaneous pacing, we want to retrieve the two onset locations. Locating both activation onset locations by means of an EP model parameter estimation has first been studied by He et al. [7], but only on synthetic data. For this particular goal, our simulated training set was composed of 1000 simulations with fixed conduction velocity (0.5m/s) and with two onset locations randomly selected on the surface of the myocardial mesh (endocardium and epicardium).
3.2 Results
(a) CardioInsight (b) KRR (c) RVM (d) RVM reduced
Fig. 3. Results for locating both onsets: ground truth lead locations are the red dots. (a) CardioInsight inverse solution (b) kernel ridge regression activation map result (c) relevance vector regression separately for the 14K vertices (d) relevance vector regres-sion on 400 modes of the reduced space. The color maps are showing short activation times (red) to large ones (purple). On top: flattened representation of the left endo-cardium in the conventional orientation (i.e. anterior on top).
We compare here the results of the activation map regression of (i) the Kernel Ridge Regression provided by [2], (ii) the RVM regression independently on each point of the cardiac mesh and (iii) the RVM regression using the reduced shape space (Figure 3). The two ground truth onset locations (pacing sites)
6 Sophie Giffard-Roisin, Herv´e Delingette, Thomas Jackson et al.
are the red dots. On top is the flattened representation of the left ventricular endocardium, where the apex is at the center [8]. The activation map provided by the CardioInsight system on the coarse surface mesh is shown in Figure 3(a). Although this map is not precise and cannot be used as a ground truth, it gives an idea of the wave shape. We can see that the kernel ridge regression acts as a blurry mixture of both initializations, not able to separate them. The RVM regression performed on each vertex captures the two onset zones, but the resulting activation maps are noisy and the two minimal values are not easy to capture. The error distances to the true pacing leads are 31.7 mm (left lead) and 41.2 mm (right lead). On the other hand, the RVM performed on the reduced space captures two onset locations with an error distance of less than 23mm for both leads, while having a smooth solution. The mean number of relevance vectors retained was 213 (out of 1000 samples).
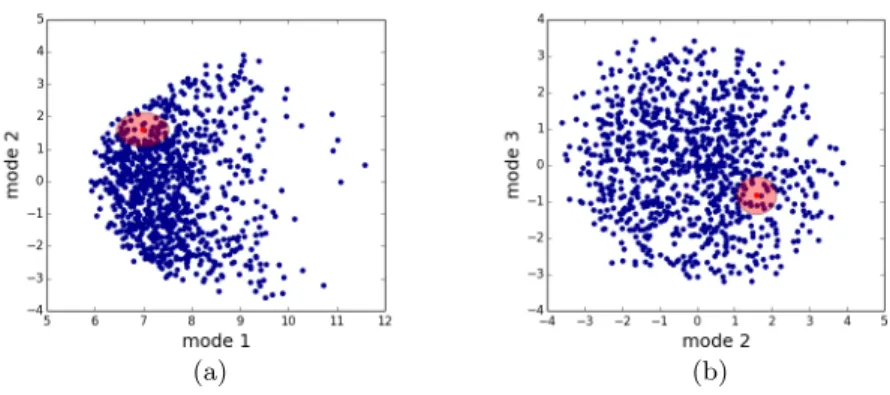
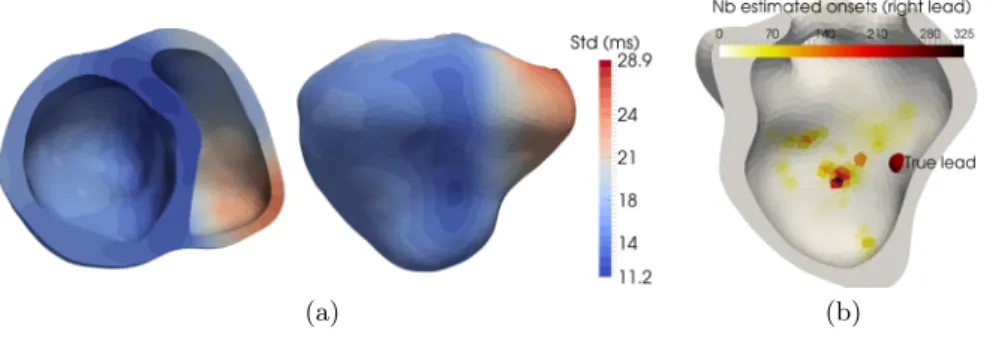
The RVM provides the result as a Gaussian probability distribution, where the retained solution of each regression was the mean. By looking at the esti-mated variance across each mode, we can estimate the confidence on our result. On Figure 4 are plotted the projections on the first spectral modes of the simu-lated activation maps (training set) as well as the estimated solution. We have also represented the confidence interval (+/- standard deviation, std). First, we can see that the retained sample lies inside the training set point cloud, which is important for RVM to perform well. We have projected the point-wise estimated std onto the myocardial mesh (Figure 5(a)) where we can see that all the vertices from the left ventricle have an estimated std below 17ms (and below 14 ms for the septum). Although higher values (max: 28.9 ms) are found in the right ven-tricle, we can notice that the estimated activation times from this region were greater than 100 ms.
(a) (b)
Fig. 4. Confidence interval in the reduced space (+/- std): (a) projection on modes 1 and 2 (b) projection on modes 2 and 3. blue dots: projection of the 1000 simulated activation maps used for training. Red dot: estimated activation map.
(a) (b)
Fig. 5. (a) Standard deviation (std) of the estimated activation time, in milliseconds. All the points in the left ventricle have an estimated std below 17 ms. (b) Locations of the right onset when randomly sampling the estimated Gaussian distribution of the reduced space (10K samples).
However, the confidence on the activation times is not sufficient to quantify the onset location error. This is why we additionally randomly sampled 10K coordinates from the estimated Gaussian distribution in the reduced space (see red ellipsoid from Figure 4). We then reconstructed the activation maps for each one of them and retrieved their minima as estimations of left and the right onsets (see Figure 5(b) for the right onset). For the most probable location, the distance error to the ground truth location was 12.3mm for the left lead and 24.5mm for the right lead. The standard deviation of the error was 18mm for the left onset and 11.4mm for the right onset. We can notice that the left onset was located more accurately, however with less confidence.
4
Discussion
The presented method holds several limitations. One current limitation of the RVM regression is the fact that it only performs multivariate regression of a single output scalar value but not of a vector value (unlike KRR for instance) although multivalued versions have been recently proposed [9]. Concerning the reconstruction from the reduced space, we also tested it with sharp edges in the activation map, like scar tissue blocking the activation wave. Despite higher er-rors of activation times in the scar, the boundaries of the scar were well captured so we hope we could extend our method to ischemic patients.
The estimations of the covariance matrix of the activation map are provided as a by-product of the RVM regression, giving an estimation of the regression error. However, other sources of error may be taken into account in order to have a full apprehension on the confidence of the result. We think it is the reason why the cloud of possible onsets of Figure 5(b) did not exactly include the true lead. If the torso sensors were well localized by the CT scan, we had to use a generic mesh because no precise myocardial shape was available. We would like to test our method on patient-specific myocardial meshes which will
8 Sophie Giffard-Roisin, Herv´e Delingette, Thomas Jackson et al.
also help in modelling the error source when using generic meshes. Regarding the errors coming from the BSPM data, they were considerably reduced by the fact that the disconnected or bad leads were automatically excluded, and that we added some Gaussian noise to our simulated BSPM for robustness. Finally, we should also evaluate the EP modelling errors, for instance by analyzing the discrepancy between the true and simulated BSPM signals.
This new method has been tested on only one patient so more experiments are needed for its validation. As a future work, we want to exploit the generic properties of this approach to robustly estimate additional cardiac parameters, like the (local) conduction velocity for instance.
5
Conclusion
We presented a new methodology for multiple onset estimation from BSPM and applied it to one clinical dataset. This was integrated in a novel framework for the personalisation of cardiac EP parameters from BSPM data. This method relies on the generation of a simulated patient-specific database on which a relevance vector regression estimates the activation map from a new set of BSPM signals. As input, specific shape-related features were extracted from the BSPM. As output, the activation map was projected onto a reduced space defined from myocardial shape oscillations. This pipeline enables the estimation of parameters in more complex situations, as the example presented here with the location of two onsets from a real biventricular pacing BSPM sequence. We think this method could be useful for a generalization of cardiac EP personalisation, one of the advantages being the confidence on the regression provided by the RVM.
Acknowledgments. The research leading to these results has received funding from the Seventh Framework Programme (FP7/2007-2013) under grant agree-ment VP2HF n◦611823.
References
1. Sermesant, M., Chabiniok, R., Chinchapatnam, P. et al. , “Patient-specific elec-tromechanical models of the heart for the prediction of pacing acute effects in crt: A preliminary clinical validation,” Medical image analysis 16-1, pp. 201–215 (2012) 2. Giffard-Roisin, S., Jackson, T., Fovargue, L., Lee, J., Delingette, H., Razavi, R., Ayache, N. & Sermesant, M. Non-Invasive Personalisation of a Cardiac Electro-physiology Model from Body Surface Potential Mapping. IEEE Transactions on Biomedical Engineering (2016)
3. Dhamala, J., Sapp, J. L., Horacek, M., & Wang, L. Spatially-Adaptive Multi-scale Optimization for Local Parameter Estimation: Application in Cardiac Electrophys-iological Models. MICCAI, pp. 282-290. Springer International Publishing (2016) 4. Reuter, M., Wolter, F., & Peinecke, N. Laplace-spectra as fingerprints for shape
matching. ACM symposium on Solid and physical modeling (2005)
5. Umeyama, S. ”An eigendecomposition approach to weighted graph matching prob-lems.” IEEE transactions on pattern analysis and machine intelligence 10.5 (1988)
6. Tipping, M. E., & Faul, A. C. Fast marginal likelihood maximisation for sparse Bayesian models. In AISTATS (2003)
7. He, B., Li, G., & Zhang, X. Noninvasive three-dimensional activation time imaging of ventricular excitation by means of a heart-excitation model. Physics in medicine and biology, 47(22), 4063 (2002)
8. Soto-Iglesias, D., Butakoff, C., Andreu, D., Fern´andez-Armenta, J., Berruezo, A., & Camara, O. Integration of electro-anatomical and imaging data of the left ventricle: An evaluation framework. Medical image analysis, 32, 131-144 (2016)
9. Le Folgoc, L., Delingette, H., Criminisi, A., and Ayache, N. ”Sparse Bayesian reg-istration of medical images for self-tuning of parameters and spatially adaptive parametrization of displacements.” Medical Image Analysis 36 (2017)