HAL Id: hal-02010442
https://hal.archives-ouvertes.fr/hal-02010442
Submitted on 7 Feb 2019
HAL is a multi-disciplinary open access
archive for the deposit and dissemination of
sci-entific research documents, whether they are
pub-lished or not. The documents may come from
teaching and research institutions in France or
abroad, or from public or private research centers.
L’archive ouverte pluridisciplinaire HAL, est
destinée au dépôt et à la diffusion de documents
scientifiques de niveau recherche, publiés ou non,
émanant des établissements d’enseignement et de
recherche français ou étrangers, des laboratoires
publics ou privés.
HIGH BURNUP CHANGES IN UO 2 FUELS
IRRADIATED UP TO 83 GWd/t IN M5 ®
CLADDINGS
J. Noirot, I Aubrun, L. Desgranges, K Hanifi, J. Lamontagne, B. Pasquet, C.
Valot, P Blanpain, H. Cognon
To cite this version:
J. Noirot, I Aubrun, L. Desgranges, K Hanifi, J. Lamontagne, et al.. HIGH BURNUP CHANGES IN
UO 2 FUELS IRRADIATED UP TO 83 GWd/t IN M5 ® CLADDINGS. Nuclear Engineering and
Technology, Elsevier, 2009, 41 (2). �hal-02010442�
HIGH BURNUP CHANGES IN UO
2FUELS
IRRADIATED UP TO 83 GWd/t IN M5
®CLADDINGS
J. Noirot, I. Aubrun, L. Desgranges, K. Hanifi, J. Lamontagne, B. Pasquet,
C. Valot, P. Blanpain*, H. Cognon**
CEA, DEN, DEC Cadarache, F-13108 St. Paul Lez Durance, France
Tel: 334 42 25 44 97 , Fax: 33 4 42 25 36 11 , Email: jean.noirot@cea.fr
* AREVA-NP, 10 rue Juliette Recamier, 69456 Lyon Cedex 06, France
**EDF/SEPTEN, 12-14 avenue Dutrievoz, 69628 Villeurbanne Cedex, France
Abstract Since the 90's, EDF and AREVA-NP have irradiated, up to very high burnups, lead assemblies housing M5® cladded fuels. Post-irradiation examination of high burnup UO
2 pellets show an increase in the fission-gas release rate, an increase in fuel swelling, and formation of fission-gas bubbles throughout the pellets. Xenon abundances were quantified, and phenomena leading to this bubble formation were identified. All examinations provided valuable data on the complex state of the fuel during irradiation. They show the good behavior of these fuels, exhibiting various microstructures at very high burnups, none of which is likely to lead to problems during irradiation.
I. INTRODUCTION
Increases in discharge burnup in light water reactor (LWR) fuels, suitable for economic benefits, imply the irradiation of lead fuel rods at very high burnups in order to gather good knowledge of the fuel performance and behavior under these conditions. Since the 90's, AREVA-NP, with the support of Electricité De France (EDF), has launched in-pile research programs on M5® cladded fuels
used at very high burnups. Detailed post-irradiation examinations of UO2 fuels having experienced increasing
burnups during their irradiations in EDF pressurized water reactors (PWR) have been performed at Commissariat à l'énergie atomique (CEA) laboratories. Even though most of this program focused on cladding behavior, the behavior of the fuel itself was also studied, especially at high burnups. This paper presents an overview of the main observations made in the CEA LECA-STAR hot cells facility within the framework of these programs. Optical microscopy, hydrostatic density measurements, rod diameter measurements, scanning electron microscopy on polished samples as well as on fractures, Electron Probe Micro Analyzes, and Secondary Ion Mass Spectrometry, were performed.
II. FUEL DATA
The fuels described in this paper were fabricated in two batches only. This forced their initial properties to be similar.
Initial 235U enrichment: 4.5%.
Initial porosities: ≈5%.
Grains sizes: ≈11 µm.
Resintering tests: 0.4% of densification after one day at 1700 °C, 0.61% after two days, and 0.7% after four days.
The cladding was M5®.
All fuels were irradiated in the EDF Gravelines 5 reactor. The highest burnup used here was reached after 7 one-year cycles of irradiation. The highest mean rod burnup was 78.4 GWd/tU, and the highest sample burnup was 83 GWd/tU.
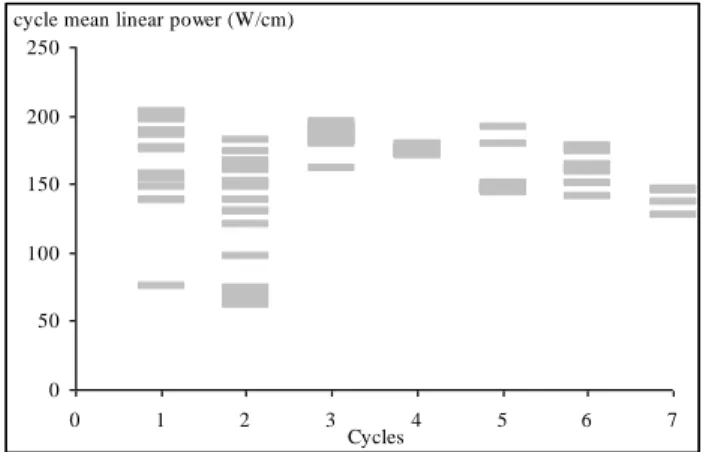
The linear powers during these irradiations differed from rod to rod. The range of linear powers found during these irradiations are displayed in Fig. 1. Meteor fuel behavior code calculations shows, for example, that the fuel centerline temperatures were in the range 800-900 °C during the last 3 cycles for the rods examined after 7 cycles of irradiation.
Figure 1. Linear power histories 0 50 100 150 200 250 0 1 2 3 4 5 6 7 Cycles cycle mean linear power (W/cm)
III. POST IRRADIATION EXAMINATION TECHNIQUES
Examinations used in this study were conducted in the hot cells of the CEA LECA-STAR facility in Cadarache, France and are outlined below.
A specially designed rod-puncturing device 1.
A LWR dedicated non-destructive testing device.
Hydrostatic density measurements employing a shielded Mettler precision balance and bromobenzene.
An Olympus PME3 optical microscope with hot cell adaptations. Image acquisition equipment consisted of an FView II camera integrated into the SIS acquisition system.
A shielded electronic microprobe (EPMA) Camebax microbeam from CAMECA tailored for acquisition and measurement exploitation using the SAMx system.
A Philips XL30 scanning electron microscope (SEM) on which the WDX Microspec spectrometer used in-house shielding. The ADA "SIS" system was used for large field acquisitions, with the AnalySIS software for image analysis.
A CAMECA IMS 6f secondary ion mass spectrometer (SIMS) capable of analyzing the same samples as the SEM and EPMA.
For observational purposes, samples were prepared either by fracturing the fuel for SEM surface examination or by grinding and polishing the cross sections.
IV. PIE RESULTS
IV. A. Fission-gas release
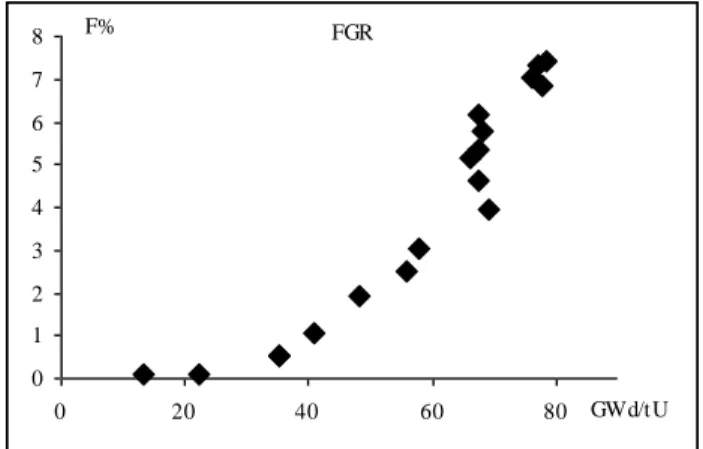
Fission-gas release, obtained by rod-puncturing, as a function of the rod mean burnup, is displayed in Fig. 2. The results show an increase in fission-gas release rate with mean rod burnup, especially at high burnup.
Figure 2. Fission-gas release
The scattering in fission-gas release around 70 GWd/t is influenced more by the power step between the last two cycles than the actual power level of the last cycles. The specimen referred as the 73 GWd/tU sample in the following was cut in the rod having experienced the largest increase of power between cycles 5 and 6 and exhibiting therefore the highest release for this range of burnup.
IV. B. Fuel swelling
The fuel hydrostatic density measurements show an increase in fuel swelling rate at high burnup.
The swelling rate exceeds 0.09% per GWd/tU at the highest burnups, which is more than 60% higher than its value below 30 GWd/t (Figure 3). This increase is due to an increase of fission-gas precipitation into bubbles at high burnup. Indeed, as will be shown in the following, an increasing proportion of fission-gases form bubbles within the fuel. However, the bubble formation rate is even higher, but the swelling is limited by the low atomic volume of the gas in these bubbles. We study this fission-gas precipitation by analyzing the resulting microstructure via optical microscopy and SEM and through microanalysis by EPMA and SIMS.
Figure 3. Fuel swelling at high burnup
FGR 0 1 2 3 4 5 6 7 8 0 20 40 60 80 F% GWd/tU 0 1 2 3 4 5 6 7 0 20 40 60 80 % swelling GWd/tU low burnup swelling
Figure 4. Zirconia formation corrected rod mean diameter in span 5.
Fuel swelling was also detected in the non-destructive rod diameter measurements. Mean span 5 rod diameters as measured are shown in Fig. 4. Subtracted from those data are slight increases in diameter due to zirconia formation on the external surface of the clad. Surface increases associated with diameter increases indicate pellet surface increases of 0.058% and 0.086% per GWd/tU in the range 60-70 GWd/tU and 70-83 GWd/tU, respectively.
IV. C. Microstructure and microanalysis
In these high burnup fuels, the main microstructural changes are high burnup structure (HBS) formation and spreading, and thermal fission-gas precipitation in the central part of the pellets. Nonetheless, some other interesting features exist all over the pellets.
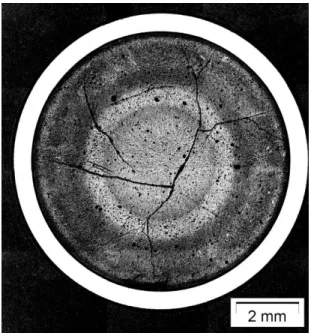
A macrograph of a radial cut (at 83 GWd/tU local burnup) from a 77 GWd/tU rod is displayed in Fig. 5. This macrograph was taken after chemical etching revealed both grain boundaries and small fission-gas bubbles. Concentric areas are evident at this low magnification. At the periphery (very dark ring) is the HBS. Inside this is a much thicker inhomogeneous (less) dark area that extends down to 0.57R (where R is the radius, and 1R is defined as the periphery). A brighter ring spanning 0.57-0.43R clearly delineates the external limit of the central fission-gas precipitation region. This central area itself is inhomogeneous, being brighter at its centre than at its periphery.
These radial differences in the grey levels are mainly due to factors such as the bubble size and density, some grain defects density, and, especially for the rim area, the size of the grains themselves. Consequences of these variations on the EPMA xenon measurements can be seen in Figure 6. Here, EPMA xenon concentration measurements are compared to a creation profile deduced from the EPMA neodymium measurements along the same radius of the sample. The positions where the measured values are much lower than the creation may partially
correspond to xenon release from the pellet, but they are
mainly places where much of the fission-gases have
precipitated into bubbles. Opening of surface bubbles during polishing significantly influences the measurements because the analysis process involves less than one micrometer at the surface of the fuel 2,3.
Figure 5. Macrograph of a radial cut of a 83 GWd/tU sample. Chemical etching revealed small bubbles and grain boundaries.
Figure 6. Xenon concentration as a function of radius for the 83 GWd/tU sample as measured by EPMA.
EPMA measurements are very low at the periphery and increase rapidly and approach the creation values as we move towards the center—they do not really reach the creation values. The measurements can be very different from one point to the other even in the same area. In the
ROD DIAMET ER 9.35 9.4 9.45 9.5 9.55 0 20 40 60 80 D (mm) GWd/tU 0.977R 0.57R 0.43R -0.5 1.0 1.5 2.0 0.0 0.2 0.4 0.6 0.8 1.0 creation W%(Xe)
83 GWd/tU sample xenon Weight% measured by EPMA
r/R W%
range 0.57-0.43R, some measurements are close to the creation values, and others are not—the scatter is large. These measurements correspond to the brightest ring in Figure 5. The central area (0.43-0R) also exhibits variation, the peripheral darker area corresponds to a higher EPMA measurement than the brighter centre, with a limit around 0.2R.
SIMS measurements 4 complement the EPMA
measurements that give the proportion of xenon precipitated into bubbles and not released from the pellet. In Figure 7 and 8, the black triangles profiles are SIMS results corresponding to Figure 6 EPMA results. All areas where a large part of the xenon is missing in the EPMA measurements are also areas where a large part and a large amount of xenon is measured inside bubbles by the SIMS. Figure 7 also indicates the presence of bubbles throughout the pellet. Shown on these same graphs are the SIMS measurements for both 61 and 73 GWd/tU samples as well as the 83 GWd/tU sample. These measurements show, for all radial positions, an increase (with burnup) in the
proportion of xenon inside bubbles and an increase of the amount of xenon inside these bubbles in spite of
fission-gas release. These increases are particularly clear in the central area and in the intermediate range of 1-0.57R.
Figure 7. Proportion of the retained xenon precipitated into bubbles as a function of radius for the 61, 73 and 83 GWd/tU samples as measured by SIMS.
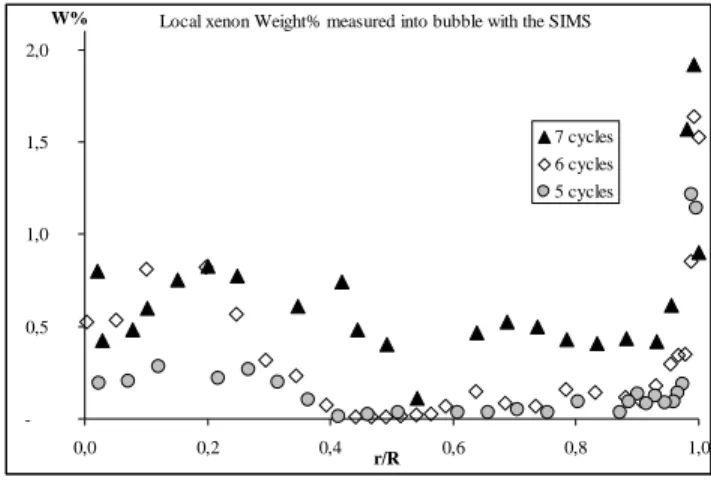
Figure 8. Local xenon weight% measured in the bubbles as a function of radius for the 61, 73 and 83 GWd/tU samples as determined by SIMS.
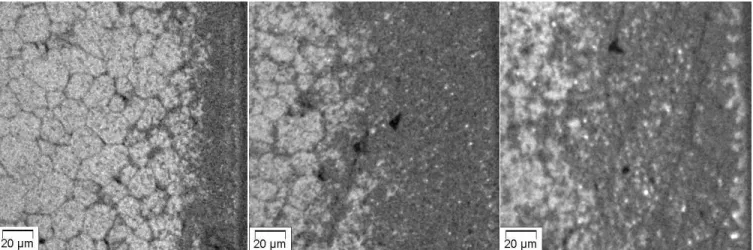
We now go into detailed findings working from the periphery towards the centre. Figure 9 first shows the increase (with burnup) of the highly developed HBS area. At 61 GWd/tU, in spite of an excess of 95 GWd/tU at periphery and of 80 GWd/tU 120 µm from the edge of the pellet, the extent of the highly developed HBS is still very limited (≈20 µm). It is wider for the higher burnup samples, but it is still not very wide (≈82 and 92 µm). At these limits, the local burnup is higher than 100 GWd/tU. This has to be understood with the coming high burnup post irradiation examination results. The relatively low HBS area thicknesses at high burnup might be associated with the steep plutonium increase at the periphery—the plutonium has an effect on HBS formation 5.
Figure 10 shows a SEM image of the 83 GWd/tU sample periphery. The interpenetration of the internal zirconia and of the HBS is clear. The strong bonds between the pellet and the clad through this interpenetration induce cracks in the HBS. This is a likely source of fission-gas release, but has not been borne out by SIMS measurements. 0% 10% 20% 30% 40% 50% 60% 70% 80% 90% 100% 0.0 0.2 0.4 0.6 0.8 1.0 7 cycles 6 Cycles 5 cycles r/R
SIMS determination of the ratio (xenon in bubbles) /(total xenon measured)
-0,5 1,0 1,5 2,0 0,0 0,2 0,4 0,6 0,8 1,0 7 cycles 6 cycles 5 cycles Local xenon Weight% measured into bubble with the SIMS
r/R W%
Figure 9. Increase of the highly developed HBS with the increasing burnup, EPMA xenon X-ray mappings at the periphery of the 61, 73 and 83 GWd/tU fuels.
The atomic volume of the gas inside the HBS bubbles slightly increases with burnup but remains lower than 170 Å3/atom—i.e. less than 4.2 times the trivacancy
volume.
Figure 9 and 10 show the HBS internal limit to be fuzzy. SEM fractographs (Figure 11) show the transition between the highly restructured HBS and the almost intact microstructure a few micrometers further. They highlight the bubbles measured by the SIMS in the range1-0.57R.
In fact, in this area, two phenomena are evident:
The first is xenon depletion around the grain boundaries. Clearly visible in Figure 9, at 61 GWd/tU, it is much wider in Figure 13 at 83 GWd/tU.
The other phenomenon is partially intragranular bubble formation.
These two phenomena are already active at 61 GWd/t, though the amount of gas involved in the precipitations at this burnup remains limited (≈10% at 0.9R and 5% at 0.7R). They already cover the same areas, reaching the central precipitation area for the first one, and up to 0.57R
for the second. Altogether, they imply ≈40% of the local gas in the 83 GWd/tU fuel.
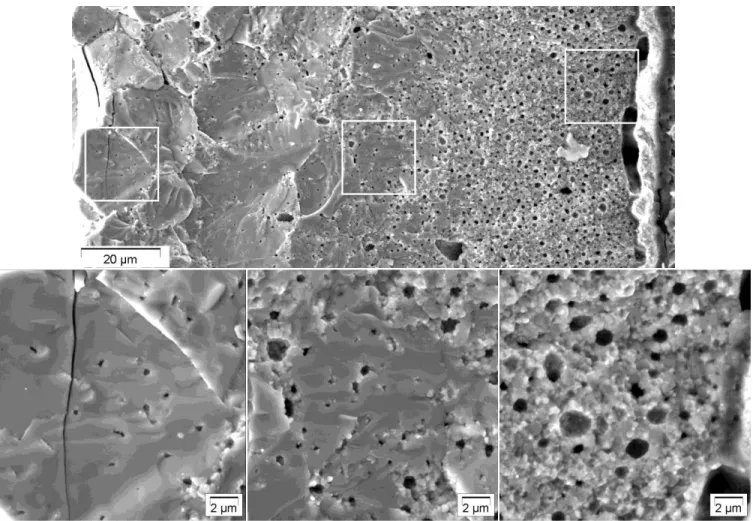
Figure 10. Backscattered electrons SEM image of the 83 GWd/tU fuel periphery.
Figure 11. SEM fractograph of the 73 GWd/tU sample periphery.
Figure 12. EPMA xenon X-ray mapping at
Figure 12 displays a xenon X-ray mapping of the 83 GWd/tU cross section near 0.73R. It exhibits both of the above phenomena: the first one delineates the grains and the second leads to larger dark areas. This mapping explains the scattering seen in Figure 6.
In the range 0.57-0.43R, the second phenomenon is apparently, not present, and the amount of xenon inside bubbles greatly decreases. Some intergranular bubbles are detected by SEM, but we suspect an actual partial release from this area as the amount of xenon measured in the bubbles by SIMS does not compensate the EPMA lacks on the xenon profile in this area.
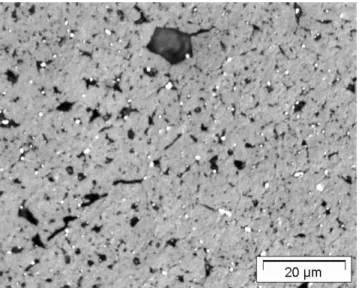
In the central area, the SEM and optical microscopy details (Figure 14-20) explain the differences both on the macrograph after chemical etching (Figure 5) and on the EPMA xenon measurement profile (Figure 6).
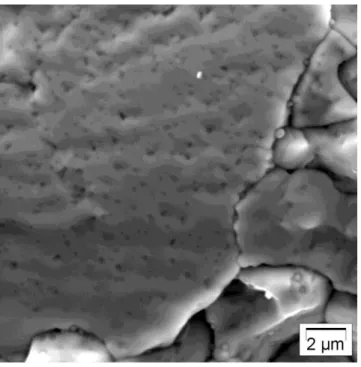
The SEM fractograph of the 73 GWd/tU sample at 0.34R in Fig. 14 presents an intragranular view, whereas Figure 15 is an intergranular view in the same area. Optical microscopy (Figure 19) also shows this periphery of the central area after chemical etching of the 83 GWd/tU cross section. Many small intragranular bubbles and metallic precipitates are present. Larger metallic fission-product precipitates are also evident in intergranular position associated with large bubbles. This microstructure is close to the 61 GWd/tU observations near 0R (Figure 16).
Figure 14. SEM fractograph of the 73 GWd/tU sample at 0.34R, intragranular view.
Figure 15. SEM fractograph of the 73 GWd/tU sample at 0.34R, intergranular view.
Figure 16. Optical microscopy after chemical etching of the 61 GWd/tU sample at 0R.
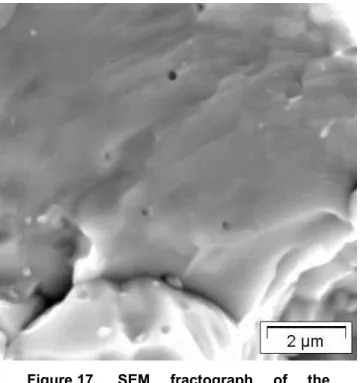
The fractographs in Figure 17 18 and the optical micrographs in Fig. 20 show the centers of the 73 GWd/tU and 83 GWd/tU pellets, respectively. Only a few small intragranular bubbles are present, which explains the brighter grey level at the centre on the macrograph. Most of the bubbles are intergranular and large. They are associated with large metallic precipitates. Moreover, these large bubbles are neither spherical nor lenticular, and they do not seem to be widely interconnected. It is not so easy to see the difference between inter- and intragranular
surfaces in these fractographs. Most of the gas retained inside the fuel at the center is in fact located inside these bubbles. Nevertheless, the bubbles are no longer highly over-pressurized, as they can be at 61 GWd/tU 2. Indeed,
our evaluation of the atomic volume of the gas inside the bubbles is about 195 Å3/atom at 0.24R and 321 Å3/atom at
the center (4.7 and 7.9 times the trivacancy volume), whereas our evaluations2 were only slightly superior to the
trivacancy volume.
Figure 17. SEM fractograph of the 73 GWd/tU sample at the center of the pellet, intragranular view.
Figure 18. SEM fractograph of the 73 GWd/tU sample at the center of the pellet.
Figure 19. Optical microscopy after chemical etching of the 83 GWd/tU sample at 0.25R
Figure 20. Optical microscopy after chemical etching of the 83 GWd/tU sample at 0R (centre).
V. CONCLUSION
With the increasing fuel burnup, a number of observations were made:
An increase in fission-gas release rate and, after 6 cycles, a power-step level effect between cycle 5 and cycle 6 higher than the last power level effect.
An increase in swelling of the fuel borne out by hydrostatic density measurements and through the observed mean increase of the rod diameters after gap closure.
Formation of fission-gas bubbles all over the surface of the pellet.
When compared with other high burnup fuel results6,7,8, the
state and extent of the HBS is far less advanced here. The thickness of the (completely developed) HBS, for instance, is about 92 µm at 83 GWd/tU, whereas more than 350 µm has been reported elsewhere7. This point has to be
understood with the coming high burnup post irradiation examination results.
An increase in porosity in the pellets between 1R and 0.43R was confirmed. It remains very limited and is mainly intergranular in the range 0.43-0.57R. It therefore concerns mainly the area between 0.57R and the HBS area. This increase is attributed to two different phenomena:
The first involves a depletion of fission-gases around the grain boundaries, which brings gas to the grain boundaries. This phenomenon is observed between the central precipitation area and the HBS structure. It is the only phenomenon observed in the grange 0.43-0.57R.
The second is the formation of additional bubbles between 0.57R and the highly developed HBS. It can be intragranular and seems in continuity with the HBS bubbles, though the initial grains structure remains mostly intact.
At 83 GWd/tU, about 40% of the locally created xenon is found in bubbles between 0.57R and the highly developed HBS.
In the range 0.43-0.57R, the smaller amount of xenon measured in the intergranular bubbles does not seem to compensate for the missing gas at the periphery of the grains, so that a small release can be expected from this area.
At the very center of the pellets, large, irregularly shaped, intergranular bubbles form and retain the main part of the unreleased gases. They are no more as highly over-pressurized as they were around 60 GWd/tU for this type of irradiation.
All these examinations have provided valuable data on the complex state of fuel during irradiation. They are critical for a good understanding of following tests results from test reactors or annealing devices.
They especially show the good behavior of these fuels, and exhibit various microstructure at very high burnup, none of which is likely to lead to particular problems during irradiation.
ACKNOWLEDGMENTS
The results presented here have all been obtained within the framework of collaboration between AREVA, Electricité De France (EDF) and the CEA.
REFERENCES
1. L. DESGRANGES, F. Dujet and A. Thouroude, "A new puncturing apparatus optimised for free volume determination." European Workshop on Hot Cell
Laboratories and Remote Handling Windermere
(1998)
2. J. NOIROT, and Al, "Fission-gas inventory in PWR high burnup fuel : experimental characterization and modeling." Proc. of the International topical meeting
on LWR fuel performance Paper 1019 329, Orlando,
USA Fl, (2004).
3. M. VERWERFT, "Multiple voltage electron probe microanalysis of fission-gas bubbles in irradiated
nuclear fuel." Journal of Nuclear Materials 282, 97-111 (2000).
4. L. DESGRANGES, and Al. "A method for the quantification of total xenon concentration in irradiated nuclear fuel with SIMS and EPMA."
Nuclear Instruments and Methods in Physics Research Section B: Beam Interactions with Materials and Atoms 266, 147-154 (2008).
5. J. NOIROT, L. Desgranges, and J. Lamontagne, "Detailed characterisations of high burn-up structures in oxide fuels." Journal of Nuclear Materials 372, 318-339 (2008).
6. R. MANZEL and C.T. Walker, "EPMA and SEM of fuel samples from PWR rods with an average burn-up of around 100 MWd/kgHM." Journal of Nuclear
Materials 301, 170-182 (2002).
7. W. GOLL, and Al, "UO2 Fuel Behaviour at Rod
Burn-ups up to 105 MWd/kgHM A Review of 10 Years of High Burn-up Examinations Commissioned by AREVA NP." atw - Int. J. Nucl. Power 52, 95 (2007). 8. A. ROMANO, M.I. Horvath, R Restani, "Evolution of
porosity in the high-burnup fuel structure." Journal of