HAL Id: cea-02489499
https://hal-cea.archives-ouvertes.fr/cea-02489499
Submitted on 24 Feb 2020HAL is a multi-disciplinary open access
archive for the deposit and dissemination of sci-entific research documents, whether they are pub-lished or not. The documents may come from teaching and research institutions in France or abroad, or from public or private research centers.
L’archive ouverte pluridisciplinaire HAL, est destinée au dépôt et à la diffusion de documents scientifiques de niveau recherche, publiés ou non, émanant des établissements d’enseignement et de recherche français ou étrangers, des laboratoires publics ou privés.
B. Richard, M. Fontan, J. Mazars, F. Voldoire, T. Chaudat, N. Bonfils, S.
Abouri
To cite this version:
B. Richard, M. Fontan, J. Mazars, F. Voldoire, T. Chaudat, et al.. Smart 2013 overview and lessons learnt from the international benchmark. SMIRT23 - Structural Mechanics in Reactor Technology, Aug 2015, Manchester, United Kingdom. �cea-02489499�
Transactions, SMiRT-23
Manchester, United Kingdom - August 10-14, 2015 Division VII: Safety, reliability, risk and margins
Paper 2014/11/502
SMART 2013: OVERVIEW AND LESSONS LEARNT FROM THE
INTERNATIONAL BENCHMARK
Benjamin Richard1, Maxime Fontan2, Jacky Mazars3, François Voldoire4, Thierry Chaudat5, Nicolas Bonfils6, Salim Abouri7
1
Research engineer, CEA, DEN, DANS, DM2S, SEMT, Laboratoire d’Etudes de Mécanique Sismique, F-91191, Gif sur Yvette, France.
2
Engineer, OXAND-FRANCE, France.
3
Professor Emeritus, Grenoble Alpes University, France
4
Senior researcher, EDF, DR&D, Acoustics and Mechanical Analysis Department. 1 avenue du Général de Gaulle, F-92141 Clamart, France.
5 Test engineer, CEA, DEN, DANS, DM2S, SEMT, Laboratoire d’Etudes de Mécanique Sismique,
F-91191, Gif sur Yvette, France.
6
Engineer, EDF, SEPTEN, Dynamic and Earthquake Engineering Group. 12-14 avenue Dutriévoz, F-69628 Villeurbanne, France.
7
Engineer, EDF, SEPTEN, Dynamic and Earthquake Engineering Group. 12-14 avenue Dutriévoz, F-69628 Villeurbanne, France.
ABSTRACT
This paper aims at giving an overview of the main findings and a summary of the results obtained within the framework of the International Benchmark SMART 2013, jointly organized by the CEA, EDF under the supervision of the IAEA. The benchmark, devoted to the Seismic design and best-estimate Methods Assessment for Reinforced concrete buildings subjected to Torsion and nonlinear effect, was split into four stages. The first stage allowed characterizing the nonlinear constitutive laws used in the best-estimate approaches. The second stage aimed at calibrating the numerical models. As for the third stage, it was devoted to blind nonlinear dynamic computations when a RC mock-up, representing a 1:4 scaled part of a typical nuclear electrical building, is subjected to strong input ground motions. In the last stage, the influence of both the material nonlinearities and the methodologies used to compute the fragility curves were analysed. From the analysis of the results obtained by all the participants, the following conclusions have been drawn: (i) significant improvements have been made on the way of controlling the boundary conditions when simulating high intensity shaking table tests involving a complex RC specimen, (ii) the numerical models were able to capture the peak frequency shifts, (iii) within the framework of the considered seismic scenario, the aftershock did not lead to additional damage, (iv) a satisfactory level of available seismic margin is confirmed with respect to the design of such building. Finally, it appears that SMART 2013 research program has succeeded not only in showing the robustness of a complex nuclear RC structure designed according to the current French practices but also in assessing the improvements made for in terms of best-estimate approaches and description of uncertainties when dealing with probabilistic vulnerability analysis.
INTRODUCTION
Due to their crucial role in ensuring energy production and safety requirements, nuclear buildings should be able to cope with specific loadings that may occur in extreme situations. For instance, these buildings should be able to undertake earthquakes or flooding induced loadings. Recent international regulatory standards recommend designing reinforced concrete (RC) buildings devoted to nuclear activities as the assembly of shear walls and frames. This design allows reducing the development of damage during high intensity extreme loadings such as the ones aforementioned. When this type of structure is regular or even
slightly irregular, a consensus on the confidence level related to the assessment methodologies is nowadays accepted in the international community. However, the case of highly irregular frame-wall structures needs to be investigated, especially in the nonlinear behaviour range. Indeed, geometric irregularities may lead to three-dimensional effects such as torsion coupled with bending, especially when the structure exhibits a non-negligible eccentricity between the center of torsion and the center of mass.
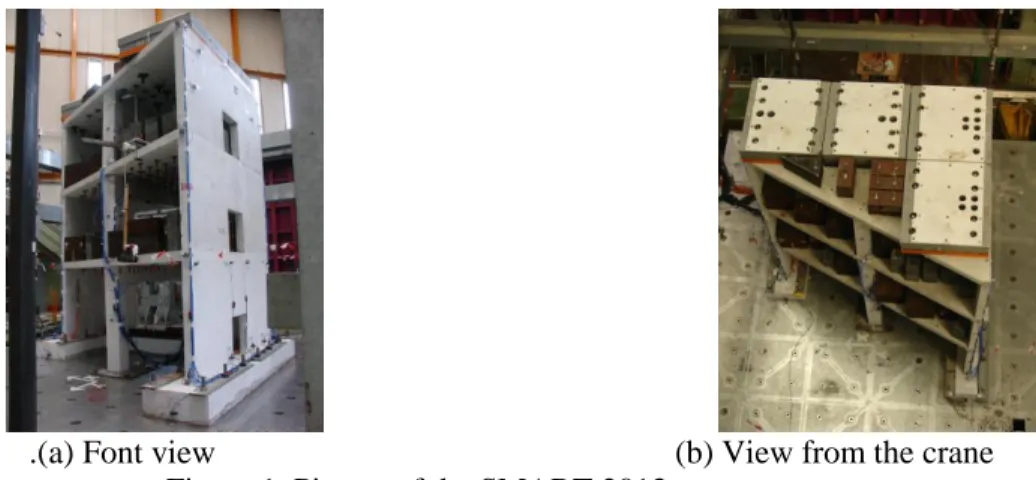
.(a) Font view (b) View from the crane
Figure 1. Picture of the SMART 2013 structure
In 2006, the Seismic Design and Best-Estimate Methods Assessment for Reinforced Concrete Building Subjected to Torsion and Nonlinear Effect (SMART 2008) research project joining the CEA and Electricité de France (EDF) and partially endorsed by the International Atomic Energy Agency (IAEA) was launched. This project was composed of two main parts: a large experimental campaign was carried out on a strongly irregular RC specimen (cf. figure 1) and then, an international numerical benchmark was completed. The RC specimen was designed in agreement with the French current nuclear engineering practice. The considered design spectrum corresponded to a seismic loading of a low to medium seismic area, anchored at a Peak Ground Acceleration (PGA) equal to 0.2 g. Increasing synthetic seismic inputs to an over-design level (maximum PGA equal to 0.9 g) were applied in order to quantify the seismic margins. It came out that when low-damage level is allowed in the specimen, both structural and local failure criteria led to seismic margins close to 2. In addition, the benchmark exercise showed that the seismic margins may be higher than 5 if an extensive damage level is allowed. It was also demonstrated that the assessment methodologies used by the benchmark participants could be considered as being relevant; not only when the seismic loading is close to the design level but also when overdesign seismic loadings were applied to the RC specimen (Richard et al, 2015). It is important to notice that the seismic loading was composed of several synthetic signals with amplified spectra. Despite the improvements made, several questions arose, such as the quantification of the robustness of a nuclear type structure regarding extreme natural seismic scenario. This observation led CEA and EDF to start a new research program, called SMART 2013, in which the same type of wall-based asymmetrical structure as the one used in SMART 2008 was tested. The decision to use the experimental results to feed a numerical benchmark was made. However, the structure of the benchmark exercise was significantly modified with respect to the one considered in 2008, allowing addressing the crucial issue of the predictive capabilities of the advanced nonlinear assessment methodologies in the case of an extreme and realistic seismic loading scenario. The SMART 2013 International Benchmark was organized between 2012 and 2014; 42 participating teams, from many bodies in the world, were registered. The SMART 2013 International Benchmark was composed of four stages and ended with a scientific workshop held in Saclay from the 25th to the 27th of November 2014. The objectives of the benchmark were (i) to assess the capabilities of advanced best-estimate methods in predicting the seismic response of a complex RC specimen, subjected to overdesign dynamic loadings that may occur in extreme events; (ii) to assess the capabilities of nonlinear numerical models to capture the structural damage from a natural seismic scenario composed by a main shock and an aftershock in a satisfactory way for a given magnitude/distance couple, and (iii) to
23rd Conference on Structural Mechanics in Reactor Technology Manchester, United Kingdom - August 10-14, 2015 Division VII: Safety, reliability, risk and margins improve the use of probabilistic methodologies addressing random and epistemic uncertainties to estimate the fragility curves. To reach these objectives, an extensive experimental campaign on a RC specimen was designed according to similar and improved assumptions as the ones considered within the framework of SMART 2008 joint project. Stage 1 was devoted to the characterization of the numerical model used by all the participating teams. Several data regarding the spatial/time discretization, the time integration methodologies, some elementary numerical tests on RC constitutive laws to be used and the way of taking the boundary conditions into account were asked to the participants. Stage 2 aimed at calibrating the numerical model in the elastic range. In order to reach this objective, modal analyses considering various boundary conditions and transient analysis were required. Only two low-intensity seismic loadings, with Peak Ground Acceleration (PGA) equal to 0.1 g, were considered: a random signal (RUN#6) and a synthetic seismic signal (RUN#7) corresponding to 50% of the design signal. Both seismic inputs and outputs were provided to the participants. In stage 3, blind nonlinear dynamic computations for medium to high-intensity seismic loading (PGA ranging from 0.2 to 1.78 g) were asked to the participants. The nonlinear analysis of a sequence of seven seismic loadings, two being optional, was required. Only the seismic inputs were provided to the participants. The measured outputs were available only at the end of the benchmark. Finally, stage 4 was devoted to a numerical vulnerability analysis of the RC specimen within a probabilistic framework addressing random and epistemic uncertainties. The purpose was to assess the effect of the type of uncertainties on the fragility curves considering various failure criteria. First, this paper will present an overview of the work carried out within the framework of the SMART 2013 international benchmark. Then, the main results will be briefly presented before drawing conclusions in the perspective of further work. To reach the aforementioned objectives, this report is outlined as follows. In a first part, the output results from the international benchmark will be emphasized. The main outputs from each stage will be given and discussed. After a description of the low-intensity output results, the predictive capabilities of the nonlinear numerical models will be discussed by means of experimental/numerical comparisons of some indicators. The influence of both material nonlinearities and numerical methodology to estimate the fragility curves will be also analyzed. In a second part, the benchmark outputs will be analyzed to derive their capabilities in assessing the structural damage level of the RC specimen in case of extreme seismic input ground motions. A specific attention will be paid to the assessment of the damaging effect of the aftershock considered in the seismic scenario. Both structural and local damage indicators will be considered. Finally, the main insights and lessons drawn from the SMART 2013 benchmark will be summed up.
OVERVIEW OF STAGE #1
The work asked to the participants in stage 1 aimed at describing their numerical model by means of various items related to the spatial discretization, the damping model used, the boundary conditions and the way of prescribing the seismic loading. Specific information was required in order to describe the constitutive laws used to represent the behaviour of concrete, reinforcing steel and steel/concrete interface, and the cyclic response of a RC representative volume element (RVE) as accurately as possible. In this section, the key results will be given and discussed.
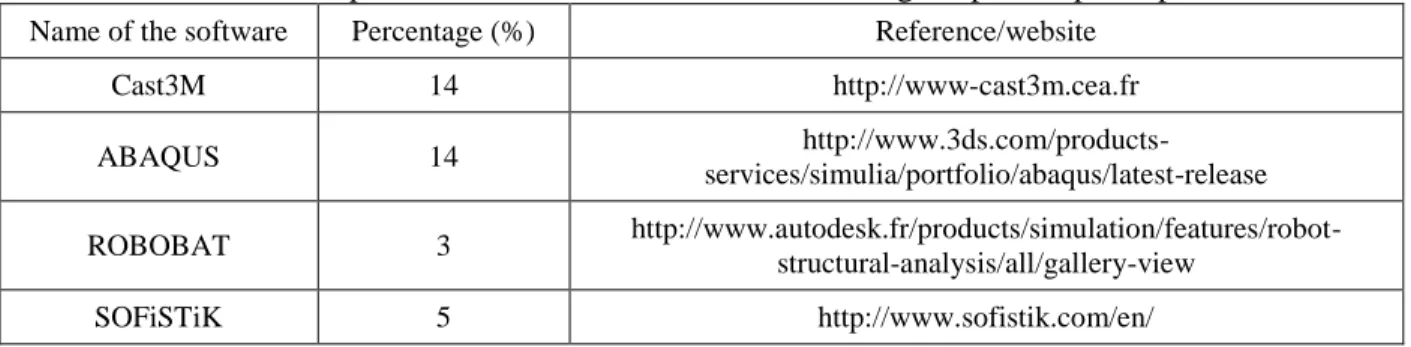
Table 1: Computational software and ratio of use among the pool of participants. Name of the software Percentage (%) Reference/website
Cast3M 14 http://www-cast3m.cea.fr ABAQUS 14 http://www.3ds.com/products-services/simulia/portfolio/abaqus/latest-release ROBOBAT 3 http://www.autodesk.fr/products/simulation/features/robot-structural-analysis/all/gallery-view SOFiSTiK 5 http://www.sofistik.com/en/
SAP2000 11 http://www.csiamerica.com/products/sap2000
Opensees 5 http://opensees.berkeley.edu/
SeismoStruct 3 http://www.seismosoft.com/en/seismostruct.aspx
Solvia 3 http://www.solvia.com/
Discrete Model 3 Yamamoto et al, 2003.
Code Aster 14 http://www.code-aster.org/V2/spip.php?rubrique2
ANSYS 16 http://www.ansys.com/
DIANA 3 http://tnodiana.com/
Perform3D 3 http://www.csiamerica.com/products/perform-3d Zeus NL 3 http://mae.cee.illinois.edu/software/software_zeusnl.html
ATENA 3 http://www.cervenka.cz/products/atena/
In order to describe the mechanical behaviour of concrete, about 50 items were suggested. Around 40 participants answered the description of concrete modeling. The answers were classified according to the participants’ origins to point out any trend. The answers from the participants are shown in Figure . From the information provided by the participants, it can be assessed that the key mechanisms considered in the constitutive law used to describe concrete were tension and compression softening due to the stiffness degradation. Some mechanisms such as the permanent strains or the concrete heterogeneity do not seem to be crucial to be taken into account in the constitutive laws. One can observe differences in the different descriptions of the models developed by the participants, especially regarding the stiffness degradation description that drives the concrete mechanical behaviour during high intensity loadings. This stiffness degradation was not taken into account by all the participants. Indeed, some of them chose to keep a linear elastic approach or to use an elastic plastic approach. Finally, it is necessary to point out that the complexity of the constitutive models used to describe nonlinear mechanisms does not depend on the participants’ origin, since a similar trend was observed whatever their origin.
100% 50% Compressive strength Tensile strength Biaxial stress Triaxial stress Stiffness degradation Softening Localization phenomenon Permanent strain Loading rate Hysteric loops Concrete heterogeneity Isotropy Anisotropy Unilateral effect Induced anisotropy Nuclear institutions Engineering offices Academics
Figure 2. Key mechanisms used by participants in connection with their origin to describe the concrete behaviour.
10 local tests were required to be performed by the participants to describe the mechanical behaviour of the different materials. More than 70% of the participants performed these local tests. However, the RC tests were the less performed, probably due to the numerical difficulty to carry out the ones involving pure shear loading. Only the result related to the cyclic loading tests carried out on a RC RVE is described
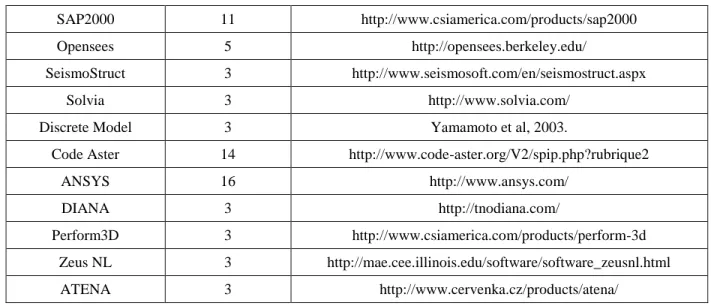
23rd Conference on Structural Mechanics in Reactor Technology Manchester, United Kingdom - August 10-14, 2015 Division VII: Safety, reliability, risk and margins in the following since they offer a satisfactory insight into the constitutive laws considered by the participants to represent RC. The RC1 local test aims at studying the uniaxial response of a RC RVE subjected to a cyclic loading especially, the resulting behaviour from both concrete and steel laws. Only two participants used an integrated RC constitutive law based on homogenization principles. This observation may lead to think this modeling practice is not common and should be more shared among the community. The loading path is shown in Figure 3.
Figure 3. Boundary conditions and cyclic loading path of the local test RC1 on a RC RVE.
The results from the participants are shown in Figure 4. It can be noticed that the maximum prescribed displacement exceeds the concrete elastic strain in tension. Therefore, the remaining mechanical behaviour is mainly driven by the steel behaviour and the tension stiffening effect. In addition, some models can describe crack closure and allow recovering a quasi-fully stiffness when switching from tension to compression. The test ends when it reaches a strain equal to zero. As the steel has previously exceeded its yield stress, plastic strains can be observed. Therefore, a residual tensile stress state is necessary to reach a strain equal to zero. Despite the fact that the scatter was important, it is interesting to point out that most of the participants considered a quite sophisticated nonlinear description of the RC RVE allowing a description close to failure. This is in agreement with the trend noticed in the case of local test C1 and brings us to assess that the confidence in nonlinear models has increased. The equivalent linear approaches that have been used so far in the engineering community seem to be progressively replaced by nonlinear ones.
-0.02 -0.01 0 0.01 -80 -60 -40 -20 0 20 40 Strain (m/m) S tr e s s ( M P a )
Figure 4. Summary of the uniaxial stress/strain responses of a reinforced concrete RVE subjected to cyclic loading - test RC1.
This stage aimed at giving the participants the opportunity to calibrate the numerical model of the dynamic system, composed of the shaking table and the RC specimen. A two-step calibration process was proposed (i) the calibration of the first three eigenfrequencies and (ii) the dynamic simulation of low intensity time history loadings with peak ground accelerations (PGA) around 0.1g. As shown in Figure 5, 78% of the participants used a proportional damping model, considering both the mass and the initial stiffness matrices. 13% of the participant used a modal damping model whereas only 6% used a modified Rayleigh damping model with mass and tangent stiffness matrices. The proportional Rayleigh damping model was the most used due to the fact it is easy to implement in a structural model and does not lead to numerical instabilities. Nevertheless, let us note that viscous forces appear in both low and high frequency ranges, which may lead to the underestimation of the internal forces in the system.
78%
6% 13% 3%
Rayleigh damping (mass and elastic stiffness) Rayleigh damping (mass and tangent stiffness) Modal damping
Other
Figure 5. Type of damping model.
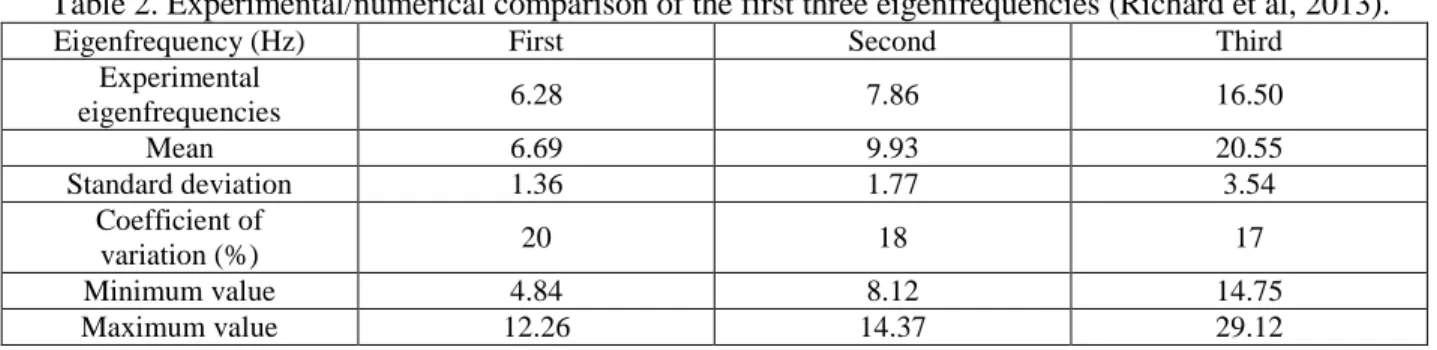
Modal analyses of the numerical RC specimen with three different boundary conditions were asked to the participants. Only the results obtained with the closest boundary conditions to the experimental ones is analyzed in this report. The first three eigenfrequencies were asked considering that the RC specimen was connected to the shaking table model (whatever it is) and was loaded with additional masses. The anchorage points between the actuators and the shaking table are fixed. The participants’ results and the experimental values are shown and compared in Table 2. It is important to remember that the initial modal state of the dynamic system has been identified by using an operational modal identification technique (Richard et al, 2013).
Table 2. Experimental/numerical comparison of the first three eigenfrequencies (Richard et al, 2013).
Eigenfrequency (Hz) First Second Third
Experimental eigenfrequencies 6.28 7.86 16.50 Mean 6.69 9.93 20.55 Standard deviation 1.36 1.77 3.54 Coefficient of variation (%) 20 18 17 Minimum value 4.84 8.12 14.75 Maximum value 12.26 14.37 29.12
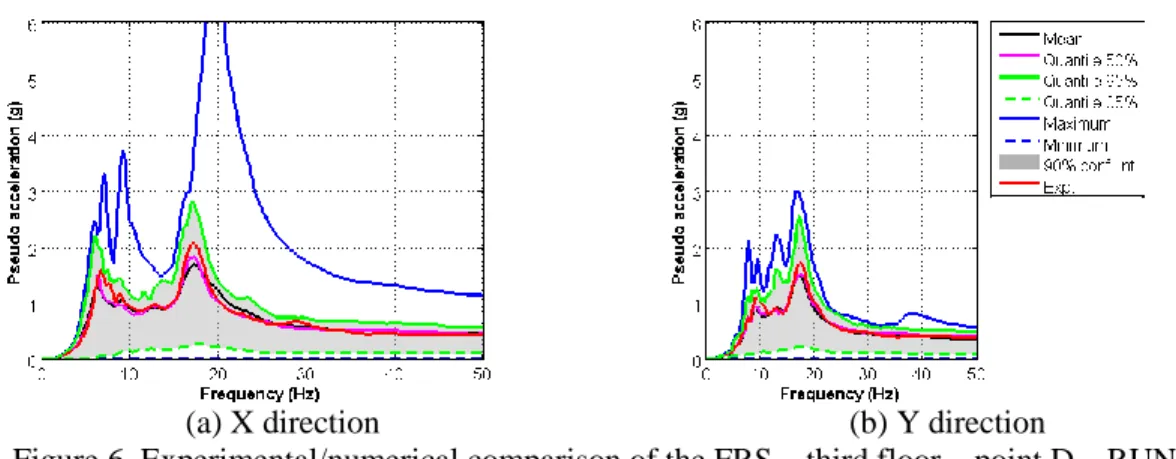
For the first mode, most of the participants identified similar eigenfrequencies. However, for the second and the third mode, the scatter is more important than for the previous one. In case of the third mode, this matter seems to be governed by the way of controlling the shaking table/mock-up interface. Figure 6 shows the statistical results of the floor response spectra (FRS) computed for 5% damping in case of RUN#7 respectively. When looking at the results in the high frequency range, the zero period acceleration (ZPA) appears as being well captured. Furthermore, the scatter is less important in the high frequency range than in the low frequency range.
23rd Conference on Structural Mechanics in Reactor Technology Manchester, United Kingdom - August 10-14, 2015 Division VII: Safety, reliability, risk and margins
(a) X direction (b) Y direction
Figure 6. Experimental/numerical comparison of the FRS – third floor – point D – RUN#7. As a conclusion, the numerical results exhibit a global trend close to the experimental results. Considering that the numerical models behave in the linear domain, it can be noticed that the numerical models are well calibrated when they work in this range. The modal analyses have highlighted an accurate prediction of the first eigenfrequency and an overestimation of the second and third ones, compared with the ones identified experimentally. The FRS, computed by the same methodology available in Cast3M from the participants’ results, are in agreement with the measurements. This conclusion has been explicitly shown in case of the point D located at the third floor, for both X and Y directions, for RUN#7 in this paper. It is worth noticing that a similar trend has been observed in the other observation points studied within the framework of this benchmark. The scatter of the results in terms of FRS and displacement based quantities including displacement time histories is not so high considering RUN#7.
OVERVIEW OF STAGE #3
This stage is dedicated to the study of the structural response of the different models in the nonlinear domain. The participants have performed several numerical simulations following three seismic sequences. Each of these sequences was made of several seismic loadings called RUN. They differed from each other with respect to the intensity of the signal applied to the RC specimen. The three different seismic sequences are the design signal, the Northridge earthquake main shock (Finn et al, 1995) and the Northridge aftershock. In each sequence, several RUNs with an increasing loading factor were applied to the specimen to ensure a robust real time control of the shaking table. The participants are sorted according to the type of FE they used to model the shortest shear wall. The numerical results obtained from the nominal RUNs (RUN#9, #19 and #23) are summarized and compared with experimental measurements. Several mechanical indicators such as the FRS, the ZPA, the maximum displacement along with the levels and the maximum ISD are highlighted considering the different modeling classes defined in section 2.2.1. Nevertheless, it can be noticed that there is only one DM model whereas 2D and 3D models are more numerous, leading to a better representativeness of the models accuracy. The representativeness of the 1D model is also a question although satisfactory results were obtained, depending on the seismic run considered.
Four mechanical indicators (FRS, ZPA, RD and ISD) were studied for each nominal signal of the three seismic sequences: the design level, the Northridge main shock and the Northridge aftershock. The numerical results were sorted according to the modeling class and the main trends are summarized in Table . Considering the previous indicators, it appears that 2D models provide the best results compared to the experimental data and seem to be the most relevant modeling approach in the nonlinear domain even though the scatter may remain important for some indicators. The 3D models also provide some good results, especially to predict accurate displacements but seem less relevant in comparison with DM
models to reproduce the FRS. The DM model also captures the displacements well, especially in the X direction. The 1D model provides results as accurate as the 2D models in terms of FRS and displacements in the Y direction but underestimates the values in the X direction. It is important to mention that the description of the coupling torsion/bending effects is closely dependent on the way of modeling the in-plane shear in the shear walls and, especially, the shortest one. Indeed, the component of the displacement at point D in the X direction is preponderant with respect to the component in the Y direction. They are highly dependent on the modeling strategy adopted to describe the dynamic behavior of the shortest shear wall. This may be explained the differences observed from the class-by-class analysis presented in the previous sections.
Table 3. Identified trends during the analysis of the main signals per modeling classes and specific mechanical indicators – FRS = Floor Response Spectra; ZPA = Zero Period Acceleration; RD = Relative
Displacement; ISD = Inter-Storey Drift. Modeling class 1D 2D 3D DM Design level FRS Accurate prediction in Y direction Accurate prediction in X direction Accurate prediction in Y direction Accurate prediction in Y direction ZPA
Median close to the experimental values and small scatter in
X direction
Larger scatter of the values and low accurate prediction Accurate prediction in both directions RD Accurate prediction in both directions Accurate prediction in X direction Accurate prediction in X direction and underestimate the experimental values in the Y direction ISD Underestimation of the
experimental values
Median close to the experimental values and small scatter
Underestimate the experimental values Accurate prediction in X direction Main shock level FRS Underestimation of the experimental values in the X direction and accurate prediction in
the Y direction
Overestimation in the Y direction Accurate prediction in the X direction ZPA Underestimation in the Y direction and accurate prediction in the X direction
Median close to the experimental values and small scatter
Accurate prediction in the Y
direction
Accurate prediction in the X and Y directions RD
Underestimation in the X and Y directions
Underestimation in the X direction and accurate in the Y
direction
Underestimation in the X direction
ISD
Large scatter around the experimental values Underestimation in the X and Y directions Aftershock level
FRS Accurate in the low frequency range 0-7 Hz and not relevant beyond this frequency. The same trends are noticed in X and Y directions
ZPA Large scatter in X and Y directions – underestimation in both X and Y directions
RD Underestimation of the experimental values in X and Y directions Overestimation in X direction and overestimation in Y direction Accurate prediction in both directions Underestimation of the experimental values in X and Y directions
23rd Conference on Structural Mechanics in Reactor Technology Manchester, United Kingdom - August 10-14, 2015 Division VII: Safety, reliability, risk and margins the experimental values around the experimental values OVERVIEW OF STAGE #4
Stage 4 aimed at addressing the issue of the fragility curves computation taking into account both random and epistemic uncertainties on the numerical models defined on SMART2013 data. In this case, two effects should be studied: (i) the influence of the computational methodology on the fragility curves and (ii) the influence of the material nonlinearities, the methodology to estimate the fragility being the same for all the participants. Among the full set of participants, only 8 provided answers due to the important computational effort required to propagate uncertainties through the structural models. In this paper, an overview of the first sub-stage of stage #4 is given. In the first sub-stage, the participant considered a structural model with a linear elastic constitutive law. The epistemic uncertainties were taken into account by considering as random variables the springs stiffness and the dampers parameters used to model the dynamic interaction with an hypothetical soil domain. The random uncertainties were taken into account through the set of seismic ground motions provided. Due to the linearity of the numerical models, only the damage indicator expressed in term of ISDs has been considered. The fragility curves obtained are shown in Figure 7 for each ground motion intensity measure considered and for each damage thresholds. This observation may lead to think a frequency-based indicator including somehow some physical effects related to the frequency shift due the damage is a key point. Indeed, the nocivity of a given seismic signal is dependent on the structure that is subjected to it. Therefore, taking into account of the structural response in the definition of the chosen ground motion intensity measure seems of primary importance. Furthermore, it is also interesting to notice that although the ASA40 indicator (De Biasio et al, 2014) is structure-dependent, it leads to the least scattered results. This means, the structural response should exhibit a low scatter, which is consistent with respect to the conclusions drawn from the stage 2 of the benchmark. 0 10 20 30 40 0 0.2 0.4 0.6 0.8 1 PGA (ms-2) C P D F Light Controlled Extended 0 50 100 150 200 250 300 0 0.2 0.4 0.6 0.8 1 ASA40 (ms-1) C P D F Light Controlled Extended 0 20 40 60 80 100 0 0.2 0.4 0.6 0.8 1 CAV (ms-3) C P D F Light Controlled Extended
(a) PGA intensity measure (b) ASA40 intensity measure (c) CAV intensity measure Figure 7. Fragility curves – linear case.
CONCLUDING REMARKS
A synthetic presentation of the main results obtained within the framework of the international benchmark SMART 2013 was proposed. The SMART 2013 benchmark started in February 2013 and ended at the end of November 2014 with an International Workshop aiming at sharing about the seismic assessment practices with the international earthquake engineering community. The benchmark has succeeded in gathering 42 teams coming from several different countries throughout the world. The high number of participants highlights the international community’s growing interest in the topics addressed by the benchmark. Four stages with well-defined objectives were proposed to the participants. The first stage aimed at giving the participants the opportunity to characterize the constitutive laws used to feed the
best-estimate approaches considered to make the seismic assessment of the SMART 2013 RC specimen; the second stage was dedicated to the modal and dynamic calibration of the structural models based on low-level seismic input ground motions (with PGAs equal to 0.1g); the third stage was devoted to the blind dynamic computations considering an extreme damaging seismic scenario mainly based on natural records carried out during the Northridge earthquake that took place in 1994 in California, USA. Finally, the objective of the fourth stage was to assess the practices aiming at computing the fragility curves accounting for both random and epistemic uncertainties. The participants’ results have demonstrated the ability of the numerical models to describe the dynamic response of a complex RC specimen subjected to low intensity seismic loadings very accurately. This observation is particularly true when dealing with seismic signals having a rich frequency content in a given range, even if it can be discussed when dealing with random noises. In addition, the results have exhibited a lower scatter level than the ones obtained within the framework of SMART 2008 benchmark. This may be explained by the fact that the shaking table model that was provided was used by the majority of the participants. Another key point lies in the way the boundary conditions were controlled to input the seismic loading in the numerical models. Most of the participants made the choice to apply the displacement time histories measured during the seismic tests at the actuators levels. This strategy allowed describing accurately the complex kinematics of the dynamic system composed of both the RC specimen model and the shaking table FE model. The way of characterizing the seismic loading appears as being a key issue when best estimate assessments have to be made. This issue is addressed in the EDF research program “Seismic Ground Motion Assessment” (SIGMA) (SIGMA, 2015). The main findings and conclusions drawn from the SMART 2013 International Benchmark have been reported in the above sections. The existence of the seismic margins exhibited by numerical simulations on the SMART 2013 RC structure that was designed according to the current French nuclear practices was in agreement with the experiment. The improvements of the best-estimate approaches to make meaningful seismic assessments of complex nuclear RC structure have clearly been highlighted. This trend is in agreement with the recommendations from IAEA that promotes a more systematic use of nonlinear models. The next step will consist in providing to structural engineers more accurate recommendations and guidelines on the way of using best-estimate assessment methodologies to ensure a certain confidence level in the outcome results. This work should clearly help to assess the seismic margins of a given nuclear plant in a more realistic way.
REFERENCES
Finn, W. L., Ventura, C. E., Schuster, N. D. (1995). “Ground motions during the 1994 Northridge earthquake”, Canadian Journal of Civil Engineering, 22(2), 300-315.
De Biasio, M., Grange, S., Dufour, F., Allain, F., Petre-Lazar, I. (2014). “A Simple and Efficient Intensity Measure to Account for Nonlinear Structural Behavior”. Earthquake Spectra, 30(4), 1403-1426. Richard, B., Martinelli, P., Chaudat, T., Voldoire, F., Corus, M., Abouri, S., Bonfils, N. (2015). “SMART
2008: shaking table tests on an asymmetrical reinforced concrete structure”, Engineering
Structures. In submission.
Richard, B., Fontan, M., Mazars, J. (2014). “SMART 2013: overview, synthesis and lessions learnt from
the International Benchmark,” CEA/DEN Technical Note.
DEN/DANS/DM2S/SEMT/EMSI/NT/14-037/A. SIGMA WEBSITE, http://projet-sigma.com/
SMART 2013 WEBSITE. www.smart2013.eu.
Yamamoto, Y., Nakamura, H., Kuroda, I., Furuya, N. (2003). “Simulation of Crack Propagation in RC Shear Wall Using a 3D Rigid-Body-Spring Model with Random Geometry,” Proceeding of the 8th
International Conference on Fracture Mechanics of Concrete and Concrete Structures (FraMCoS-8), (CD-ROM).