HAL Id: hal-02445731
https://hal-cea.archives-ouvertes.fr/hal-02445731
Submitted on 20 Jan 2020HAL is a multi-disciplinary open access archive for the deposit and dissemination of sci-entific research documents, whether they are pub-lished or not. The documents may come from teaching and research institutions in France or abroad, or from public or private research centers.
L’archive ouverte pluridisciplinaire HAL, est destinée au dépôt et à la diffusion de documents scientifiques de niveau recherche, publiés ou non, émanant des établissements d’enseignement et de recherche français ou étrangers, des laboratoires publics ou privés.
the fission rate profile measurements at the JSI TRIGA
Mark II research reactor
Z. Stancar, L. Snoj, L. Barbot
To cite this version:
Z. Stancar, L. Snoj, L. Barbot. Evaluation of biases and experimental uncertainties of the fission rate profile measurements at the JSI TRIGA Mark II research reactor. International Conference on Research Reactors: Safe Management and Effective Utilization, IAEA, Nov 2015, Vienne, Austria. �hal-02445731�
Evaluation of biases and experimental uncertainties of the fission rate
profile measurements at the JSI TRIGA Mark II research reactor
Ž. Štancar1, L. Snoj1, L. Barbot2
1Jožef Stefan Institute (JSI), Jamova cesta 39, SI-1000 Ljubljana, Slovenia
2CEA, DEN, DER, Instrumentation Sensors and Dosimetry Laboratory, Cadarache, F-13108, Saint-Paul-Lez-Durance, France
E-mail contact of main author: ziga.stancar@ijs.si
Abstract. The paper focuses on a validation experiment performed at the JSI TRIGA research reactor using two absolutely calibrated CEA developed miniature fission chambers. These were used to measure a set of axial fission rate profiles through the height of the reactor core which were compared to reaction rate profiles computed using the Monte Carlo method. The purpose of the paper is to describe the support calculations and methodology used in the evaluation of the experimental and computational biases and uncertainties. This includes the study of the effect of the fission chamber structure and the aluminum guide tubes used for in-core insertion on the fission rate measurements as well as a detailed description of the influence of fuel material data error and fuel burn-up on the experimental uncertainty and computational biases. It is shown that the insertion of fission chambers and guide tubes into the core of the TRIGA reactor significantly influences the local neutron spectrum and consequently the fission rate measurements – one can observe an up to 15 % decrease. A similar effect was recorded when modelling the fuel burnup, where a 10 % deficit of 235U mass results in an approximately 10 % decrease in fission rates.
Key Words: TRIGA reactor, fission chamber, fission rate, experimental uncertainty.
1. Introduction
The utilization of the Jožef Stefan Institute (JSI) TRIGA Mark II research reactor ranges from education and training, irradiation of biological and fusion materials, radiation hardness studies to the testing of new nuclear detectors, verifications of nuclear data libraries and computer code validations [1]. Monte Carlo neutron transport calculations play an ever-growing role in the optimization and safety assessments of these experiments, both before and after their execution. Therefore a detailed computational model of the TRIGA reactor has been developed at the JSI Reactor physics department and is continuously used for preliminary calculational support and evaluation of experimental results [2-5]. However to be able to routinely use the Monte Carlo calculation results, it is necessary to validate the computational model against experimental data and assess the uncertainty of the computations.
In this paper a validation experiment performed at the JSI TRIGA research reactor using two absolutely calibrated CEA developed miniature fission chambers – one with a fissionable coating composed mainly of 235U and the second of 238U – is considered [6]. The fission chambers were used to measure a set of axial fission rate profiles through the height of the reactor core at several measuring positions which were compared to reaction rate profiles computed using an advanced Monte Carlo neutron transport code MCNP [7-8]. The purpose of the paper is to describe the support calculations and methodology used in the evaluation of the experimental and computational biases and uncertainties. This includes the study of the effect of the fission chamber structure and the aluminium guide tubes used for in-core insertion on the
fission rate measurements as well as a detailed description of the influence of fuel material data error and fuel burn-up on the experimental and computational uncertainty. It is shown that the insertion of fission chambers and guide tubes into the core of the TRIGA reactor significantly influences the neutron spectrum in the measuring positions and thus the fission rate measurements themselves – the difference between reaction rates in experimental setups without aluminium instrumentation and with it can amount up to 13 % due to the fact that they cause water dislocation and thus decrease neutron thermalization. The contribution of the fuel material data uncertainty to the total experimental uncertainty of the reaction rate measurements was also analysed using a computational approach where perturbations of the fuel density were performed. The effect of the fuel density variations on the axial fission rate profiles is presented in the paper. Since the support Monte Carlo calculations were performed using a reactor model with fresh fuel, additional computations to investigate the effect of core burn-up on the fission rates were made. In the study the average burnup of individual fuel elements, ranging from 0.6 MWd to 4.9 MWd, was calculated with which the axially dependent isotopic composition of the burnt fuel meat was assessed. In the paper a comparison of fission rate profiles using fresh and burnt fuel is presented where it can be seen that the differences are greatest at the centre of the active part of the fuel, where burnup is highest – it is shown that a 10 % deficit of 235U mass results in an approximately 10 % decrease of fission reaction rate.
2. Measurements and calculations of fission rate profiles
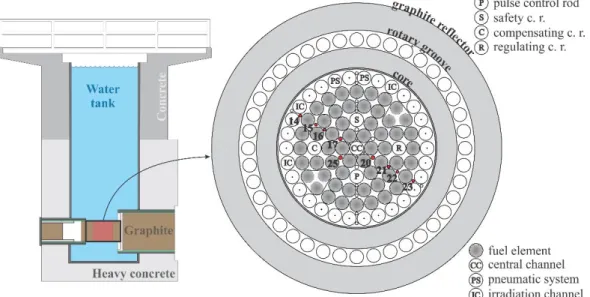
The experiment was performed at the JSI TRIGA Mark II reactor, which is a pool type light-water reactor that can operate at a maximum steady state power of 250 kW. The core is submerged into a 6.25 m high and 2 m wide aluminium tank filled with water and has an annular configuration, consisting of six concentric rings, where approximately 60 cylindrical fuel rods clad with stainless steel are positioned. The fuel material is a homogeneous mixture of 88 wt \% ZrH and 12 wt \% uranium with 20 % enrichment. The core comprises two 1.9 cm thick aluminium supporting grids in which holes of different diameters are drilled. These serve the purpose of positioning the fuel elements, control rods and additional nuclear instrumentation. In total there are 91 locations for fuel elements and additional 26 smaller holes, 9 of which were used for the insertion of the fission chambers. The core is surrounded by a circular graphite reflector which contains a rotary specimen rack, as can be seen in FIG. 1.
FIG. 1. Side view of the TRIGA Mark II reactor on the left with a detailed top view of the reactor core, the surrounding graphite reflector and measuring positions on the right.
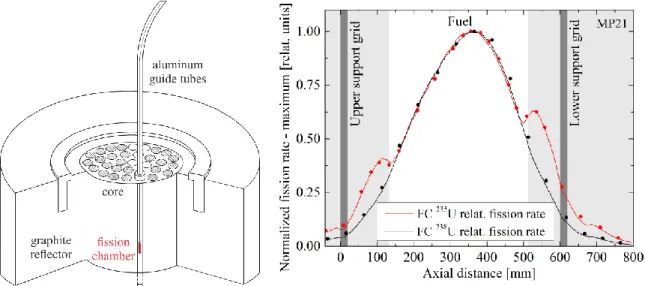
Two miniature watertight fission chambers, manufactured by CEA Cadarache, were used to perform the experiment [6]. They were constructed of stainless steel and filled with a gaseous mixture of argon and nitrogen. Displaying a cylindrical shape with a 3 mm diameter and 4 mm active part length, the fission chambers differed in the type and amount of fissionable material deposited on the walls of the active part. One had a fissionable coating composed mainly of 235U (98.490 % isotopic) and the other of 238U (99.964 % isotopic). These were inserted into the core using specially adapted aluminium guide tubes, which are depicted in FIG. 2. The outer diameter of the guide tubes varied from 8 to 10 mm which enabled their positioning in the small measuring position holes of the core. Nine of these in-core positions were used in the experiment, namely the MP 14, 15, 16, 17, 20, 21, 22, 23, 25, which can be seen denoted with red in the scheme of top view of the core in FIG. 1. The axial position of the chambers was controlled by a pneumatic positioning system – thus fission reaction rate measurements at 24 axial positions were performed, where the height of the chambers was measured relative to the bottom of the aluminium guide tubes. Before the execution of measurements the fission chamber response linearity was tested, where it was found that for the 235U chamber the response was linear for reactor power of around 100 W and for 238U chamber at 1000 W. The axial scans were consequently recorded at respective reactor power levels.
FIG. 2. Left: Sketch of the experimental setup for the fission chambers fission rate measurements using aluminium guide tubes for in-core insertion. Right: Normalized fission rate profiles for two fission chambers determined by measurements (dots) and Monte Carlo calculations (line) for MP21.
The experimental configuration including the reactor core, its surroundings and the auxiliary instrumentation was modelled in detailed with the Monte Carlo method and calculations of fission rate profiles were performed using a state-of-the-art code MCNP 6.1 [7] and the ENDF/B-VII.1 nuclear data library [9]. The reaction rates were computed and averaged over a 4 mm area representing the active part of the fission chambers using 1 mm axial steps through the height of the reactor. The measured and calculated profiles for both fission chambers were compared and exhibit good agreement for all 9 measuring positions. Two normalized reaction rate distributions for measuring position 21 can be seen on the right-hand side of FIG. 2, where measured values are denoted with dots and Monte Carlo calculations are represented by the continuous line. The axial distance is measured relative to the top of the upper support grid, which is, together with the lower support grid, denoted with the dark grey lines. The location of the active part of the fuel element is denoted with the white rectangle.
3. Experimental bias – aluminium guide tubes
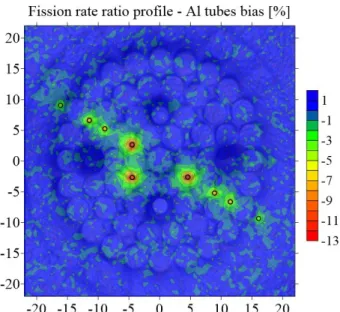
The aim of the experiment performed with the miniature fission chambers was to measure axial distributions of fission rates at different positions in the reactor core. Namely the absolute values of in-core fission rate yield information that can be used to assess different reactor parameters, for example the reactor thermal power or the average deposited energy per fission event. Since the manipulation of the fission chambers had to be performed from the reactor platform, i.e. 5 m above the submerged core, aluminium guide tubes had to be utilized to increase the precision of the chamber’s positioning. The insertion of the tubes introduced an experimental bias due to the fact that they alter the composition of the material in the vicinity of the fission chambers. Although aluminium is neither a good neutron absorber nor moderator, it displaces water surrounding the fission chambers, which significantly affects the local neutron spectrum. A smaller portion of thermal neutrons and a higher share of fast neutrons is thus expected to penetrate the tubes. In order to assess the effect of the aluminium guides on the response of the fission chambers Monte Carlo calculations were performed – in the first step the fission rates in an unbiased instrumentation-free core were calculated upon which the guide tubes were added to the model and the computations repeated. The ratio of fission rates computed with and without the aluminium tubes was calculated and is shown in the form of a profile at reactor core mid-plain in FIG. 3.
FIG. 3. Profile of the relative difference between the computed reaction rates with aluminium guide tubes and without them at mid-plane of the reactor core. Measures of the core are in centimetres.
As can be seen in FIG. 3 the presence of aluminium guide tubes results in significant changes of the fission rates around the measuring positions (denoted with black circles). As expected the tubes induce a reduction in neutron thermalization which results in a local increase of the number of fast neutrons compared to an instrumentation-free core. The rate of 235U fissions, which is the main isotope contributor to the fission chamber signal, is consequently lowered. It can be observed that the decrease in fission chamber signal is largest, i.e. approximately 13 %, at measuring positions closest to the centre of the core, which is a consequence of an initially faster neutron spectrum. With the increase of ambient neutron slowdown toward the edges of the core the effect of aluminium tubes on the fission rate is becoming less dominant, reaching a value of around - 2 % at the outermost measuring positions. Thus if one wanted to obtain an absolute value of the reaction rate in the core it would have to be multiplied with the inverse of the calculated ratio.
4. Experimental uncertainty – fuel composition
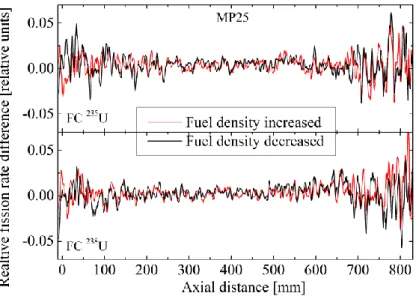
The contribution of the uncertainty of fuel composition data to the total experimental uncertainty was studied through the use of the Monte Carlo computational model of the reactor. First the mass of uranium (both total yield and 235U fraction) in a single fuel element was calculated through the averaging of individual mass data of 40 fuel elements [1]. The total mass of uranium isotopes was calculated to be 278 g for standard fuel elements and 236 g for the fuelled follower control rods. The relative errors of the averaged quantities are of the order of one percent, which indicates that the mass of uranium varies only slightly between different fuel elements. The influence of fuel uranium mass uncertainty was then studied through the variation of the density of fuel material in the computational model. It was postulated that the uranium mass uncertainty affects the weight percent of uranium fuel inside the U-ZrH fuel material. As stated the reported uncertainty of uranium mass is different for fuel elements and fueled-follower control rods and has a value of around 0.9 % for the fuel elements and 1.5 % for the fueled-follower control rods [1]. In the calculations the density of the fuel material was increased and decreased according to the change in the postulated uranium weight percent. The effect on the fission reaction rates for both 235U and 238U fission chambers inside various measuring positions was studied. Values of the fuel meat atomic density used in the original calculation were ρn = 0.0916135·1024 atoms/cm3 for fuel elements and ρn = 0.0933236·1024 atoms/cm3 for fueled-follower control rods. The perturbed fission rate results were compared to the original computations where it was found that the differences between the three scenarios are small, mostly of the order of the statistical uncertainty of the computations. Discrepancies display an axial dependency, being smallest in the area of the active part of the fuel at around 0.5 % and largest at the upper and lower supporting grid of the core with values of up to 5 %, which is a consequence of the statistical error of the Monte Carlo calculations. Graphs in FIG.
4 display the ratio between the axial reaction rate profiles computed for the reported fuel
composition and the perturbed values, where the black continuous line denotes the results with increased fuel density and the red line with decreased fuel density. It is evident that the contribution of the fuel composition uncertainty to the total experimental error is small with values of around 1 % if averaging over the whole height of the reactor core is performed.
FIG. 4. Axial distribution of the relative difference between fission rate calculations performed with the reference model and the model exhibiting perturbed fuel density at measuring positions MP25.
5. Computational bias – fuel burnup
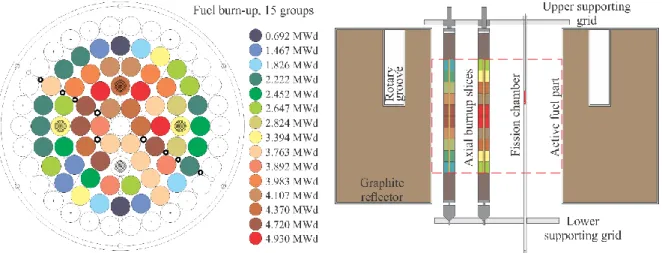
Due to low average burnup of fuel (< 5 MWd) in the TRIGA reactor the basic Monte Carlo computational model used in the evaluation process of the fission rate experiment contained fresh fuel, which is a homogenous mixture of uranium and ZrH. However in an effort to identify major computational biases a detailed study of the TRIGA fuel burnup and its effects on the neutronic properties of the core was conducted. In the first step an in-house developed TRIGLAV software was used, which is a program package intended specifically for reactor core management in the TRIGA Mark II research reactor [10]. In order to calculate the burn-up of individual fuel elements at the time of the execution of the fission chamber experiment, the operating time of the reactor up to the specific date had to be estimated. The JSI TRIGA reactor does not operate continuously, which means that the operating power and duration are strongly dependent on the required conditions in the core which differ significantly in various experiments. An approximate estimate of the total thermal power produced by the reactor since its reconstruction in 1991 was obtained from the reactor operation logbooks, where it was found that after 20 years of operation the average burn-up of the TRIGA fuel is approximately 2.2 MWd, which corresponds to around 25 days of operation at full steady state power of 250 kW per year. The operation time was input into the TRIGLAV program which returned burnup values for each of the 56 fuel elements that were part of the core configuration. The core elements were distributed into 15 groups depending on the individual burnup levels, shown left in FIG. 5, with their burnups varying from 0.7 MWd to 4.9 MWd.
FIG. 5. Left: Top view of the TRIGA core denoting the positions of fuel elements and their burn-up in MWd.Right: Scheme of the Monte Carlo model of the TRIGA rector core depicting the different radial
and axial levels of fuel meat burnup together with the fission chamber and aluminium guide tube.
The change in isotopic composition of the burnt fuel was calculated using the ORIGEN 2.2 computer code in combination with the enclosed PWR libraries [11]. Although these libraries are not an ideal solution due to differences between the spectra in a PWR and a TRIGA reactor, they are adequate for an assessment study. The burnup levels of a specific element group were input into the code, calculating the masses of fission products in the fuel meat. Special attention was paid to the production of isotopes which significantly affect the effective cross section of the fuel, with either absorption, scattering or fission reactions. It was found that the maximum value of fuel burnup found in the core of 5 MWd corresponds to approximately 14 % 235U weight deficit. The fuel in the elements was additionally divided into 10 axial slices corresponding to the axial shape of the neutron flux, i.e. burnup being higher at the centre of the active part of the fuel and decreasing towards the upper and lower support grid of the reactor,
as shown on the right-hand side of FIG. 5. This was done using the Monte Carlo flux distribution calculations – the integral of flux in each of the equidistant axial parts was calculated and weighted relative to the average flux in the full fuel volume. The calculated material composition was included in the Monte Carlo model of the TRIGA reactor and axial profiles of fission rates at different locations in the core were calculated. The results gained using the model with burnt fuel was compared to the fresh core computations – the relative difference between them is shown in FIG. 6.
FIG. 6. Relative difference between fission rate profiles calculated with burnt-up fuel and fresh fuel at measuring position MP20.
The axial dependence of the fission rate difference on both graphs is comparable – it can be seen that on the upper and lower edge of the core the burnup calculations exhibit higher values compared to those with fresh fuel in contrast with the central area of the core where the active part of the fuel elements is located, where a decrease can be observed. The fission rates in the central region are of lower values due to higher burnup and the implementation of axial burnup dependency. It can also be seen that the discrepancies are higher for the 235U fission chamber, reaching maximum values of approximately 15 % at the core mid-plane of measuring position 20, whereas the differences in the region of the active part of the fuel for the 238U fission chamber are approximately 7 %. It is thus crucial to take the fuel burnup into account when constructing the Monte Carlo model of the TRIGA reactor since it influences the axial shape of the fission rate profiles as well as the absolute values of the computed quantity.
6. Conclusion
The focus of the paper was the description of the methodology used in the evaluation of some of the experimental and computational biases, following the in-core measurements of fission rate axial profiles performed with miniature fission chambers. One of the problems tackled was the experimental bias imposed by the utilization of aluminium guide tubes for precise insertion of the fission chambers into the core of the reactor. For this purpose Monte Carlo computations were performed where two detailed geometric models of the TRIGA reactor were used – one with an instrumentation-free core and one with guide tubes included. The calculated fission rates were compared and it was found that the presence of the tubes significantly influences the neutron spectrum in its immediate surroundings due to water dislocation, resulting in a fission rate decrease from 13 % near the centre of the core to 2 % at the edge of the core. Through fuel
density perturbation the contribution of fuel composition uncertainty to the total experimental uncertainty was studied, where it was found that the effect is small, resulting in an error of around 1 %. The computational bias due to the use of fresh fuel in the Monte Carlo TRIGA model was also estimated with the utilization of three codes, with which the burnup of individual fuel elements and the corresponding isotopic composition were calculated. It was shown that due to approximately 14 % 235U weight deficit at 5 MWd burnup one can record an up to 15 % decrease in the calculated fission rates.
References
[1] JERAJ, R., et al., “TRIGA Mark II Reactor: U(20)-Zirconium Hydride Fuel Rods in Water with Graphite Reflector”, IEU-COMP-THERM-003, International Handbook of Evaluated Criticality Safety Benchmark Experiments, NEA/NSC/DOC(95)03, OECD-NEA (2010).
[2] SNOJ, L., et al., “Calculation of Power Density with MCNP TRIGA Reactor”, Proc. Of the 15th international Conference Nuclear Energy for New Europe, Portorož, Slovenia (2006).
[3] SNOJ, L., et al., “Analysis of neutron flux distribution for the validation of computational methods for the optimization of research reactor utilization”, Appl. Radiat. Isot. 69, 1, (2011) 136-141.
[4] SNOJ, L., et al., “Calculation of kinetic parameters for mixed TRIGA cores with Monte Carlo method”, Ann. Nuc. Energy 37, 2, (2010) 223-229.
[5] RADULOVIĆ, V., et al., “Validation of absolute axial neutron flux distribution calculations with MCNP with 197Au(n,γ)198Au reaction rate distribution measurements at the JSI TRIGA Mark II reactor”, Appl. Radiat. Isot. 84, (2014) 57-65.
[6] GESLOT, B., et. al., “Development and manufacturing of special fission chambers for in-core measurement requirements in nuclear reactor”, Proc. of the International Conference Advancements in Nuclear Instrumentation, Measurements Methods and their Applications 2009, CFP0924I-CDR-11, Marseilles, France (2009).
[7] LOS ALAMOS NATIONAL LABORATORY, “MCNP6 User’s Manual – Code Version 6.1.1 Beta”, LA-CP-14-00745 (2014).
[8] ŠTANCAR, Ž., et al., “Evaluation of Fission Rate Profile Experimental Benchmark at the JSI TRIGA Mark II Reactor Using Monte Carlo Method”, Proc. of ANS MC2015 - Joint International Conference on Mathematics and Computation (M&C), Supercomputing in Nuclear Applications (SNA) and the Monte Carlo (MC) Method, American Nuclear Society, Nashville TN, USA (2015).
[9] CHADWICK, M. B., et al., “ENDF/B-VII.1 Nuclear Data for Science and Technology: Cross Sections, Covariances, Fission Product Yields and Decay Data”, Nuclear Data Sheets, 112, 12, (2011) 2887-2996.
[10] PERŠIČ, A., et al., “TRIGLAV – A Program Package for Research Reactor Calculations”, Jožef Stefan Institute, IJS-DP-7862 (2000).
[11] CROFF, A. G., et al., “ORIGEN2 V2.2: Isotope Generation and Depletion Code, Matrix Exponential Method”, Oak Ridge National Laboratory, CCC-371, Oak Ridge TN, USA (2002).