CHONDROCYTE RESPONSE TO IN VITRO MECHANICAL INJURY AND
CO-CULTURE WITH JOINT CAPSULE TISSUE
JENNIFER H. LEE
B.S.E., Biomedical Engineering, Duke University, 2001
Submitted to the Biological Engineering Division In partial fulfillment of the requirements for the degree of
DOCTOR OF PHILOSOPHY IN BIOENGINEERING at the
MASSACHUSETTS INSTITUTE OF TECHNOLOGY May 2005
Massachusetts Institute of Technology, 2005.
© Massachusetts Institute of Technology, 2005.
Signature of Author
/
Biological Engineering Division
Certified by
Professor
" n J . ins ky, Thesis Supervisor
of Biological, Electrical, and Mechanical Engineering
Accepted by
Ram Sasisekharan, Graduate Program Co-Chairman
Professor of Biological Engineering
OCT 2 2005
THESIS COMMITTEE:
Alan J. Grodzinsky ... Professor of Biological, Electrical, and Mechanical Engineering Massachusetts Institute of Technology
Roger D. Kamm ... ... ... Professor of Biological and Mechanical Engineering Massachusetts Institute of Technology
Christopher Evans ... Professor of Orthopedic Surgery Brigham & Women's Hospital, Harvard Medical School
ABSTRACT
Acute traumatic joint injury in young adults leads to an increased risk for the development of osteoarthritis (OA) later in life irrespective of surgical intervention to stabilize the injured joint. Although the mechanism by which injury leads to joint degeneration remains to be elucidated, several injury-related factors may contribute to the development of OA. These factors include but are not limited to altered mechanical loading and initiation of a cellular response in cartilage or other joint tissues at the time of the injury. Three in vitro models of joint injury were investigated to separately evaluate the effects on cartilage of mechanical overloading and damage to joint capsule and synovial lining. Models of injury included (1) mechanical injury lto cartilage explants alone, (2) co-culture of normal cartilage explants with an excised specimen of joint capsule tissue, and (3) co-culture of mechanically injured cartilage explants with excised joint capsule tissue. These models have been shown previously to result in matrix damage and
decreased biosynthesis by the chondrocytes.
We measured gene expression levels of matrix molecules and matrix proteases and found them to be expressed in control cartilage at levels ranging over five orders of magnitude, and to be differentially regulated in these three models of joint injury. Expression of matrix molecules including collagen II and aggrecan were unaffected by injurious compression or co-culture with joint capsule tissue during the first 24 hours; however, the combination of injurious compression followed by co-culture resulted in a -50% decrease in expression by 24 hours. Matrix proteases aggrecanase-2 (ADAMTS-5) and stromelysin (MMP-3) showed increased expression of 40-250-fold by 12 hours following injurious compression and 6-12-40-250-fold during 24 hours of co-culture with joint capsule tissue. Aggrecanase-1 (ADAMTS-4) and collagenase-3 (MMP-13) showed larger magnitude increases in expression during co-culture (6-8-fold; 6-24 hours) compared to injurious compression (2-4-fold; 6-24 hours). Expression of transcription factors, c-fos and c-jun, was rapidly increased by injurious compression (40-100-fold within one hour) but was less affected by co-culture with joint capsule tissue (increased 3-5-fold; 1-24 hours). Expression level results displayed a general trend toward matrix degradation in the models of joint injury with specific differences apparent between the models. Analysis of matrix protein fragments in the same injury models showed cleavage of aggrecan at the aggrecanase site in the interglobular domain by 16 days following injurious compression and during co-culture with joint capsule tissue. Equilibrium and dynamic stiffness of cartilage explants were decreased by 30-35% immediately after injurious compression but were unaffected through 16 days of co-culture with joint capsule tissue. Specific changes in gene expression and activity of matrix proteases
observed in these injury models may be indicative of some of the molecules responsible in the initial phase of cartilage degradation observed clinically following joint injury.
ACKNOWLEDGEMENTS
I would like to thank Alan Grodzinsky for the freedom to pursue studies as I found them interesting and for all of his help and encouragement along the way. My thesis committee members, Roger and Chris, offered many useful suggestions and challenging questions from my thesis proposal through my thesis defense. As collaborators, Carl Flannery, John Sandy, Ernst Hunziker, Anna Plaas, Mike Lark, Simon Blake, and Xiao-Yu Song supplied experimental expertise, reagents, and guidance that was invaluable for many of the studies conducted in my thesis work. Members of the Grodzinsky Lab made working in the lab as well as lunchtime quite enjoyable. Additionally, Mike DiMicco and John Kisiday, provided much advice and insight from my first days in the lab through writing of this thesis. Finally, I would like to thank my family for all of their support during my years in graduate school.
TABLE OF CONTENTS
CHAPTER 1: INTRODUCTION ... 13
1.1. T H E K N E E ... 13
1.2. CARTILAGE STRUCTURE ... 13
1.3. JOINT CAPSULE, SYNOVIUM, LIGAMENTS ... 15
1.4. OSTEOARTHRITIS ... 16
1.5. CLINICAL JOINT INJURY ... 17
1.6. JOINT INJURY MODEL SYSTEMS ... 18
1.7. THESIS OBJECTIVES ... 19
1.8. REFEREN CES ... 21
CHAPTER 2: MECHANICAL INJURY OF CARTILAGE EXPLANTS CAUSES SPECIFIC TIME DEPENDENT CHANGES IN CHONDROCYTE GENE EXPRESSION ... 24
2.1. INTRODUCTION... 24
2.2. MATERIALS AND METHODS ... 27
2.3. RESULTS ... 31
2.4. DISCUSSION ... 39
2.5. REFEREN CES ... 46
CHAPTER 3: CO-CULTURE OF INJURED OR UNINJURED CARTILAGE WITH JOINT CAPSULE TISSUE LEADS TO SPECIFIC CHANGES IN GENE EXPRESSION LEVELS IN CHONDROCYTES ... 50
3.1. INTRODUCTION... 50
3.2. MATERIALS AND METHODS ... 53
3.3. RESULTS... 58
3.4. D ISC U SSIO N ... 64
CHAPTER 4: CHANGES IN CARTILAGE TISSUE COMPOSITION AND STIFFNESS
FOLLOWING IN VITRO MODELS OF JOINT INJURY ... 81
4.1. IN TRO D U CTIO N ... ... 81
4.2. MATERIALS AND METHODS ... 83
4.3. RESU LTS ... 86
4.4. DISCUSSION ... 92
4.5. REFERENCES ... 95
CHAPTER 5: SUMMARY AND CONCLUSIONS ... 98
APPENDIX A: EXPERIMENTAL PROTOCOLS ... 101
A. 1. INJURIOUS COMPRESSION USING THE INCUDYN ... 101
A.2. JOINT CAPSULE TISSUE HARVEST AND CULTURE ... 103
A.3. REAL-TIME PCR ... 105
A.4. AGGRECAN EXTRACTION, MEDIUM PREPARATION, AND WESTERN BLOTTING ... 109
A.5. MECHANICAL PROPERTY TESTING ... 114
APPENDIX B: SUPPLEMENTARY DATA ... 120
B. 1. REAL-TIME PCR GENE EXPRESSION DATA ... 120
B.2. INTERPRETATION OF RELATIVE GENE EXPRESSION LEVELS ... 126
B.3. WESTERN BLOTS ... 127
B.4. ZYMOGRAMS TO MEASURE MMP-2, MMP-3, AND MMP-9 IN INJURY MODELS ... 131
B.5. HYDROXYPROLINE CONTENT OF CARTILAGE EXPLANTS FOLLOWING MECHANICAL INJURY AND CO-CULTURE WITH JOINT CAPSULE TISSUE ... 134
B.6. GENE EXPRESSION DATA CLUSTERED USING K-MEANS CLUSTERING ... 135
APPENDIX C: PRELIMINARY STUDIES ... 137
C. I. RNA ANALYSIS... 137
APPENDIX D: GRODZINSKY LAB COLLABORATIVE PROJECTS ... 142
I). 1. INVOLVEMENT OF ADAMTS-4 AND MT4-MMP IN AGGRECANOLYSIS OF IL- 1 TREATED BOVINE CARTILAGE (P. PATWARI) ... 142
[).2. EXPRESSION OF DEGRADATIVE ENZYMES IN A DYNAMICALLY LOADED CHONDROCYTE-SEEDED PEPTIDE HYDROGEL (J. KISIDAY) ... 143
[).3. ZYMOGRAPHY ON CONDITIONED MEDIUM SAMPLES IN COLLABORATION WITH THE KURZ LAB (J. FAY, KIEL, GERMANY) ... 145
APPENDIX E: CENTOCOR COLLABORATIVE PROJECTS ... 146
E. 1. INTERACTION BETWEEN IL-1, IL-6, AND MECHANICAL INJURY ... 147
E.2. INTERACTION BETWEEN TNF-a, IL-6, AND MECHANICAL INJURY ...150
E.3. INTERACTION BETWEEN CO-CULTURE, IL-6, AND MECHANICAL INJURY ... 153
E.4. INTERACTION BETWEEN IL-6 AND MECHANICAL INJURY ... 156 E.5. EFFECT OF IL-6 BLOCKADE ON CO-CULTURE OF CARTILAGE WITH JOINT CAPSULE
LIST OF FIGURES
FIGURE 2.1: LOADING DEVICE AND EXAMPLE OF COMPRESSION WAVEFORMS ... 28
FIGURE 2.2: FREE SWELLING EXPRESSION LEVELS OF 24 GENES RANKED BY RELATIVE ABUNDANCE ... 32
FIGURE 2.3: CHANGES IN EXPRESSION LEVEL OF MATRIX MOLECULES, 3-ACTIN, AND GAPDH GENES AFTER INJURIOUS COM PRESSION ... 34
FIGURE 2.4: CHANGES IN EXPRESSION LEVEL OF MATRIX PROTEASES AND TISSUE INHIBITOR OF MATRIX METALLOPROTEASE- AFTER INJURIOUS COMPRESSION ... 35
FIGURE 2.5: CHANGES IN EXPRESSION LEVEL OF TRANSCRIPTION FACTORS AFTER INJURIOUS COMPRESSION ... 36
FIGURE 2.6: CHANGES IN EXPRESSION LEVEL OF GROWTH FACTORS AFTER INJURIOUS COMPRESSION ... 37
FIGURE 2.7: CHANGES IN EXPRESSION LEVEL OF CYTOKINES AFTER INJURIOUS COMPRESSION ... 37
FIGURE 2.8: GROUP EXPRESSION PROFILES GENERATED BY K-MEANS CLUSTERING ... 40
FIGURE 3.1: CHANGES IN EXPRESSION LEVEL OF MATRIX MOLECULES, GAPDH, AND P-ACTIN DURING CO-CULTURE OF UNINJURED AND INJURED CARTILAGE WITH JOINT CAPSULE TISSUE ... 58
FIGURE 3.2: CHANGES IN EXPRESSION LEVEL OF MATRIX PROTEASES DURING CO-CULTURE OF UNINJURED AND INJURED CARTILAGE WITH JOINT CAPSULE TISSUE ... 60
FIGURE 3.3: CHANGES IN EXPRESSION LEVEL OF CYTOKINES AND TGF-3 DURING CO-CULTURE OF UNINJURED AND INJURED CARTILAGE WITH JOINT CAPSULE TISSUE ... 61
FIGURE 3.4: CHANGES IN EXPRESSION LEVEL OF TRANSCRIPTION FACTORS DURING CO-CULTURE OF UNINJURED AND INJURED CARTILAGE WITH JOINT CAPSULE TISSUE ... 62
FIGURE 3.5: WESTERN BLOT FOR AGGRECANASE FRAGMENTS IN IN VITRO MODELS OF JOINT INJURY ... 63
FIGURE 3.6: GROUP EXPRESSION PROFILES GENERATED BY K-MEANS CLUSTERING ... 66
FIGURE 4.1: GLYCOSAMINOGLYCAN (GAG) CONTENT OF CARTILAGE SUBJECTED TO MECHANICAL INJURIOUS COMPRESSION AND CO-CULTURE WITH JOINT CAPSULE TISSUE ... 87
FIGURE 4.2: WESTERN BLOT FOR AGGRECAN CORE PROTEIN IN CARTILAGE TISSUE EXTRACT FOLLOWING MECHANICAL INJURIOUS COMPRESSION AND CO-CULTURE WITH JOINT CAPSULE TISSUE ... 89
FIGURE 4.3: EQUILIBRIUM AND DYNAMIC STIFFNESS OF CARTILAGE FOLLOWING INJURIOUS COMPRESSION AND CO-CULTURE WITH JOINT CAPSULE TISSUE ... 91
FIGURE A. 1: HISTOLOGY OF JOINT CAPSULE TISSUE USED IN CO-CULTURE EXPERIMENTS ... 104
FIGURE B. 1: CHANGES IN EXPRESSION LEVEL OF MATRIX MOLECULES (FIBRONECTIN, FIBROMODULIN, LINK PROTEIN), COLLAGEN I, AND TRANSCRIPTION FACTOR SOX 9 GENES AFTER INJURIOUS COMPRESSION ... 120
FIGURE B.2: CHANGES IN EXPRESSION LEVEL OF MATRIX DEGRADING MOLECULES (MMP- 1, MMP-9. ADAMTS-4)
AND INHIBITOR (TIMP-2) GENES AFTER INJURIOUS COMPRESSION ... 121
FIGURE B.3: CHANGES IN EXPRESSION LEVEL OF MATRIX MOLECULES (FIBRONECTIN, FIBROMODULIN, LINK PROTEIN),
AND COLLAGEN I GENES DURING CO-CULTURE WITH JOINT CAPSULE TISSUE ... 122
FIGURE B.4: CHANGES IN EXPRESSION LEVEL OF MATRIX DEGRADING MOLECULE (MMP-9), AND INHIBITORS
(TIMP-1, TIMP-2) GENES DURING CO-CULTURE WITH JOINT CAPSULE TISSUE ... 123
FIGURE B.5: CHANGES IN EXPRESSION LEVEL OF MATRIX MOLECULES (FIBRONECTIN, FIBROMODULIN, LINK PROTEIN),
AND COLLAGEN I GENES DURING CO-CULTURE WITH JOINT CAPSULE TISSUE FOLLOWING INJURIOUS
MECHANICAL COMPRESSION ... 124
FIGURE B.6: CHANGES IN EXPRESSION LEVEL OF MATRIX DEGRADING MOLECULE (MMP-9), AND INHIBITORS
(TIMP-1, TIMP-2) GENES DURING CO-CULTURE WITH JOINT CAPSULE TISSUE FOLLOWING INJURIOUS MECHANICAL
COMPRESSION ... 125
FIGURE B.7: FREE SWELLING EXPRESSION LEVELS OF 24 GENES RANKED BY RELATIVE ABUNDANCE ... 126
FIGURE B.8: CONDITIONED MEDIUM ANALYSIS FOR AGGRECAN FRAGMENTS WITH INTACT G1 DOMAIN FOLLOWING
TREATMENT WITH IL-l1 a, MECHANICAL INJURY, OR CO-CULTURE WITH JOINT CAPSULE TISSUE ... 127 FIGURE B.9: CONDITIONED MEDIUM ANALYSIS FOR AGGRECAN FRAGMENTS WITH INTACT G3 DOMAIN FOLLOWING
TREATMENT WITH IL- a, MECHANICAL INJURY, OR CO-CULTURE WITH JOINT CAPSULE TISSUE ... 128
FIGURE B. 10: CONDITIONED MEDIUM ANALYSIS FOR AGGRECANASE-2 (ADAMTS-5) FOLLOWING TREATMENT OF
CARTILAGE WITH IL- 1 a, MECHANICAL INJURY, OR CO-CULTURE WITH JOINT CAPSULE TISSUE ... 129
FIGURE B. 11: CONDITIONED MEDIUM ANALYSIS FOR AGGRECANASE- 1 (ADAMTS-4) FOLLOWING TREATMENT OF
CARTILAGE WITH IL- 1 a OR CO-CULTURE WITH JOINT CAPSULE TISSUE ... 130
FIGURE B. 12: CASEIN ZYMOGRAMS ON CONDITIONED MEDIUM FROM CARTILAGE EXPLANTS FOLLOWING MECHANICAL
INJURIOUS COMPRESSION ... 132
FIGURE B. 13: ZYMOGRAMS ON CONDITIONED MEDIUM FROM CARTILAGE EXPLANTS DURING CO-CULTURE WITH JOINT
CAPSULE TISSUE ... 133
FIGURE B. 14: HYDROXYPROLINE CONTENT OF CARTILAGE TISSUE EXPLANTS FOLLOWING MECHANICAL INJURIOUS
COMPRESSION AND CO-CULTURE WITH JOINT CAPSULE TISSUE ... 134
FIGURE B. 15: CLUSTERING ANALYSIS OF GENE EXPRESSION IN CHONDROCYTES DURING CO-CULTURE OF CARTILAGE EXPLANTS WITH JOINT CAPSULE TISSUE ... 135
FIGURE B. 16: CLUSTERING ANALYSIS OF GENE EXPRESSION IN CHONDROCYTES DURING CO-CULTURE OF
FIGURE C. 1: REPRESENTATIVE GRAPH OF BIOANALYZER DATA FROM INITIAL SUBMISSION OF RNA TO THE BIOMICRO
CENTER AT MIT ... 138
FIGURE C.2: REPRESENTATIVE GRAPH OF BIOANALYZER DATA FROM SECOND SUBMISSION TO THE BIOMICRO CENTER
AT MIT AFTER MAKING IMPROVEMENTS TO THE RNA EXTRACTION PROTOCOL ... 138
FIGURE C.3: WESTERN BLOTS FOR AGGRECAN FRAGMENTS ON TISSUE EXTRACTS FROM CARTILAGE TREATED WITH 10
tG/ML RECOMBINANT ADAMTS-4 FOR 16 HOURS ... 141
FIGURE C.4: WESTERN BLOT FOR AGGRECAN FRAGMENTS ON TISSUE EXTRACTS FROM CARTILAGE TREATED WITH 1 MM AMPA TO ACTIVATE MMPS ... 141
FIGURE D. 1: REAL-TIME PCR ANALYSIS OF ADAMTS-4 AND ADAMTS-5 ... 142
FIGURE D.2: REAL-TIME PCR ANALYSIS OF GENE EXPRESSION IN DYNAMICALLY LOADED CHONDROCYTE-SEEDED PEPTIDE HYDROGEL ... 143
FIGURE D.3: FREE SWELLING EXPRESSION LEVELS OF 24 GENES RANKED BY RELATIVE ABUNDANCE IN CHONDROCYTE
SEEDED PEPTIDE HYDROGEL ... 144
FIGURE D.4: CASEIN ZYMOGRAM ON CONDITIONED MEDIUM FROM CARTILAGE EXPLANTS STIMULATED WITH
BACTERIAL SUPERNATANTS ... 145
FIGURE D.5: GELATIN ZYMOGRAM ON CONDITIONED MEDIUM FROM CARTILAGE EXPLANTS STIMULATED WITH
BACTERIAL SUPERNATANTS ... 145
FIGURE E. 1: CUMULATIVE GAG RELEASED TO THE MEDIUM DURING SIX DAYS IN CULTURE WITH COMBINATIONS OF
EXOGENOUS IL-6, IL-la, AND MECHANICAL INJURIOUS COMPRESSION ... 1... 147
FIGURE E.2: BIOSYNTHESIS RATES ON DAYS 5-6 IN RESPONSE TO TREATMENTS WITH EXOGENOUS IL-6, IL- 1 a, AND MECHANICAL INJURIOUS COMPRESSION ... 148
FIGURE E.3: CUMULATIVE GAG RELEASED TO THE MEDIUM DURING SIX DAYS IN CULTURE WITH COMBINATIONS OF
EXOGENOUS IL-6, TNF-a, AND MECHANICAL INJURIOUS COMPRESSION. MEAN±SE, N=4 ... 150 F:GURE E.4: BIOSYNTHESIS RATES ON DAYS 5-6 IN RESPONSE TO TREATMENTS WITH EXOGENOUS IL-6, TNF-a, AND
MECHANICAL INJURIOUS COMPRESSION ... 151
FIGURE E.5: PROLINE INCORPORATION RATE ON DAYS 5-6 IN RESPONSE TO TREATMENTS WITH EXOGENOUS IL-6,
CO-CULTURE WITH JOINT CAPSULE TISSUE, AND MECHANICAL INJURIOUS COMPRESSION ... 153
FIGURE E.6: SULFATE INCORPORATION RATE ON DAYS 5-6 IN RESPONSE TO TREATMENTS WITH EXOGENOUS IL-6, CO-CULTURE WITH JOINT CAPSULE TISSUE, AND MECHANICAL INJURIOUS COMPRESSION ... 154
FIGURE E.7: CUMULATIVE GAG RELEASED TO THE MEDIUM DURING SIX DAYS IN CULTURE WITH COMBINATIONS OF
FIGURE E.8: BIOSYNTHESIS RATES ON DAYS 5-6 IN RESPONSE TO TREATMENTS WITH EXOGENOUS IL-6 AND
MECHANICAL INJURIOUS COMPRESSION ... 157
FIGURE E.9: PROLINE INCORPORATION RATE ON DAYS 5-6 DURING CO-CULTURE WITH JOINT CAPSULE TISSUE AND
TREATMENT WITH A MONOCLONAL ANTIBODY TO IL-6 ... 158
FIGURE E. 10: SULFATE INCORPORATION RATE ON DAYS 5-6 DURING CO-CULTURE WITH JOINT CAPSULE TISSUE AND
TREATMENT WITH A MONOCLONAL ANTIBODY TO IL-6 ... 158
FIGURE E. 1: BIOSYNTHESIS RATES ON DAYS 5-6 DURING CO-CULTURE WITH JOINT CAPSULE TISSUE AND TREATMENT
WITH EITHER A FULL LENGTH MONOCLONAL ANTIBODY TO IL-6 OR THE FAB FRAGMENT OF THE IL-6 ANTIBODY. ... 16 0
LIST OF TABLES
TABLE 2. 1: LIST OF GROUP MEMBERS GENERATED BY K-MEANS CLUSTERING WITH P-VALUES COMPARING EXPRESSION
IN INJURED AND CONTROL CARTILAGE ... 33
TABLE 3.1: LIST OF GROUP MEMBERS GENERATED BY K-MEANS CLUSTERING WITH P-VALUES COMPARING EXPRESSION IN CO-CULTURED AND CONTROL CARTILAGE ... 67
TABLE A. 1: INJURIOUS COMPRESSION PROTOCOL (FILE: C:\USERS\JENNY\INJURY.PRO) ... 102
TABLE A.2: PARAMETER ORDER IN "DATA" LINES OF INCUDYN OUTPUT FILE ... 116
TABLE B. 1: GROUP MEMBERS GENERATED BY K-MEANS CLUSTERING ... 135
TABLE B.2: GROUP MEMBERS GENERATED BY K-MEANS CLUSTERING ... 136
TABLE C. 1: MEASUREMENTS OF RNA CONCENTRATION AND PURITY ... 137
TAB LE E. 1: DESCRIPTION OF SAMPLE TREATMENT GROUPS TO TEST FOR INTERACTIONS BETWEEN IL-6, IL- lIa, AND MECHANICAL INJURIOUS COMPRESSION ... 147
TABLE E.2: DESCRIPTION OF SAMPLE TREATMENT GROUPS TO TEST FOR INTERACTIONS BETWEEN IL-6, TNF-a, AND MECHANICAL INJURIOUS COMPRESSION ... 150
TABLE E.3: DESCRIPTION OF SAMPLE TREATMENT GROUPS TO TEST FOR INTERACTIONS BETWEEN IL-6, CO-CULTURE WITH JOINT CAPSULE TISSUE, AND MECHANICAL INJURIOUS COMPRESSION ... 153
TABLE E.4: DESCRIPTION OF SAMPLE TREATMENT GROUPS TO TEST FOR INTERACTIONS BETWEEN IL-6 AND MECHANICAL INJURIOUS COMPRESSION ... 156
TABLE E.5: DESCRIPTION OF SAMPLE TREATMENT GROUPS TO TEST FOR AN EFFECT OF IL-6 BLOCKADE ON THE REDUCTION IN BIOSYNTHESIS OBSERVED DURING CO-CULTURE WITH JOINT CAPSULE TISSUE ... 158
TABLE E.6: DESCRIPTION OF SAMPLE TREATMENT GROUPS TO TEST FOR AN EFFECT OF IL-6 BLOCKADE WITH FULL LENGTH ANTIBODY OR FAB FRAGMENT ON REDUCTION IN BIOSYNTHESIS OBSERVED DURING CO-CULTURE WITH JOINT CAPSULE TISSUE ... 159
CHAPTER 1: INTRODUCTION
1.1. THE KNEE
The knee occurs at the junction of three bones: the femur, tibia, and patella. At the ends of the bones is a layer of articular cartilage, which cushions the joint, distributes load to the underlying bone, provides a low friction surface for movement, and contributes to lubrication (Ross, 2003). Additional cushioning is provided by the menisci, two C-shaped pieces of cartilage located between the femur and the tibia. There are four main ligaments in the knee serving to stabilize the joint. These are the anterior cruciate ligament (ACL), posterior cruciate ligament (PCL), medial collateral ligament (MCL), and lateral collateral ligament (LCL). There are two main muscle groups responsible for extension, quadriceps, and flexion, hamstring. The knee is the largest synovial joint in the body. During level walking, the force across the tibiofemoral joint ranges between two and four times body weight while the force across the patellofemoral joint does not exceed 50% of body weight. Peak force transmission across the joint increases as
damage occurs to the menisci, articular cartilage, and subchondral bone (Standring, 2005).
1.2. CARTILAGE STRUCTURE
Cartilage is an avascular tissue composed of chondrocytes in an extensive extracellular matrix, which is produced and maintained by the cells. The cartilage matrix is well adapted for weight bearing and is 60-80% water. Additionally, the matrix includes proteoglycans, type II collagen, and hyaluronic acid. Cartilage extracellular matrix permits diffusion of substances between blood vessels in the surrounding connective tissue and the chondrocytes, maintaining the viability of the tissue. The matrix of hyaline cartilage appears glassy in the living state explaining its name derived from the Greek hyalos meaning glass. Chondrocytes are located throughout the cartilage matrix in spaces called lacunae. When damaged, chondrocytes have a limited capacity to repair the matrix (Ross, 2003).
Many different types of collagen are expressed in articular cartilage to form the complex fibrillar structure of the collagen network. This network varies in structure from the articular surface to the deep zones of cartilage and from the pericellular space surrounding chondrocytes to the interterritorial matrix. In articular cartilage, the collagen network is composed predominantly of Type II collagen fibrils present as heteropolymers with collagen IX molecules covalently linked to the surface of the fibrils and collagen XI forming a filamentous template at the fibril core. Collagen XI serves to regulate fibril diameter through retained N-propeptide domains. In addition to the abundant collagen fibrils, Type III collagen is found in normal and osteoarthritic human articular cartilage, colocalized with collagen II. Type VI collagen comprises <1%o of the collagen in the matrix and is concentrated around chondrocytes. Types XII and XIV collagens are also present in the matrix of cartilage but are not covalently bound to collagen fibrils (Eyre, 2004).
In addition to collagen, the extracellular matrix of articular cartilage is composed of a wide variety of proteoglycans. Aggrecan is the most abundant proteoglycan in cartilage and is largely responsible for the ability of the tissue to resist compression. Aggrecan has an amino-terminal globular domain that interacts with hyaluronan and link protein to form large, multimolecular complexes. Chondroitin sulfate and keratin sulfate chains are covalently attached along the aggrecan core protein in three glycosaminoglycan attachment domains (Roughley, 2001).
The cartilage matrix also contains other proteoglycans that do not form aggregates, as well as noncollagenous and nonproteoglycan-linked glycoproteins. These small regulatory and structural proteins influence interactions between the chondrocytes and the matrix and can be valuable clinically as markers of cartilage turnover and degradation. Examples of such proteins are anchorin CII, tenascin, and fibronectin, which help anchor chondrocytes to the matrix (Ross, 2003).
Because chondrocytes are dispersed, the matrix acts as a signal transducer for the embedded cells; loads applied to cartilage create mechanical, electrical, and chemical signals that direct cellular synthetic activity. Normal matrix turnover relies on the ability of chondrocytes to detect changes in matrix composition and respond to these changes by synthesizing appropriate new molecules. As the body ages, matrix composition changes and chondrocytes loose their ability to respond to their environment (Ross, 2003).
11.3. JOINT CAPSULE, SYNOVIUM, LIGAMENTS
The joint capsule is a fibrous membrane of variable thickness extending from the patellar tendon to the collateral ligament on both sides of the knee (Standring, 2005). The loose connective tissue of the capsule is composed of sparse collagen fibers, proteoglycans, and hyaluronic acid. The matrix allows diffusion of oxygen and nutrients from the small vessels present throughout tissue and diffusion of carbon dioxide and metabolic waste back to vessels. Many of the cells occurring in loose connective tissue are transient wandering cells that migrate from local blood vessels in response to stimuli. This tissues serves as a site of inflammatory and immune reactions and can undergo considerable swelling (Ross, 2003).
The internal surface of the capsule is lined by a thin tissue known as the synovium. The synovial membrane of the knee is the most extensive and complex synovium in the body. It extends several centimeters above the patella and is separated from the patellar tendon by an infrapatellar fat pad. The synovium covers the fat pad and projects into the joint. At the sides of the joint, the synovial membrane descends from the femur and lines the capsule as far as the menisci, whose surfaces have no synovial lining. The cruciate ligaments are partially surrounded by synovial membrane. Following acute or chronic trauma, the synovial membrane can become thickened and inflamed (Standring, 2005).
Cruciate ligaments, termed cruciate because they cross, are located in the center of the knee joint. The anterior cruciate ligament (ACL) is attached to the anterior intercondylar area of the tibia and ascends, twisting on itself, to attach high of the lateral femoral condyle. The posterior cruciate ligament (PCL) is attached to the posterior tibia extending to the medial femoral condyle. The PCL is thicker and stronger than the ACL and its rupture is less common and usually better tolerated (Standring, 2005). Ligaments are dense connective tissue and consist mainly of densely packed collagen fibers arranged in parallel. Fibroblasts that produce and maintain the fibers are packed and aligned between fiber bundles (Ross, 2003).
1.4. OSTEOARTHRITIS
Arthritis and chronic joint symptoms occur in more than 70 million people in the United States or one out of every three adults. Arthritis is the leading cause of disability in the United States with costs for care reaching nearly $22 billion in 1995 with additional costs of $60 billion attributed to loss of productivity (Praemer, 1999). The prevalence of arthritis and chronic joint symptoms increases with age and in 2001 occurred in 19% of people age 19-44, 42% of people age 44-64, and 59% of those over 65 years old. Prevalence of arthritis also increases with increasing body weight occurring in 27% of underweight and normal weight individuals, 34% in those who are overweight, and 45% of obese people (Bolen, 2002).
Osteoarthritis (OA), a degenerative disease in which the cartilage in the joint is degraded and joint movement becomes painful, is the most common form of arthritis and occurs in a variety of joints including the knee, hip, hand/fingers, spine, and foot. Symptomatic OA occurs in. the knee in 6% of adults in the hip in 3% of adults (Felson, 2000). It remains unclear whether OA is one disease or many disorders with a similar final pathway (Felson, 2000). Clinically, the most compelling definition of the disease is one that combines the pathology of the disease with pain during joint use (many people with radiographic and pathologic changes of OA do not
experience symptoms). The cause of pain in OA is unknown. Pathology of osteoarthritis involves the whole joint and includes focal and progressive hyaline cartilage loss with concomitant changes in bone underneath the cartilage including development of marginal outgrowths, osteophytes, and increased thickness of the bony envelope (bony sclerosis). Soft tissue structures in and around the joint are also affected including modest inflammation of the synovium, weakening of the bridging muscle in the joint, and loosening of the ligaments. Clinically, symptoms in a joint affected by OA may include pain, inflammation, swelling, stiffness, loss of range of motion, and weakness.
Treatment of OA remains challenging with no cure currently available for the disease. Physical activity can decrease pain, improve function, and delay disability caused by OA. In overweight patients, disease progression can be slowed by weight loss. NSAIDS (non-steroidal anti-inflammatory drugs) are used to reduce pain and inflammation in the joint. Dietary supplements including glucosamine and chondroitin sulfate are used with reported success. Physical therapy to improve flexibility and strengthen muscle is also used as a treatment for OA. In the end stage of disease, surgery is often the only option. Arthroscopy is performed to remove bone spurs, cysts, damaged lining, or loose fragments from the joint. Other surgical options include joint fusion, which eliminates joint flexibility and joint replacement, which maintains joint flexibility but can be problematic over time.
1.5. CLINICAL JOINT INJURY
In addition to age and body weight, joint injury is a well established risk factor for the development of OA particularly in the knee and hip (Davis, 1989; Roos, 1995; Gelber, 2000). Risk for OA is not affected by surgical intervention to stabilize the joint following ACL rupture (Lohmander, 2004; von Porat, 2004). A prospective study performed at John's Hopkins Medical School showed by 65 years of age the cumulative incidence of knee OA was 14% in participants
who had a knee injury during adolescence and young adulthood compared to 6% in those who did not (Gelber, 2000). Joint injuries typically include anterior cruciate ligament (ACL) or meniscus tears with ACL tears most common in patients under 30 and meniscus tears most common over the age of 30 (Roos, 1995). A study of a group of female soccer players who sustained an ACL injury showed by 12 years after injury (mean age 31 years at assessment), radiographic changes in knee index occurred in 82% with 51% fulfilling criteria for radiographic knee OA. Of these, 75% had symptoms affecting their knee-related quality of life and 42% had symptomatic, radiographic knee OA (Lohmander, 2004).
Clinical studies of knee injury have shown marked changes in the joint environment. Analysis of synovial fluid shows increased levels of matrix degrading enzymes (Lohmander, 1993a), increased markers of matrix turnover (Lohmander, 1993a; Lohmander, 1993b; I,ohmander, 1999; Lohmander, 2003), and elevated levels of inflammatory cytokines (Irie, 2003) in injured joints compared to synovial fluid from uninjured controls. The origin of these factors in the synovial fluid is unknown and may include one or more of cartilage, synovium, ligament, tendon, and bone. It is likely that this altered joint environment is involved as either a cause or an effect in the pathology of OA development.
1.6. JOINT INJURY MODEL SYSTEMS
To study joint injury in more detail, in vivo and in vitro model systems have been developed. In vivo animal studies of joint injury have shown changes in both the cartilage and synovium after transection of the anterior cruciate ligament (ACLT). The ACLT model of joint injury results in changes analogous to those seen during OA progression including full-thickness loss of articular cartilage, osteophyte formation, cartilage surface fibrillation, chondrocyte cloning, hyperplasia of synovial lining, mononuclear cell infiltration, and joint capsule fibrosis (Brandt, 1991). In addition to gross morphological changes in the joint, ACLT leads to changes
in expression of matrix molecules and enzymes in cartilage and synovium (Takahashi, 1999; Le Graverand, 2002). Recent studies have specifically shown aggrecanase-2 to be responsible for cartilage degradation in mouse models of OA (Glasson, 2005; Stanton, 2005).
In vitro injury models include impact loading of articular cartilage and co-culture of cartilage with damaged synovium or joint capsule tissue to model soft tissue tears. Models in which cartilage tissue is overloaded result in cell and tissue damage including cell death (Quinn, 11998; Chen, 1999; Torzilli, 1999; Loening, 2000; Chen, 2001; D'Lima, 2001; Kurz, 2001; Thibault, 2002; Patwari, 2003; DiMicco, 2004). Co-culture of cartilage with synovial or joint capsule tissue also results in cell and tissue damage in the cartilage (Fell and Jubb, 1977; Jubb amd Fell, 1980; Vankemmelbeke, 1999; Patwari, 2001). The combination of mechanical injury of cartilage followed by co-culture with joint capsule results in further reduction in biosynthesis than that measured after injury or co-culture alone (Patwari, 2001).
1.7. THESIS OBJECTIVES
We sought to gain further understanding of the mechanisms involved in joint injury by studying the effects on chondrocytes of established in vitro models of injury to cartilage. We hypothesized that specific changes would occur at the level of gene expression in response to injurious stimuli. Real-time PCR was used to quantitatively measure gene expression levels of 24 genes central to cartilage matrix maintenance in free swelling control cartilage explants. We then measured expression levels of these genes at six time points within the first 24 hours in multiple models of joint injury. Data from the mechanical injurious compression model of cartilage injury was compared to data from the injury model involving co-culture of cartilage with joint capsule tissue. Additionally, effects of these two stimuli applied individually were compared to measured gene expression changes in response to the combination of injurious compression followed by co-culture with joint capsule tissue. This experimental design made possible determination of
specific molecules that are affected by injurious compression, co-culture, or the combination of these stimuli. We next sought to measure protein levels and activity of catabolic enzymes in the joint injury models. We hypothesized that matrix damage observed in these injury models was the result of activity of specific catabolic enzymes able to cleave cartilage extracellular matrix molecules. As well, we sought to determine the effect on equilibrium and dynamic stiffness of cartilage tissue explants in each of the injury models. Overall, the goal of this project was to determine if there is a general shift in cellular activity toward matrix repair or degradation following events of joint injury and to identify specific enzymes that may be involved in these processes.
1.8. REFERENCES
Bolen, J., Helmick, CG, Sacks, JJ, Langmaid, G (2002) Prevalence of Self-Reported Arthritis or Chronic Joint Symptoms Among Adults - United States. In: Division of Adult and Community Health, National Center for Chronic Disease Prevention and Health Promotion, CDC, pp. 948-950.
Brandt, K.D., Myers, S.L., Burr, D. and Albrecht, M. (1991) Osteoarthritic changes in canine articular cartilage, subchondral bone, and synovium fifty-four months after transection of the anterior cruciate ligament. Arthritis Rheum. 34: 1560-1570.
Chen, C.T., Burton-Wurster, N., Lust, G., Bank, R.A. and Tekoppele, J.M. (1999) Compositional and metabolic changes in damaged cartilage are peak-stress, stress-rate, and loading-duration dependent. J Orthop Res. 17: 870-879.
Chen, C.T., Burton-Wurster, N., Borden, C., Hueffer, K., Bloom, S.E. and Lust, G. (2001) Chondrocyte necrosis and apoptosis in impact damaged articular cartilage. J Orthop Res. 19:
:703-711.
D'Lima, D.D., Hashimoto, S., Chen, P.C., Colwell, C.W., Jr. and Lotz, M.K. (2001) Human chondrocyte apoptosis in response to mechanical injury. Osteoarthritis Cartilage. 9: 712-719. I)avis, M.A., Ettinger, W.H., Neuhaus, J.M., Cho, S.A. and Hauck, W.W. (1989) The association of knee injury and obesity with unilateral and bilateral osteoarthritis of the knee. Am J
Etidiemiol. 130: 278-288.
Di)iicco, M.A., Patwari, P., Siparsky, P.N., Kumar, S., Pratta, M.A., Lark, M.W., et al (2004) Mechanisms and kinetics of glycosaminoglycan release following in vitro cartilage injury. Arthritis Rheum. 50: 840-848.
Eyre, D.R. (2004) Collagens and cartilage matrix homeostasis. Clin Orthop Relat Res: S 18-122. Fell, H.B. and Jubb, R.W. (1977) The effect of synovial tissue on the breakdown of articular cartilage in organ culture. Arthritis Rheum. 20: 1359-1371.
Felson, D.T., Lawrence, R.C., Dieppe, P.A., Hirsch, R., Helmick, C.G., Jordan, J.M., et al (2000) Osteoarthritis: new insights. Part 1: the disease and its risk factors. Ann Intern Med. 133: 635-6.46.
Gelber, A.C., Hochberg, M.C., Mead, L.A., Wang, N.Y., Wigley, F.M. and Klag, M.J. (2000) Joint injury in young adults and risk for subsequent knee and hip osteoarthritis. Ann Intern Med.
133: 321-328.
Glasson, S.S., Askew, R., Sheppard, B., Carito, B., Blanchet, T., Ma, H.L., et al (2005) Deletion of active ADAMTS5 prevents cartilage degradation in a murine model of osteoarthritis. Nature.
Irie, K., Uchiyama, E. and Iwaso, H. (2003) Intraarticular inflammatory cytokines in acute anterior cruciate ligament injured knee. Knee. 10: 93-96.
Jubb, R.W. and Fell, H.B. (1980) The effect of synovial tissue on the synthesis of proteoglycan by the articular cartilage of young pigs. Arthritis Rheum. 23: 545-555.
Kurz, B., Jin, M., Patwari, P., Cheng, D.M., Lark, M.W. and Grodzinsky, A.J. (2001) Biosynthetic response and mechanical properties of articular cartilage after injurious compression. J Orthop Res. 19: 1140-1146.
Le Graverand, M.P., Eggerer, J., Vignon, E., Otterness, I.G., Barclay, L. and Hart, D.A. (2002) Assessment of specific mRNA levels in cartilage regions in a lapine model of osteoarthritis. J
Orthop Res. 20: 535-544.
]Loening, A.M., James, I.E., Levenston, M.E., Badger, A.M., Frank, E.H., Kurz, B., et al (2000) Injurious mechanical compression of bovine articular cartilage induces chondrocyte apoptosis. Arch Biochem Biophys. 381: 205-212.
],ohmander, L.S., Hoerrner, L.A. and Lark, M.W. (1993a) Metalloproteinases, tissue inhibitor, and proteoglycan fragments in knee synovial fluid in human osteoarthritis. Arthritis Rheum. 36:
1181-189.
Lohmander, L.S., Neame, P.J. and Sandy, J.D. (1993b) The structure of aggrecan fragments in human synovial fluid. Evidence that aggrecanase mediates cartilage degradation in inflammatory joint disease, joint injury, and osteoarthritis. Arthritis Rheum. 36: 1214-1222.
Lohmander, L.S., Ionescu, M., Jugessur, H. and Poole, A.R. (1999) Changes in joint cartilage aggrecan after knee injury and in osteoarthritis. Arthritis Rheum. 42: 534-544.
L,ohmander, L.S., Atley, L.M., Pietka, T.A. and Eyre, D.R. (2003) The release of crosslinked peptides from type II collagen into human synovial fluid is increased soon after joint injury and in osteoarthritis. Arthritis Rheum. 48: 3130-3139.
Lohmander, L.S., Ostenberg, A., Englund, M. and Roos, H. (2004) High prevalence of knee osteoarthritis, pain, and functional limitations in female soccer players twelve years after anterior cruciate ligament injury. Arthritis Rheum. 50: 3145-3152.
Patwari, P., Fay, J., Cook, M.N., Badger, A.M., Kerin, A.J., Lark, M.W. and Grodzinsky, A.J. (2001) In vitro models for investigation of the effects of acute mechanical injury on cartilage.
C'lin Orthop: S61-71.
Patwari, P., Cook, M.N., DiMicco, M.A., Blake, S.M., James, I.E., Kumar, S., et al (2003) Proteoglycan degradation after injurious compression of bovine and human articular cartilage in vitro: interaction with exogenous cytokines. Arthritis Rheum. 48: 1292-1301.
Praemer, A., Furner, S, Rice, DP (1999) Musculoskeletal Conditions in the United States. In Rosemone, IL: American Academy of Orthopedic Surgeons.
Quinn, T.M., Grodzinsky, A.J., Hunziker, E.B. and Sandy, J.D. (1998) Effects of injurious compression on matrix turnover around individual cells in calf articular cartilage explants. J
O)rthop Res. 16: 490-499.
Roos, H., Adalberth, T., Dahlberg, L. and Lohmander, L.S. (1995) Osteoarthritis of the knee after injury to the anterior cruciate ligament or meniscus: the influence of time and age. Osteoarthritis Cartilage. 3: 261-267.
Ross, M.H. (2003) Histology. A Text and Atlas. Philadelphia, USA: Lippincott Williams & 'Wilkins.
Roughley, P.J. (2001) Articular cartilage and changes in arthritis: noncollagenous proteins and proteoglycans in the extracellular matrix of cartilage. Arthritis Res. 3: 342-347.
Standring, S. (ed.) (2005) Gray's Anatomy. The Anatomical Basis of Clinical Practice. London, UK: Elsevier Churchill Livingstone.
Stanton, H., Rogerson, F.M., East, C.J., Golub, S.B., Lawlor, K.E., Meeker, C.T., et al (2005) ADAMTS5 is the major aggrecanase in mouse cartilage in vivo and in vitro. Nature. 434:
648-652.
Takahashi, K., Goomer, R.S., Harwood, F., Kubo, T., Hirasawa, Y. and Amiel, D. (1999) The effects of hyaluronan on matrix metalloproteinase-3 (MMP-3), interleukin- 1 beta(IL- 1 beta), and tissue inhibitor of metalloproteinase-1 (TIMP-1) gene expression during the development of osteoarthritis. Osteoarthritis Cartilage. 7: 182-190.
Thibault, M., Poole, A.R. and Buschmann, M.D. (2002) Cyclic compression of cartilage/bone explants in vitro leads to physical weakening, mechanical breakdown of collagen and release of matrix fragments. J Orthop Res. 20: 1265-1273.
Torzilli, P.A., Grigiene, R., Borrelli, J., Jr. and Helfet, D.L. (1999) Effect of impact load on articular cartilage: cell metabolism and viability, and matrix water content. J Biomech Eng. 121: 433-441.
Vankemmelbeke, M.N., Ilic, M.Z., Handley, C.J., Knight, C.G. and Buttle, D.J. (1999) Coincubation of bovine synovial or capsular tissue with cartilage generates a soluble
"Aggrecanase" activity. Biochem Biophys Res Commun. 255: 686-691.
von Porat, A., Roos, E.M. and Roos, H. (2004) High prevalence of osteoarthritis 14 years after an anterior cruciate ligament tear in male soccer players: a study of radiographic and patient relevant outcomes. Ann Rheum Dis. 63: 269-273.
CHAPTER 2: MECHANICAL INJURY OF CARTILAGE EXPLANTS
CAUSES SPECIFIC TIME DEPENDENT CHANGES IN CHONDROCYTE
GENE EXPRESSION
2.1. INTRODUCTION
Acute traumatic joint injury in young adults leads to an increased risk for the development of osteoarthritis (OA) later in life (Davis, 1989; Gelber, 2000; von Porat, 2004) despite efforts to intervene in this process by surgically stabilizing injured joints (Roos, 1995). Although the mechanism by which injury leads to tissue degeneration remains to be elucidated, several injury-related factors may contribute to the development of OA. These factors include but are not limited to instability in the joint due to ligament, tendon, or meniscus tear, and/or
initiation of a cellular response in cartilage or other joint tissues at the time of the injury.
Previous clinical studies have shown an increase in MMP-3 and TIMP-1 protein levels as well as an increase in proteoglycan and type II collagen fragments in the synovial fluid of patients following a tear in the anterior cruciate ligament (ACL) or meniscus from 1 day to 20 years after the injury (Lohmander, 1994; Lohmander, 2003). During the first week after ACL injury, there was also a significant increase in synovial fluid levels of TNF-a and IL-10. By three weeks after injury, the levels of these cytokines decreased to those seen in samples from patients with chronic arthritis (Irie, 2003). Gene expression studies comparing normal and OA cartilage have shown upregulation of MMP-13 in late-stage OA, while MMP-3 is downregulated
(Bau, 2002); as well, BMP-2 is increased in OA cartilage and co-localizes with newly synthesized procollagen II suggesting anabolic remodeling of the tissue (Fukui, 2003).
Using the lapine ACL transection model to study the pathogenesis of OA in vivo, investigators have found an increase in MMP-3 expression level after 9 weeks (Takahashi, 1999), and location specific changes in mRNA levels of several genes after 3 and 8 weeks (Le Graverand, 2002). Expression of collagen II, aggrecan, biglycan, MMP-1, MMP-3, MMP-13,
and TIMP- I1 all increased during the development of OA in this animal model, while decorin and fibromodulin showed decreased expression (Le Graverand, 2002).
Because loading variables are difficult to control in vivo, a number of investigators have developed in vitro models to isolate cartilage and study tissue and cellular level effects of mechanical injury. Mechanical loads applied in vitro range from single compressions of up to 50% strain (Torzilli, 1999; D'Lima, 2001; Ewers, 2001; Kurz, 2001; Patwari, 2003; DiMicco, 12004) to large amplitude cyclic compression at varying frequencies (-0.05 Hz to 0.3 Hz) for up to 2 hours (Chen, 1999; Chen, 2001; Thibault, 2002; Chen, 2003). Injurious mechanical compression of cartilage in vitro can damage the extracellular matrix, leading to increased water content (Chen, 1999; Torzilli, 1999; Loening, 2000; Kurz, 2001), decreased stiffness (Loening, 2000; Kurz, 2001), increased hydraulic permeability (Thibault, 2002), GAG loss to the culture inedium (Quinn, 1998; Loening, 2000; D'Lima, 2001; Ewers, 2001; Kurz, 2001; Thibault, 2002; Patwari, 2003; DiMicco, 2004), collagen loss to the medium (Thibault, 2002), and temporary denaturation of collagen in the tissue (Chen, 1999; Torzilli, 1999; Thibault, 2002; Chen, 2003). In addition, injurious mechanical compression can lead to cell death by both apoptosis and necrosis (Quinn, 1998; Torzilli, 1999; Loening, 2000; Chen, 2001; D'Lima, 2001; Chen, 2003), as well as decreased matrix biosynthesis rates in the remaining viable cells after injury (Kurz, 2001).
Though many studies have focused on the effects of in vitro injurious compression on cartilage tissue, the resulting modulation of chondrocyte gene transcription has not been fully elucidated. The objective of this study was to quantify the effects of cartilage injury in vitro on 24 genes central to cartilage maintenance, including genes encoding macromolecules of the extracellular matrix (ECM), proteases that can cleave ECM proteins and their natural inhibitors, transcription factors, and cytokines previously shown to affect cartilage metabolism. Using real-time PCR, we measured levels of mRNA of these molecules at six real-time points after acute
mechanical injury. We observed distinct changes in the pattern and kinetics of expression that may suggest a role for certain catabolic processes associated with eventual cartilage degradation.
2.2. MATERIALS AND METHODS
Tissue Harvest. Articular cartilage explant disks were harvested from the femoropatellar
grooves of 1-2 week old calves using previously developed methods (Sah, 1989). In brief, 9 mm diameter cartilage-bone cylinders were drilled perpendicular to the cartilage surface. These cylinders were then placed in a microtome holder and the most superficial -200 tm layer was removed to obtain a level surface. Up to three sequential 1 mm slices were cut from each cylinder, and 4 disks (1 mm thick, 3 mm diameter) were cored from each slice using a dermal punch, giving 48 disks in total from each joint. These disks were then equilibrated in culture medium for 2 days (low glucose DMEM supplemented with 10% fetal bovine serum, 10 mM YHEPES buffer, 0.1 mM nonessential amino acids, 0.4 mM proline, 20 tg/ml ascorbic acid, 100 U/ml penicillin G, 100 tg/ml streptomycin, and 0.25 [tg/ml amphotericin B) in a 37°C, 5% CO2
environment.
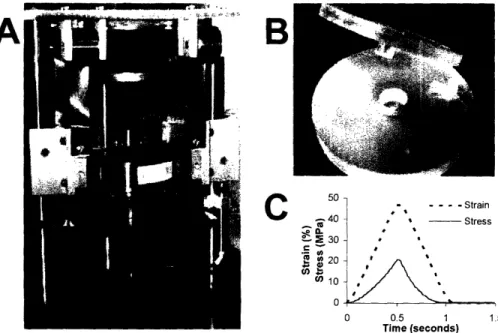
Injurious Compression. After equilibration of the explants, a custom-designed
incubator-housed loading apparatus (Figure 2.1A) (Frank, 2000) was used to injuriously compress 36 cartilage disks from each joint while the remaining 12 served as free swelling controls. Cartilage samples to be injured were placed individually into a polysulfone chamber which allows radially-unconfined compression of the disk by impermeable platens (Figure 2.1 B) (Kurz, 2001; Patwari, 2003; DiMicco, 2004). The measured thickness of the cartilage disk just prior to loading was recorded, and the zero-strain position was identified by the point of first contact between the loading platen and the cartilage surface. The injury protocol consisted of a single displacement ramp to a final strain of 50% at a velocity of 1 mm/s (strain rate 1.0/s in displacement control), followed by immediate removal of the displacement at the same rate (Figure 2.1 C). Application of these strain and strain rate parameters resulted in an average peak stress of -20 MPa; this loading protocol has been shown previously to produce damage to the ECM, a significant decrease in cell viability, a decrease in cell biosynthesis by remaining viable
cells, and an increase in GAG loss to the medium in similar bovine cartilage explants (Quinn, 1998; Loening, 2000; Kurz, 2001; Patwari, 2003; DiMicco, 2004). After injury, the disks were placed into fresh culture medium (described above). Groups of 6 cartilage disks were removed from culture at 1, 2, 4, 6, 12, and 24 hours, flash frozen in liquid nitrogen, and stored at -80°C. Two groups of 6 free swelling disks were frozen at 4 and 24 hours to serve as controls. Explant disks in each group of 6 specimens were purposely matched across depth and location along the joint surface to prevent bias based on location; as a result, each experimental condition represents an average of specimens within the joint surface.
B
150 - - - StrainC
%IC
o40 - Stress .. 2 30 e20 ' 0) 10 0 0.5 1 1.5 Time (seconds)Figure 2.1: Loading device and example of compression waveforms. A) An incubator housed
loading apparatus was used to apply injurious compression in displacement control to individual cartilage disks. The load and displacement were recorded by transducers during loading. B) Polysulfone chamber used to hold cartilage disks during loading in unconfined compression. C) Representative data acquired during compression to 50% strain at a strain rate of 1.0/s. Peak stress reached a maximum value of 20.7 MPa.
RNA Extraction. RNA was extracted from the 6 pooled cartilage disks by first
pulverizing the tissue and then homogenizing in Trizol reagent (Invitrogen, CA) to lyse the cells. Extracts were then transferred to Phase Gel Tubes (Eppendorf AG, Germany) with 10% v/v chloroform and spun at 13,000g for 10 min. The clear liquid was removed from above the phase
gel and RNA was isolated from the sample using the RNeasy Mini Kit (Qiagen, CA). Genomic DNA was removed by a DNase digestion step (Qiagen, CA) during purification. Absorbance measurements were read at 260 nm and 280 nm to determine the concentration of RNA extracted from the tissue and the purity of the extract. The average 260/280 ratio of absorbencies was 1.86+0.12. Reverse transcription of equal quantities of RNA (2.5 tg) from each sample was performed using the Amplitaq-Gold RT kit (Applied Biosystems, CA).
Real-time PCR. Real-time PCR was performed using the Applied Biosystems 7700
instrument and SYBR Green Master Mix (Applied Biosystems, CA). Primers were designed to bovine sequences for matrix molecules (collagen II, aggrecan, link protein, fibronectin, fibromodulin, and collagen I), proteases (MMP-1, MMP-3, MMP-9, MMP-13, ADAMTS-4, ADAMTS-5), protease inhibitors (TIMP-1, TIMP-2), cytokines (TNF-a, IL-13), housekeeping (13-actin, GAPDH), transcription factors (c-fos, c-jun, sox 9), and growth factors (IGF-1, IGF-2, TGF-[) using Primer Express software (Applied Biosystems, CA). Standard curves for amplification using these primers were generated; all primers demonstrated approximately equal efficiency, with standard curve slopes -1 indicating a doubling in cDNA quantity each cycle. Expression levels in injured samples were normalized to those of free swelling control samples for each gene.
Statistical Analyses. In each experiment, expression levels measured in injured sample
groups were normalized to those of free swelling control groups for each gene; expression data are presented as the average of three replicate experiments ( SE). Changes in gene expression levels in the injured samples with respect to free swelling controls at the 4 hour and 24 hour time points were examined using a non-parametric t-test (Troyanskaya, 2002). The t-test was made non-parametric by estimating the p-values from permuted data sets (Good, 2000); the t-statistic was calculated from each of the permuted data sets to create a distribution of possible values. Using this method, all changes in expression that were 5-fold or greater were found to be statistically significant. Changes between 2 and 5-fold were also found to be significant with
three exceptions (c-fos at 4 hours and 24 hours, and c-jun at 24 hours); in certain instances, lower fold changes were also found to be significant.
Gene Clustering. To distinguish the main expression trends, a k-means clustering
algorithm was applied to the injury time course data (Eisen, 1998; Jain, 1999; Dougherty, 2002; Fitzgerald, 2004). Each gene was grouped based on the correlation of the time course expression profile to a set of randomly chosen starting genes. Group profiles were then calculated as the ;average of the expression profiles of the genes in each group. The correlation between each gene and group profile was calculated and the genes regrouped in an iterative fashion until the groupings settled. To ensure that an optimal clustering solution for the twenty-four genes was found, the algorithm was run sufficient times to cover every possible selection of starting genes. Each set of randomly chosen starting genes produced a deterministic grouping of the genes, with each gene paired with the highest correlating group profile. The optimal solution was chosen as the grouping that had the highest overall correlation of genes to group profiles, by averaging over all the genes (see (Fitzgerald, 2004) for details). The number of groups was varied from three to six and five groups were chosen to best represent the trends. To determine the distinctiveness of the main expression trends, the final group profiles were compared using a comparison means Student's t-test. The Euclidean distance between two group profiles represented the difference of means, and the average squared distance of the genes within a group to the group profile represented the variance. The number of genes in each group corresponded to the degrees of freedom for that group.
2.3. RESULTS
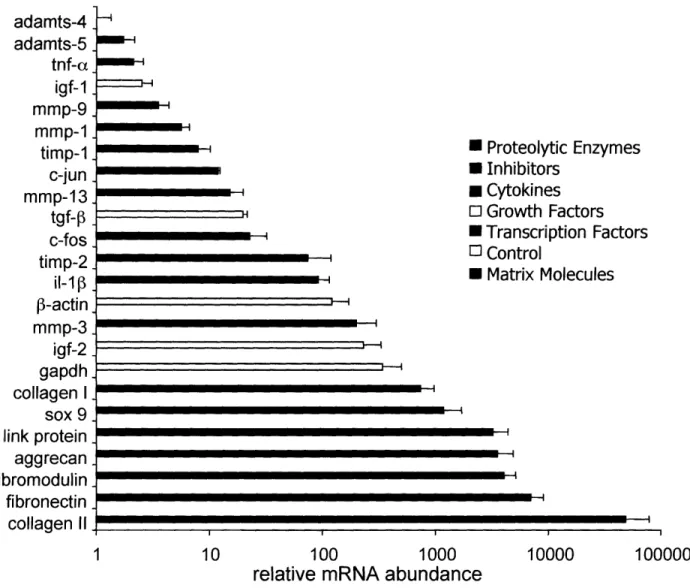
Gene expression levels in uninjured control cartilage disks. Real-time PCR was used
to determine the gene expression levels of 24 genes of interest in uninjured control cartilage disks for comparison to mechanically injured disks. Levels of expression of the tested genes varied over five orders of magnitude, as seen in Figure 2.2, with data normalized to the level of the lowest expressed gene, ADAMTS-4 (aggrecanase-1). Extracellular matrix molecules as well as sox 9, a transcription factor promoting expression of matrix molecules in cartilage, showed the highest levels of expression. Genes typically used as internal controls (e.g., GAPDH, -actin) showed intermediate levels of expression, while certain cytokines, matrix metalloproteinases, and transcription factors displayed relatively lower levels of expression. ADAMTS-4 and ADAMTS-5 (aggrecanase-2) showed the lowest levels of expression of the genes tested.
adamts-4 adamts-5 tnf-cc igf-1 mmp-9 mmp-1 timp-1 c-jun mmp-13-tgf- c-fos timp-2 il-11 -actin mmp-3 igf-2 gapdh collagen I sox 9 link protein aggrecan fibromodulin fibronectin collaoen II ---4 /1*--q ON--4 * Proteolytic Enzymes * Inhibitors * Cytokines o Growth Factors * Transcription Factors
[
Control
* Matrix Molecules 1 10 10 I _ 100 1000relative mRNA abundance
10000 100000
Figure 2.2: Free swelling expression levels of 24 genes ranked by relative abundance.
Medium was changed 2 days after harvest and samples were taken 4 and 24 hours after medium change for gene expression quantification. Levels at the two time points were averaged to give a single value for each tissue sample. Expression levels were normalized to expression of ADAMTS-4, the least abundant gene measured. Data are reported as Mean SE for n = 3 replicate experiments using tissue from 3 different joints.
Effects of injurious compression on gene expression. Levels of expression in
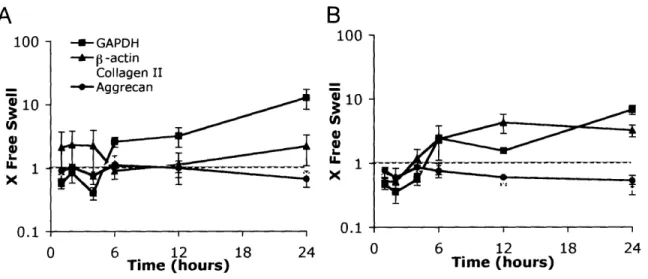
non-injured free swelling controls (Figure 2.2) changed selectively in response to injurious compression. P-values comparing expression levels after injury to control free swelling expression levels were calculated at the 4 and 24 hour time points and are shown in Table 2.1. 'While expression levels of some genes remained unchanged in response to injury, others exhibited dramatic differences compared with their free-swelling controls. GAPDH and -actin
HH - _ a__ 19- i r r I I I I I Il II I I I I . ... ,v
increased in expression -4-fold over free swelling levels after compression (Figure 2.3). Because these genes showed changing expression levels within the 24 hours after loading, they were not used as internal controls to normalize the data acquired for the other genes. Rather, all expression levels were instead normalized by using a fixed quantity of extracted RNA for reverse transcription as described above in 2.2. MATERIALS AND METHODS. By using a fixed quantity of RNA from each sample, decreased cell viability in injuriously compressed cartilage should not affect the levels of expression reported; rather changes in expression should represent changes within the viable cells remaining in the tissue.
Table 2.1: List of group members generated by k-means clustering with p-values comparing expression in injured and control cartilage. Gene expression profiles were
iteratively clustered into five groups using k-means clustering. Groups were formed based on gene to group profile correlation. To compare control and injured cartilage, p-values were calculated from t-tests performed at the time points 4 hours and 24 hours after injury; bold represents p-value <0.05, * represents p-value <0.01.
Group 1 Group 2 Group 3 Group 4 Group 5
4hr 24hr 4hr 24hr 4hr 24hr 4hr 24hr 4hr 24hr
MIMP-3 0.01 0.05 c-fos 0.53 0.30 MMP-1 0.07 0.01 IGF-1 0.16 0.08 Collagen II 0.46 0.09 ADAMTS-5 * * c-jun 0.03 0.26 MMP-9 0.83 0.04 IGF-2 0.15 0.49 Aggrecan 0.05 0.02 TGF-f1 * 0.03 MMP-13 0.03 * ADAMTS-4 0.03 0.02 Fibromodulin 0.09 0.72 Collagen I 0.02 0.05 Link Protein 0.12 0.18
TIMP- 1 0.02 0.03 IL- 1 0.09 0.25 TIMP-2 0.69 * Fibronectin 0.49 0.04 sox 9 * 0.92 GAPDH 0.14 * 1-actin 0.08 0.03 TNF-a 0.91 0.33
10 0
i-x
0.1 0 5 10 15 20 25Time after Injury (hours)
Figure 2.3: Changes in expression level of matrix molecules, -actin, and GAPDH genes after injurious compression. Values on the y-axis represent fold change from free swelling
levels with a value of 1 indicating similar expression after injury to the level measured in free swelling conditions. Six cartilage disks were pooled for each time point for each experiment. All samples were normalized to total RNA at the reverse transcription step. Mean ± SE (n=3).
Extracellular matrix molecules showed no change in expression levels greater than 2-fold during the 24 hours immediately following compression. Collagen II and aggrecan (Figure 2.3) as well as fibromodulin and link protein (data not shown) did not change their expression during the 24 hours immediately following injury. Fibronectin increased -2-fold at the 12 and 24 hour time points (data not shown).
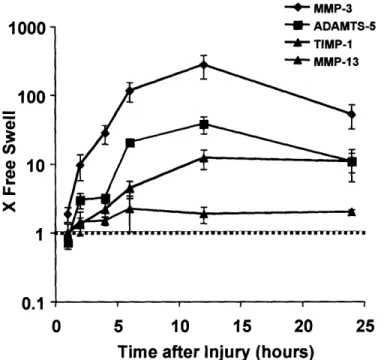
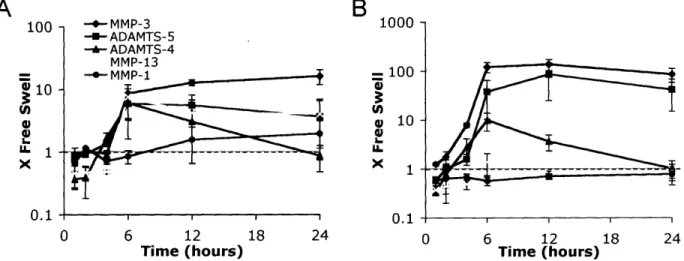
The most dramatically changing gene in this study was MMP-3, which increased in expression -250-fold over the free swelling control level following injurious compression (Figure 2.4). MMP-3 expression began to increase within 2 hours after injury, peaked by 12 hours, and decreased to a -50-fold increase over free swelling level by 24 hours. MMP-13, however, showed only a -2-fold increase over free swelling level during the 24 hours after injury (Figure 2.4), and MMP-1 and MMP-9 increased by -6-fold and -4-fold, respectively, over their free swelling levels (data not shown). Like MMP-3, ADAMTS-5 also showed a dramatic increase in expression to -40-fold over the free swelling level by 12 hours after injury, and
I
remained elevated at -10-fold over free swelling by 24 hours (Figure 2.4). In contrast, ADAMTS-4, increased only -2-3-fold over free swelling levels and showed little variation with time in the 24 hours after injury (data not shown). TIMPs, the endogenous tissue inhibitors of metalloproteinases, were also affected by injurious compression. TIMP-1 increased to -12-fold over free swelling levels by 12 hours and remained elevated by 24 hours after injury (Figure 2.4). TIMP-2, which is expressed at an overall higher level than TIMP-1 in free swelling cartilage (Figure 2.2), was increased by only -2-fold at 12 and 24 hours after injury (data not shown).
-- MMP-3 A nn 0 AE nAmfrc C 1 UUU 100 co 0 10
x
1 0.1 0 5 10 15 20 25Time after Injury (hours)
Figure 2.4: Changes in expression level of matrix proteases and tissue inhibitor of matrix metalloprotease-1 after injurious compression. Values on the y-axis represent fold change
from free swelling levels with a value of I indicating similar expression after injury to the level measured in free swelling conditions. Six cartilage disks were pooled for each time point for each experiment. All samples were normalized to total RNA at the reverse transcription step. Mean + SE (n=3).
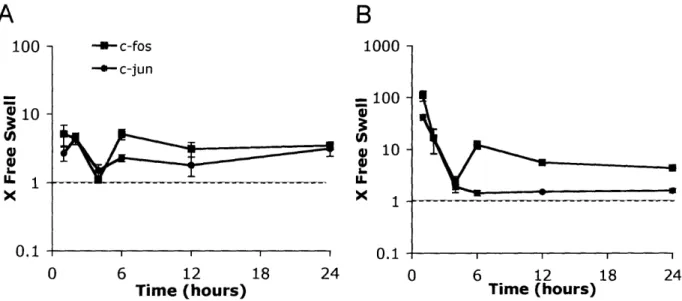
The immediate response transcription factors, c-fos and c-jun, responded to injury with a rapid increase in expression (-120-fold for c-fos and -40-fold for c-jun) within the first hour after injury (Figure 2.5). By 4 hours, both genes returned to -3-fold over free swelling levels and
remained moderately elevated for 24 hours. Another transcription factor, sox 9, which promotes transcription of matrix molecules, did not change expression level significantly during the 24 hours following injurious compression (Figure 2.5). This is consistent with the observed lack of change in expression levels for the matrix molecules shown in Figure 2.3.
1 uUU 100 0 10 X 1 0.1 0 5 10 15 20 25
Time after Injury (hours)
Figure 2.5: Changes in expression level of transcription factors after injurious compression. Values on the y-axis represent fold change from free swelling levels with a value
of 1 indicating similar expression after injury to the level measured in free swelling conditions. Six cartilage disks were pooled for each time point for each experiment. All samples were normalized to total RNA at reverse transcription step. Mean ± SE (n=3).
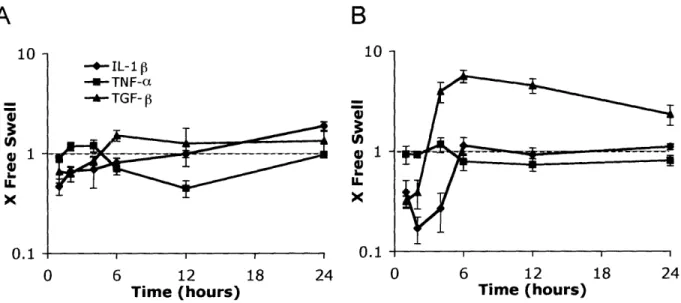
Selected growth factors also showed specific changes in expression level in response to injurious compression. TGF- increased expression in the first 4 hours after injury to a peak value -7-fold over free swelling levels, remained elevated through 12 hours, and then decreased to -4-fold over the free swelling value by 24 hours (Figure 2.6). Insulin-like growth factors IGF-1 and IGF-2 (Figure 2.6) and, similarly, the cytokines IL-I and TNF-a (Figure 2.7) showed little variation with time (not exceeding 2-fold changes compared to non-injured controls) in the 24 hours immediately following injurious compression.
10-C, 1 LL X 0.1 0 5 -- IGF-1 --- IGF-2 --- TGF-P 10 15 20 25
Time after Injury (hours)
Figure 2.6: Changes in expression level of growth factors after injurious compression.
Values on the y-axis represent fold change from free swelling levels with a value of 1 indicating similar expression after injury to the level measured in free swelling conditions. Six cartilage disks were pooled for each time point for each experiment. All samples were normalized to total RNA at reverse transcription step. Mean ± SE (n=3).
10 u) IX X 1 0.1 -+- TNF-a -A- IL-1 B 0 5 10 15 20
Time after Injury (hours)
25
Figure 2.7: Changes in expression level of cytokines after injurious compression. Values on
the y-axis represent fold change from free swelling levels with a value of 1 indicating similar expression after injury to the level measured in free swelling conditions. Six cartilage disks were pooled for each time point for each experiment. All samples were normalized to total RNA at reverse transcription step. Mean + SE (n=3).
l··
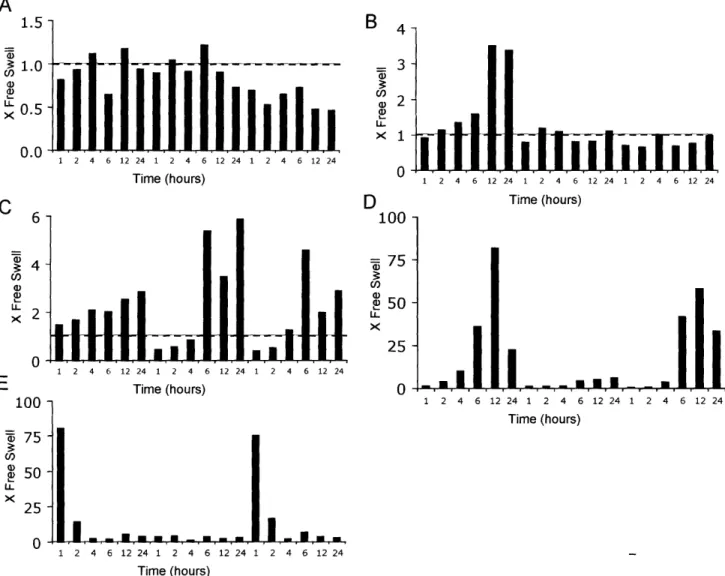
Clustering and statistical analyses of gene expression profiles. Clustering analysis
revealed five groups with distinct temporal expression profiles induced by injury. The group expression profiles are shown in Figure 2.8, and the corresponding group members are listed in Table 2.1 along with the associated p-values that were calculated from t-tests performed at the time points 4 hours and 24 hours after injury to compare control and injured cartilage. In general, the group expression profiles reflect the main traits of the individual genes within each group with average correlation coefficients of 0.90, 1.00, 0.89, 0.77 and 0.88 for groups 1-5 respectively. Comparison of means Student's t-tests revealed that the group expression profiles of Figure 2.8 were distinct. The unique profile of Group 2 was significantly different from expression profiles of Groups 3, 4, and 5 (p<0.05) and Groups 1 and 3 were also significantly different (p=0.006). Groups 1 and 2 expression profiles were found to be not significantly different from each other primarily due to the low number of genes within each of these groups.
2.4. DISCUSSION
A single injurious compression of cartilage has been shown previously to decrease extracellular matrix biosynthesis rates, compromise mechanical properties, and reduce chondrocyte viability (Torzilli, 1999; Loening, 2000; D'Lima, 2001; Kurz, 2001; Patwari, 2003; DiMicco, 2004). We undertook this study to determine if changes also occur at the level of gene expression and to determine if the changes are general or specific to certain genes. Analysis of samples was performed using real-time PCR, which allows the measurement of many genes to be achieved in a high-throughput manner using a relatively small sample volume. We observed significant changes in the expression of several catabolic and anabolic genes in response to mechanical injury, and used k-means clustering (Fitzgerald, 2004) to further analyze gene expression patterns and co-regulation of specific genes that may result from injury.
Gene group behavior. Clustering resulted in separation of the genes into five groups that
displayed distinct behavior after injury (Figure 2.8, Table 2.1). Group 1 contained MMP-3, ADAMTS-5, and TGF-f for which large increases in expression level occurred at early times (within 4 hours) following injury. In addition to directly cleaving matrix molecules, MMP-3 has been implicated as a member of activation cascades of matrix-degrading enzymes, including other MMPs. Stimulation of these three genes immediately after injury may represent an attempt to remodel the damaged matrix by removing some of the matrix molecules or by activating latent molecules in the matrix. The transcription factors c-fos and c-jun (Group 2) showed an immediate transient upregulation followed by a rapid decline within 4 hours. c-fos and c-jun are members of the activating protein-i (AP-1) family of genes that were shown previously to activate MMPs in a chondrocyte cell line after IL-13 treatment (Vincenti and Brinckerhoff, 2002). This is consistent with the activation of several MMPs in Groups 1 and 3 of this study, observed at time points following the increased expression of c-fos and c-jun immediately after injury.