Closing Gaps in Global Access to Biologic Medicines:
Building Tools to Evaluate Innovations in Biomanufacturing
by
Donovan G. Guttieres
B.S. Biomedical Engineering
Boston University, 2016
SUBMITTED TO THE INSTITUTE FOR DATA, SYSTEMS, AND SOCIETY IN PARTIAL
FULFILLMENT OF THE REQUIREMENTS FOR THE DEGREE OF
MASTER OF SCIENCE IN TECHNOLOGY AND POLICY
AT THE
MASSACHUSETTS INSTITUTE OF TECHNOLOGY
JUNE 2018
@
Massachusetts Institute of Technology 2018. All rights reserved.
Signature of Author:
Signature redacted
Donovan G. Guttieres
Institute for Data, Systems, and Society
May 23, 2018
Certified
by:
Signature redacted
Anthony J. Sinskey, ScD
Professor of Microbiology, Department of Biology
Faculty Director, Center for Biomedical Innovation
Thesis Supervisor
Signature redacted
Certified by:
Stacy L. Springs, PhD
Senior Director of Progrurms, Center for Biomedical Innovation, MIT
Thesis Supervisor
Accepted by:
Signature redacted
Munther Daleh, PhD
W. Coolidge Professor, Electrical Engineering and Computer Science
MASSACHUSETTS INSTITUTE
Director,
Institute for Data, Systems and Society
Closing Gaps in Global Access to Biologic Medicines:
Building Tools to Evaluate Innovations in Biomanufacturing
by
Donovan G. Guttieres
Submitted to the Institute of Data, Systems, and Society
in Partial Fulfillment of the Requirements of the
Degree of Master of Science in Technology and Policy
ABSTRACT
Low-and-Middle Income Countries (LMICs) are experiencing a growing need for safe,
effective, and affordable health services, especially medicines. Such trends are in part
due to a continued epidemiologic transition from infectious to chronic, non-communicable
diseases (NCDs). Today, NCDs account for a large portion of total global disease burden:
70% of deaths as per the World Health Organization (WHO). NCDs are projected to
continue to undercut economic productivity and drive up health spending. Many NCDs
are effectively treated using biologic therapies; or large molecules produced by, or
involving, living cells. Recently, some of these therapies have been included on the WHO
Model List of Essential Medicines. However, the molecular, manufacturing, regulatory,
and supply chain features of biologics lead to relatively higher costs and complexity
compared to small-molecule drugs, with implications on widespread access. As part of
the Global Action Plan for the Prevention and Control of NCDs 2013-2020, an 80% target
for global availability of affordable essential medicines has been set for all public and
private providers. In order to reach this target, there is need to better understand the
complex barriers to accessing biologics across the biopharmaceutical value chain.
Current gaps in access indicate the potential need to re-orient the biopharmaceutical
system in order to meet future projected healthcare demand in terms of quantity, quality,
and affordability. There is also growing uncertainty within the biopharmaceutical
ecosystem as to the best use of resources, design of policies, and development of
technologies that will have the most cost-effective impact on maximizing the supply of
and access to such biologics. This research specifically focuses on the manufacturing
component of biologics access, providing an analysis of the benefits and risks across
different production networks, with varying number and location of facilities. A cost
modeling tool is presented for quantitatively analyzing different manufacturing design
options. This is accomplished by comparing the cost of good (COGs) and net present
cost (NPC) of different scenarios, using Trastuzumab (a monoclonal antibody drug used
to treat HER-2+ breast cancer) as a case study. Finally, future research questions are
presented, aimed at better understanding the drivers of variability in manufacturing cost
across manufacturing networks, especially when considering differences in product type,
locations, regulatory jurisdictions, geopolitical zones, and sociocultural norms.
In light of changing global health patterns and increasing demand for quality, affordable
care, the thesis presents tools that can be generalized for addressing tradeoffs,
short-and-long term effects, and intended-and-unintended consequences of investments in
global health. It holds the potential for assessing the potential impact of various
innovations (policies, technologies, organizational structures and more) on complex,
dynamic systems and provide an evidence-base to better inform future areas of research,
design of policies, and development of technologies.
Thesis Supervisor: Anthony J. Sinskey
Title: Professor of Microbiology, Department of Biology
Faculty Director, Center for Biomedical Innovation, MIT
Thesis Supervisor: Stacy L. Springs
Acknowledgements
On the way to completing this thesis, I have been fortunate to receive immense support from family, colleagues, and friends. I am indebted to them for guiding me through the process and allowing me to take full advantage of my two years at MIT. Without their support, this work would not be possible. In the process, they have allowed me to learn and grow, as both a student and member of society. They have also allowed me to pursue areas of both academic and personal interest, further igniting a passion for working towards a more equitable, just, and inclusive society, especially with respect to the right to health and healthcare.
In no particular order, I would like to thank the following people for their tremendous support. You have been, and continue to be, a source of inspiration and guidance for me on this journey:
- My former advisers at Boston University: Dr. Muhammad Zaman and Dr. Veronika Wirtz,
for your continued guidance and helping me take on the path I am on today.
- Professor Tony Sinskey, with an always positive, encouraging and supportive presence. - Stacy, for your unparalleled leadership and willingness to take me on as a student. With
deep gratitude for the opportunities you have provided, it has been a true pleasure working at the Center for Biomedical Innovation and contributing to the team's efforts, especially helping bring the global health focus into fruition.
- Flora, for your incredible resourcefulness, never-ending support, and constant
determination for helping others succeed.
- Paul, for always making yourself available, as well as providing guidance on how to both
break down complex ideas and articulate them in a clear, purposeful way.
- Bill, for your unwavering optimism, relentless energy, mentorship and motivation
throughout the work of this thesis.
- Jim and John, for your expert input throughout the research, as well as challenging us to
think creatively about overcoming complex problems in biomanufacturing and access. I am especially thankful to CASSS for their generous support for this research, especially giving me the opportunity to present at WCBP in 2017 and 2018, which was instrumental in receiving feedback to help orient the work.
- Reuben, for your diligent and rapid feedback along the course of the work, which was key
to steady progress.
- Jackie, Marisia, Franny, Karyn, Betsy, Chris, Eric, and others in CBI for making it a
welcoming and collegiate space that has undoubtedly contributed to my success, as well as promoting our collective mission and mutual respect day after day. This does not go unnoticed and has a major role to play in maintaining a space conducive to effective learning and working.
- Professors I've had during my time at MIT, from whom I have learned new skills and ways
of thinking critically about problems.
- The IDSS and TPP staff for their exemplary support and guidance.
While these small messages do not do justice to the immense support received, I hope they indicate my appreciation and the diversity of resources I had at my disposal in making the thesis a reality. I am eager to delve more deeply into these complex questions and push the boundaries of our current understanding, with the aim of benefitting society by translating knowledge into innovation and eventually real-world impact.
Table of Contents
List of Figures...
9
List of Tables
...
11
Overview
...
12
Background...12Central Question ...
12
Methods ... 14 Sum m ary ... 15Chapter 1: Introduction
...
16
1.1 Trends in G lobal Health
...
16
1.1.1 Changing Global Health Landscape ... 16
1.1.2 Effects of the Changing Epidem iology ... 17
1.1.3 Double Burden of Disease and Global Health Financing ... 18
1.2 W HO Health System s Fram ew ork
...
23
1.2.1 Access-to-Medicines as a part of Health System s... 23
1.2.2. Current Access Levels... 25
1.3 Biopharm aceutical Industry
...
25
1.3.1 Sm all Molecules vs. Biologic Therapies ... 25
1.3.2 Econom ics of health care industries... 26
1.3.3 Trend Towards Local Production? ... ... ... ... ... .. . . . 27
1.3.4 Risks and Incentives ... 28
1.3.5 Increasing Role of Biotherapeutics ... 30
1.3.6 Efforts Aim ed at Enhancing Access... 32
1.4 Biologics Value-Chain...
35
1.4.1 Focus on Supply-Side... 36
1.4.2 Focus on Manufacturing... 37
1.5 Decision Sciences
...
38
1.6 Broader A pplications
...
39
Chapter 2: Building a Q ualitative M odel...
41
2.1 Overview of Biom anufacturing Process
...
41
2.1.1 History of Biom anufacturing... 42
2.1.2 Upstream Process ... 43
2.1.3 Dow nstream Process ... 43
2.1.4 Supply Chain ... 45
2.1.5 Regulatory Landscape ... 45
2.1.6 Challenges with Biosim ilars ... 46
2.2 Design Choices for Biomanufacturing Operations
...
47
2.2.1 Options W ithin a Facility ... 47
2.2.2 Options Across a System ... 49
2.3 Q ualitative Fram ework
...
54
2.3.1 Key Cost Centers...54
2.3.2 Tradeoffs and Considerations ... 56
Chapter 3: Building a Quantitative Model
...
59
3.1 Fram ew ork for COGs Model...
59
3.1.1 Methods...59
3.1.2 Drug Demand ... 60
3.1.3 Manufacturing Process and Operations ... 61
3.1.4 Capacity Requirement...62
3.1.5 Cost Centers...62
3.1.6 Scaling and Costs...65
3.2 Verification, Validation, & Uncertainty
...
66
3.3 Existing M odels and Cost Estim ates...
68
3.4 Baseline M odel & Sensitivity Analysis
...
70
3.4.1 Baseline COGs Model ... 70
3.4.2 Scenarios: single-variable determ inistic sensitivity analysis ... 73
3.4.4 Probabilistic analysis... 76
Chapter 4: Results and Findings
...
81
4.1 Using M odels to Test Innovations...
81
4.2 Research Scope ...
82
4.3 Incentives for Shifting Away from the Current Biopharmaceutical Paradigm..83
4.3.1 Approach...83
4.3.2 Defining "Local" Production... 84
4.3.2 Supply-Side Motivations for Localizing Production ... 84
4.3.3 Dem and-Side Motivations for Localizing Production ... 86
4.3.4 Spatial Factors Influencing Location Selection ... 88
4.4 Consequences of Shifting from Centralized to Distributed Production ...
89
4.4.1 Approach...89
4.4.2 Analysis of Trends... 92
4.4.3 Contextual Considerations ... 93
4.5 Case Study: Trastuzum ab
...
95
4.5.1 Forecasting Demand ... 96 4.5.2 Capacity Requirement...97 4.5.3 Real Options ... 98 4.5.4 Location Selection...100 4.5.5 COGs Analysis ... 102 4.5.6 NPV Analysis ... 107 4.5.7 Analysis of Trends...110
Chapter 5: Discussion and Future Research...113
5.1 Discussion ...
113
5.1.2 Technology and Policy Foresight in Biomanufacturing...118
5.1.3 Future of Distributed Manufacturing ... 120
5.2 Future Research...120
5.3 Conclusion...122
Appendix...124
A ppendix A : Interview Q uestionnaire and Experts
...
124
A ppendix B: Sam ple Codes...125
List of Figures
Figure 1.1: Projected change in mortality from 2000-2030, disaggregated by disease type and in c o m e g ro u p ... 1 7
Figure 1.2: Flows of development assistance for health (DAH) from source to channel to health focus area in Billions of USD , 1990-2017 ... 19 Figure 1.3: DAH by health focus area, cumulative 1990-2017 ... 20 Figure 1.4: Factors affecting global health, their consequences, and building blocks of
responsive health system s ... 24 Figure 1.5: Mapping potential barriers to biologics supply across the value-chain ... 35 Figure 2.1: Core components of the biomanufacturing process... 42 Figure 2.2: Representative networks along the centralized-distributed spectrum of
biom anufacturing and supply... 52 Figure 2.3: Comparing different manufacturing and supply networks ... 54 Figure 2.4: Qualitative framework for designing manufacturing systems that minimize cost and
m e e t to ta l d e m a n d ... 5 8
Figure 3.1: Modeling total drug demand as a function of dosing frequency, dose size, and
n u m b e r o f p a tie n ts ... 6 1 Figure 3.2: Modeling number of batches needed to meet total drug demand as a function of
bioreactor capacity (L), titer (g/L), and yield (%)... 62 Figure 3.4: Modeling the total number of full time employees (FTEs) and labor cost as a
function of production capacity ... 66 Figure 3.5: Relative proportion of different cost centers in the base case for mAb production . 72 Figure 3.6: Changes in baseline annual product volume for worst and best case scenarios of
d ifferent input va riables ... . . 74 Figure 3.7: Changes in baseline COGs for worst and best case scenarios of different input
v a ria b le s ... 7 4
Figure 3.8: Relative proportion of different cost centers as a function of production capacity .. 75 Figure 3.9: COGs for mAbs using baseline model at different production scales ... 75 Figure 3.10: COGs for mAb using baseline model at different production scales and titers ... 76 Figure 3.11: Distribution for COGs of 1000 scenarios of the baseline model... 77 Figure 3.12: Distribution for annual production quantity for 1000 scenarios of the baseline
m o d e l... 7 8
Figure 3.13: Distribution of COGs for 1000 cases as a function of titer ... 79 Figure 3.14: Distribution of COGs for 1000 cases as a function of run duration ... 79 Figure 3.15: Effect of uncertainty function on distribution of COGs relative to the realized
p ro d u ct v o lu m e ... 8 0
Figure 4.1: Expected change in cost centers and other non-cost variables when comparing a centralized model with a decentralized system, each producing the same total product
v o lu m e ... 9 0
Figure 4.2: Projected change in the number of breast cancer deaths disaggregated across W orld B ank incom e groups ... 96 Figure 4.3: Graphical user interface and tool for projecting Trastuzumab demand... 97 Figure 4.4: Distribution of breast cancer deaths and Trastuzumab demand across WHO regions
... 98
Figure 4.5: Global distribution of cell culture capacity in 2012 and 2018, from BioProcess
Technology C onsultants ... 100 Figure 4.6: Distribution of COGs for centralized production of mAbs in each of the six WHO
Figure 4.7: Distribution of COGs for decentralized production of mAbs in each of the six WHO regions (scena rios B1 to B 12 )... 106 Figure 4.8: Distribution of COGs for distributed production of mAbs across the six WHO regions
(sce n a rio s C 1 to C 6 )... 10 7 Figure 4.9: Net present cost for different rates of depreciation ... 108 Figure 4.10: Distribution of NPC values for the centralized production of mAbs in each of the six W H O regions (scenarios A l to A 6) ... 109 Figure 4.11: Average NPC values for decentralized production of mAbs in each of the six WHO
reg io ns (sce narios B 1 to B 12 )... 109 Figure 4.12: Distribution of NPV values for distributed production of mAbs across the six WHO
regions (sce na rios C 1 to C 6 )... 110 Figure 4.13: Variation in the NPC for various manufacturing scenarios of mAb production.... 111 Figure 5.1: Mapping average risk of natural disasters across the global (2012-2016). Source:
The W orldR iskR eport 20 16 ... 116
Figure 5.2: Aligning patient triage across a diagnostic network and biologic supply to ensure
List of Tables
Table 1.1: Countries with the largest increase and decrease in disease burden (1000s of deaths) for both infectious and chronic, non-communicable diseases between each of the following intervals: 2000-2005, 2005-2010, and 2010-2015... 22 Table 1.2: Comparing molecular properties of small-molecule and biologic medicines. Molecular
properties influence clinical outcomes, regulation, and supply... 26 Table 1.3: Examples of push and pull incentives for reduce risk in health care industries... 29 Table 1.4: Biologics and non-biologic therapeutic options for different major disease indications.
... ... ... 31 Table 1.5: Mapping barriers across the supply-side of biologics access, as well as potential
innovations w ithin the health care ecosystem . ... 36
3.1:
3.2: 3.3: 3.4: 3.5: 3.6: 3.7:Calculating
Calculating
Calculating
Calculating
Calculating
Calculating
Calculating
drug demand within a given geographic area
...
quantity of drug produced in a year given specific process operations.. annual labor cost... annual utilities cost... annual materials cost ...annual capital cost ...
annual fill and finish cost ...
60 61 63 63 64 64 64 Table 3.8: Summary of data collected from literature for operations and costs within a typical
sta in le s s s te e l fa c ility ... 6 9 Table 3.9: Baseline model for the manufacturing of monoclonal antibodies (mAbs)... 72 Table 3.10: Worse and best case scenarios for input variables ... 73 Table 4.1: Range of spatial and factors influencing strategic manufacturing decisions... 89 Table 4.2: Qualitative analysis of switching from a centralized to distributed manufacturing
m o d e l... 9 2 Table 4.3: Overview of scenarios for production networks to meet global Trastuzumab demand
... ... ... ... ... 99 Table 4.4: Most likely countries for locating biomanufacturing production sites within each WHO
re g io n ... 1 0 1
Table 4.5: Relative value of different input variables across regions, using the US as the
b a s e lin e ... 1 0 2
Table 5.1: Ranking countries based on export and direct investment risks... 114 Table 5.2: Ranking countries based on exposure and vulnerability to natural disasters ... 116 Table 5.3: Ranking countries based on indicators within the Global Competitiveness Index.. 117 Table Table Table Table Table Table Table
Overview
Background
The global health landscape is experiencing rapid change, with an epidemiological transition from infectious to chronic, non-communicable diseases (NCDs). NCDs account for approximately 70% of deaths worldwide, 75% of which occur in low-middle income countries (LMICs). Of these, 40% are considered to be "premature", preventable deaths that occur before the age of 70. The shift to NCDs has led to major social and economic loss, cumulatively more than $7 trillion in LMICs alone between 2011-2015. It has also increased pressure on health systems dealing with the double burden of NCDs and infectious diseases. Leading treatments for many of these chronic diseases are biotherapeutics, with promising clinical outcomes but complex manufacturing, regulatory and supply systems that jeopardize widespread access. This raises questions as to whether the current biopharmaceutical ecosystem is fit-for-purpose and whether health system capacities will be able to meet future projected healthcare needs in terms of quantity, quality, and
affordability.
There is uncertainty within the biopharmaceutical ecosystem as to the best use of resources, design of policies, and development of technologies that will have the most cost-effective impact on maximizing the supply of, and access to, such biotherapeutics, especially in LMICs. Evidence-informed tools for addressing tradeoffs, short-and-long term effects, and intended-and-unintended consequences of investments are lacking. In light of growing disease burden, along with a shift towards personalized care and shrinking resources, a decision support tool is presented to inform stakeholders about the influence that innovations (policies, technologies, organizational structures and more) have on the biopharmaceutical ecosystem. This is done through both quantitative and qualitative analysis of economic and other contextual factors.
Central Question
To date, both the manufacturing of and market for biologics has been heavily concentrated in the US, Western Europe, and Japan. Identifying barriers and increasing understanding of this complex system is an important first step towards closing gaps in access to the growing demand for lifesaving therapeutic treatments. This will then allow diverse stakeholders within the biopharmaceutical ecosystem to identify levers most conducive to change and design innovations around them. Access to medicines requires alignment between the sustained supply of
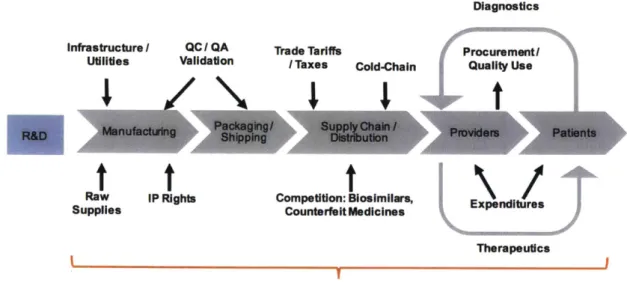
high-quality, safe, and efficacious products and patient demand driven by disease identification and care-seeking behavior. Barriers to the reliable supply of biotherapeutics exist throughout the entire product value chain: drug discovery, clinical development, manufacturing, distribution and global delivery, marketing and reimbursement policy, drug use, and clinical care. Additional barriers arise from the unique economic, regulatory, political, social, and cultural environment of individual local markets. The extent to which these factors influence access vary greatly over context, geographies, and products. The thesis focuses on the upstream component of the value-chain, specifically decision making when considering different manufacturing designs for a particular biologic product.
Historically, the biopharmaceutical industry has concentrated manufacturing of biologic products to several geographic locations, largely in developed countries. This can partly be explained by the opportunities provided by economies of scale to make up for the large capital investment cost required in stainless-steel plants. Manufacturers have also sought to locate these sites in settings that provide conducive economic and regulatory environments, for example through tax breaks and subsidies. More recently, there has been increased interest in establishing manufacturing sites in multiple locations at a time, to lower risk of supply chain interruptions, as well as in frontier
markets. This is driven by a host of other factors, such as increased nationalization policies (mandates that require in-country manufacturing to sell in the national market), potential for expansion into emerging markets, national strategies for reducing risks of drug shortages by reducing dependence on external imports, and economic benefits from investing in a local biomanufacturing industry.
The thesis seeks to compare the cost-effectiveness of different manufacturing networks across the spectrum of centralized and distributed models. Analysis of different manufacturing designs is done by comparing the cost of good (COGs) and net present cost (NPC) of different scenarios, using Herceptin (a monoclonal antibody drug used to treat HER-2+ breast cancer) as a case study. A qualitative overview of both cost and non-cost factors is presented to better understand the potential benefits and risks that might emerge when transitioning from a centralized to a distributed manufacturing network. Finally, the thesis points to future research questions aimed at better understanding the drivers of variability in cost-effectiveness across manufacturing networks, especially when considering differences in product type, locations, regulatory jurisdictions, geopolitical zones, and sociocultural norms.
End-to-end solutions across health systems, coordinated among all relevant stakeholders, will be key to overcoming future biologic shortages and closing the widening gap between supply and demand of life-saving or life-extending biotherapeutics. Therefore, better understanding the biopharmaceutical ecosystem is key to generating technically-informed policy options and orienting technological development in ways that will allow decisions makers to more comprehensively assess the impact of different manufacturing models on access.
Methods
Conduct qualitative interviews with experts from the biopharmaceutical industry and global health
field, including leaders from multinational companies, start-ups, regulatory agencies, academia and non-profit foundations to determine major cost centers in the value chain of biologics, especially manufacturing and supply chain. Interview questions were designed with a group of advisors, along with preparatory material to help guide the discussion with interviewees. These interviewees were also engaged in verifying the quantitative models that emerged from the research.
Develop a qualitative operations framework for mapping the drivers and barriers to global
biologics access, as well as primary costs centers that are most influential in decision making. This was developed as a result of the interviews conducted, national level data (e.g. WHO and World Bank) on prevalence of disease and indicators for medicines access (e.g. imports, financial budgets, shortages, etc.), and extensive literature review. The framework borrows from the WHO
Health Systems Building Blocks and other established models used in process manufacturing,
supply chain, service delivery, national innovation systems, and public health.
Develop a quantitative economic model to determine the most optimal manufacturing and supply
chain design that meet global demand for a given biotherapeutic product, while maintaining high-quality and cost-effectiveness. This will be accomplished in the following steps:
- Developing a baseline, deterministic cost model for the manufacturing of monoclonal antibodies in both stainless steel and disposable systems;
* Performing sensitivity analysis to identify key cost drivers;
- Multi-criteria comparison of manufacturing designs based on cost, product volume, and other variables of interest, as well as technology and policy implications considering a
range of social, economic, political, institutional, and environmental factors.
Summary
Chapter 1 starts by presenting trends in global health, outlining the reasons for and demonstrating the behavior of the shift from infectious to chronic diseases, especially in LMICs. It goes further to introduce the role of biologics for various chronic diseases and their unique attributes that make widespread access a challenge. Finally, it focuses the scope of the research to the manufacturing of biologics, a key component to ensuring its sustained supply.
Chapter 2 presents design options faced by biopharmaceutical companies when deciding how to produce a given biologic product. It highlights key differences that can arise across the spectrum from centralized to distributed manufacturing, as well as outlines a qualitative model for calculating the cost of goods (COGs).
Chapter 3 presents a quantitative model for estimating the COGs for the production of monoclonal antibodies, specifying the input variables for each of the cost centers, as well as sensitivity and uncertainty to demonstrate the model's ability to reflect real world and user-specified conditions. Chapter 4 begins with qualitative analysis of cost and non-cost risks and benefits of shifting from centralized manufacturing (producing total drug volume in one large, stainless steel facility) to a distributed network (producing drugs across 6 facilities, one in each WHO region, with small single-use, disposable bioreactors). The second part of chapter 4 uses Trastuzumab, an effective therapy for HER-2+ breast cancer, as a case study to compare the COGs and net present cost (NPC) for 84 manufacturing scenarios, ranging in location and levels of distribution.
Chapter 5 introduces the importance of incorporating exogenous variables, which may give more insight into the risks that can arise across locations with unique social, economic, and environmental conditions. It also provides a discussion of the results and future potential research directions.
Chapter 1: Introduction
1.1 Trends in Global Health
1.1.1 Changing Global Health Landscape
The health of a country is influenced by population dynamics and is a consequence of social
welfare, economic development, environmental factors, and underlying genetic predispositions
[1]. Rather than viewing disease in isolation, long-term shifts in mortality and disease patterns
reveal that with socioeconomic development, pandemic infections are replaced by chronic,
non-communicable and other degenerative diseases [2].
The epidemiologic transition from infectious to chronic, non-communicable diseases (NCDs) is
expected to continue due to several complex and interconnected factors
[3].
A demographic
transition is taking shape, driven by decreasing birth rates and increasing life expectancy. This
results in shifting the share of diseases to chronic conditions, such as those associated with older
age [4,5]. Development trends accelerated by economic growth coincide with increasing
urbanization, changing lifestyles (e.g. food consumption patterns, sedentary behavior, and risks
factors such as smoking and alcohol use), and growing purchasing power that leads to increasing
expenditure on healthcare [6,7]. Anthropogenic climate change also serves as a signal of
unsustainable natural resource extraction, pollution, release of toxic chemicals, and other
environmental risks that are exacerbating the shift to NCDs, especially cardiovascular and
respiratory conditions [8].
The US, Europe, and Japan were among the first to experience the epidemiologic transition
described above. The shift to chronic diseases continues to rise, already accounting for 90% of
deaths each year in the US [9]. These trends are starting to take form in low-and-middle countries
(LMICs) as well, further imposing pressures on already fragile health systems.
Today, more than 70% of deaths globally are due to NCDs, with LMICs bearing disproportionally
higher burden of both infectious and non-communicable chronic diseases [10] This is partly a
result of disparities between LMICs and higher-income countries in access to prevention,
diagnosis, and care [11] It can also be explained by competing development-related priorities and
less stable economic, environmental, political, and social conditions in LMICs [12]. The increase
in mortality due to NCDs is not just higher in LMICs. A disproportionate number of premature
(preventable or occurring under the age of 70) NCD-related deaths, are concentrated in these
regions [10]
Data from the World Health Organization (WHO) on mortality projections for 2015 and 2030 for
LMICs and high-income countries were analyzed to measure disease rates [13]. Figure 1.1
presents projected changes in mortality disaggregated by cause (infectious or chronic disease)
and stratified across World Bank income groups based on gross national income per capita
(low-and-middle and high) between 2000 and 2030. During this time, the share of deaths attributed to
NCDs
in LMICs is projected to substantially increase from 55% in 2000 to 71% in 2030. Data on
the rate of change in the total and per capita number of deaths indicate that shifts towards NCDs
are expected to concentrate in LMICs, while the number of infectious disease-related deaths will
decrease.
Number of Deaths by Disease Type and
Projected Change in Number of Deaths per
Across World Bank Income Groups
100,000 Between 2000-2030
(2000-2030)
8
60,000
150
2 50,000
N Infectious
in
. 40,000
ICs
30,000
M Infectious
in
c&
50
~o>~o~#o~cf
#&~&
LMICs
-0
20,000 LMiCs
1,0M*NCDs
in
HICs0
E V V-50 :3 0 0 NCDs in CU CP C C P C LM ICs -0Figure 1.1: Projected change in mortality from 2000-2030, disaggregated by disease type and
income group (data derived from WHO Global Health Observatory)
1.1.2 Effects of the Changing Epidemiology
NCDs are a major contributor to social and economic loss, due to both health care cost and
reduction in economic productivity. These losses are estimated to total over 7 trillion USD
between 2011-2025 in LMICs alone [14]. This has also placed political pressure on different
stakeholders to take action to improve health care: governments to provide universal health care
(UHC), philanthropy to finance healthcare access programs, pharmaceutical companies to make
life-extending and life-saving medicines more affordable, and patient groups to advocate for the human right to health.
While NCDs become more pervasive in LMICs, infectious pandemics (e.g. Ebola, Zika) continue to be a threat and lead to a double-burden on health systems. This situation is further complicated by the rise of antimicrobial resistance diminishing the effectiveness of once-potent medicines and the chronic nature of many infectious diseases that require life-long management. The chronicity and slow progression of disease can exacerbate costs to both patients and health systems. Given the evolving epidemiology in LMICs, current systems focused on acute, reactive, and episodic care may have difficulty shifting to chronic care models [15]. Innovation will play an important role in attaining the triple aim of access to care, quality of services, and cost-effectiveness of treatment for both patients and the healthcare system [16].
1.1 .3 Double Burden of Disease and Global Health Financing
As NCDs continue to increase in LMICs, infectious conditions will still need to be addressed, while the risk of re-emerging epidemics remains. Overcoming the double burden of infectious diseases and NCDs remains a challenge, as health budgets and donor funding continue to be channeled into vertical, disease-specific programs that influence research, policy, and development agendas. Of the $37.4 billion of development assistance for health (DAH) provided to LMICs in 2017, close to 40% was allocated to infectious diseases (primarily HIV, Malaria, and TB), 30% went to maternal, newborn and child health, while less than 3% was allocated for NCDs [17]. Figures 1.2 and 1.3 map the year-to-year and cumulative DAH, respectively, according to disease area between 1990-2017. Looking holistically at health systems, and recognizing the interdependent nature of risk factors for IDs and NCDs, there is a growing need to coordinate global health assistance and activities for maximum impact on global health and to avoid duplication or cross-purposing of efforts.
Health Focus Area Philanthropy $67.8 (excluding B&MGF) B&MGF $29.0 Other Sources $68.5 Other Governments $122.4 Australia $8.7 Canada $14.3 France $21.9 Germany $25.3 United Kingdom $41.8 United States $194.3 DewtiiUhtkS63Ab
|-I
11wi
SIbiflmaIsSlOhi HIV/AIDS $141.0 Malaria $27.2Maternal, Newborn, & Child Health $173.8 NCDs $9.6 Other Infectious Diseases $24.6 Other $96.9 HSS/SWAps $81.3 Tuberculosis $17.5 Unallocable $22.1 .E
Figure 1.2: Flows of development assistance for health (DAH) from source to channel to health
focus area in Billions of USD, 1990-2017. Note: HSS = Health systems strengthening, SWAps =
Sector-wide approaches, B&MGF = Bill and Melinda Gates Foundation. Source: Financing Global
Health Database 2017.
Source Channel
40 38 36 34 32 30 28
Othet hedl- h afus tre'
~26
4HSS/SWAps
2Oqhef
infec24uh u
Non-communicabe dseases
C)20 - -Matern&, newbom, and child health
16
*
Tubereuoss 114 - HI/AIDS 18 6 4 2Figure 1.3: DAH by health focus area, cumulative 1990-2017. Note: HSS
=Health systems
strengthening, SWAps
=Sector-wide approaches. Source: Financing Global Health Database
2017.
An integrated approach to health systems can help identify the overlaps and parallel activities
present across the patient care continuum of prevention, diagnosis, treatment, and management.
For example, ID and NCD patients may have similar challenges with compliance during disease
management (e.g. diabetes and HIV/AIDS), making training and innovative technologies aimed
at improving patient compliance potentially suitable for both. A challenge will be to re-design
health care systems to incentivize system-wide improvements and coordination of activities.
Health sector reforms that move away from siloed, disease-specific program to cross-sector
system-wide investments are needed to enhance the impact of global health investment and build
responsive health systems in light of rapidly changing demand [18].
Several synergies can be outlined between NCDs and infectious diseases:
Epidemiology: Both infectious diseases and NCDs have overlapping high-risk populations and
risk factors such as rural-to urban migration and low socio-economic levels. Infectious agents have shown to trigger various cancers, most of which disproportionately impact LMICs (e.g. cervical cancer with human papillomavirus, liver cancer with hepatitis B/C viruses, gastric cancer with bacterium Helicobacter pylori, Kaposi's sarcoma with human herpes virus, and Burkitt lymphoma with Epstein-Barr virus, among others) [19]. Patients with NCDs also tend to be more susceptible to infections. For example, diabetics have an increase risk of contracting malaria and TB, while aggravating other chronic diseases like cardiovascular complications. Even though data is limited, the proportion of TB cases attributed to diabetes is 12.9% (250,000 cases) in India and 7.8% (100,000 cases) in China [20]. As the prevalence of diabetes is expected to rapidly increase, the proportion of diabetes-attributed TB cases is also expected to rise. People may have an increased risk of contracting either infectious or non-communicable disease due to changing environmental (e.g. pollution, water quality, air quality) and social (e.g. smoking, alcohol, physical inactivity) risk factors.
Disease management: Many infectious diseases (e.g. HIV) are becoming increasingly chronic in
nature, requiring long-term management and care. Alternatively, some chronic diseases can leave patients with a relatively short life expectancy and duration of treatment. Complications such as diabetic ketoacidosis and myocardial infarction even require acute care. Improved surveillance systems to track prevalence of disease, especially of comorbidities between infections and NCDs in LMICs, can reduce preventable death. Prevention programs aimed at promoting healthy livelihoods addressing the full range of risk factors that give rise to diseases, as well as structural changes outside the health sector (e.g. urban planning, sanitation), would help reduce burden of all diseases.
Health service delivery: Opportunities for working at the interface of infectious and chronic
diseases can be identified across the value chain- capacity building activities encouraging promotive behavior, prevention and primary care; task shifting for care delivery; digital technologies, telemedicine and other mobile health applications; patient stratification and triage; promoting patient empowerment; promoting conditions conducive to health financing for universal coverage; health technology assessments; rapid on-demand diagnostic tests; overcoming reliance on syringes; overcoming cold-chain and extending shelf-life of drugs; identifying
counterfeit or substandard drugs; last mile delivery of health services; effective forecasting,
procurement, and inventory management systems [21, 22, 23].
Regulation: Regulatory capacity, establishing standards, and harmonization across jurisdictions;
data quality and integrity; digitization (e-health) and interoperability of health information systems.
Looking more closely into WHO's mortality data, the epidemiological changes can further be
characterized across time (2000-2015) and space (183 countries in the WHO database).
Generally speaking, the proportion of deaths due to NCDs increases with time, while those
attributed to infectious diseases decreases. This is consistent with the data presented in figure 1.
Outliers can help draw links between the observed change and known social, economic, or
environmental conditions within a country. For example, Table 1.1 shows that the rate of
infectious disease related deaths had the highest increase in South Africa between 2000-2005,
with over 135,500 new cases. This can be attributed, in part, to the HIV/AIDS epidemic that
peaked during that time. The unexpected increase in infectious disease-related deaths in Russia
between 2010-2015 can be explained by the steep rise in the incidence of HIV in the late 1990s,
as well as spread of an antimicrobial resistant strain of Tuberculosis [24].
Infectious Diseases
Chronic Noncommunicable Diseases
Year
Largest Decrease
LargestIncrease
Largest Decrease
Largestincrease
2000-
India (-111)
South Africa (135)
Germany (-12)
India (421)
2005
Ethiopia (-87)
Mozambique (15)
Georgia/Netherlands (-4)
China (385)
2005-
India (-319)
North Korea (5)
Russia (-136)
India (575)
2010
Nigeria (-219)
Germany (3)
Ukraine (-39)
China (385)
2010-
India (-242)
Russia (9)
Russia (-89)
China (936)
2015
South Africa (-86)
Somalia (8)
Ukraine (-41)
India (587)
Table 1.1: Countries with the largest increase and decrease in disease burden (1
000s
of deaths)
for both infectious and chronic, non-communicable diseases between each of the following
intervals: 2000-2005, 2005-2010, and 2010-2015.
The table also indicates steady and steep increase in NCDs burden for India and China, which is
continuing today without indications of slowing down in the near future. As both countries become
more industrialized, urbanized, and economically wealthy transportation and mobility systems are
making people less physical active, food has become increasingly processed, and pollution is
threatening long-term resilience of natural systems and health of individuals. Looking at
country-level changes in disease burden is informative in understanding the degree to which different factors influence population health outcomes.
1.2 WHO Health Systems Framework
1.2.1 Access-to-Medicines as a part of Health Systems
Many complex parts, both within and outside the health sector, interact in a dynamic way to influence health system performance. This makes such systems one of the most complex to understand and act on. In order to identify indicators and strategies for measuring impact, the WHO has developed a useful framework for better understanding the core components needed to achieve responsive and efficient health delivery, while ensuring social and financial risk protection [25]. Namely, the six health system "building blocks" are (i) service delivery, (ii) health workforce, (iii) health information systems, (iv) access to essential medicines, (v) financing, and (vi) leadership/governance. Other conceptual frameworks have outlined more complex relationships between market players (e.g. government, private sector, not-for-profit sector, informal networks, etc.) and across jurisdictions (e.g. global, regional, national, and sub-national).
Rational use of medicines can be understood as selecting an appropriate bundle of medicines that reflect a country's health situations. While standards are usually set at the national level, realities may be different across districts within a country or even across clinical sites. Rational use involves choosing the right medical products that are efficacious, safe, and cost-effective. To translate these principles into practice, the WHO has instituted and published essential medicines lists (EMLs) since 1977, serving as a basis for countries to develop their own national EMLs. These are updated regularly to reflect changing burden of disease and thus relative demand for different drugs. However, identifying a list of essential drugs does not guarantee affordable access, integrity of supply chains, or meeting patient needs. The price of drugs has a major influence on people's ability access to quality care, especially with out-of-pocket (or household income) expenditure accounting for a close to 40% of overall health spending in LMICs [26].
Recognizing the complex nature of medicines access, efforts have been made to embed it within the broader framework of health systems [27]. This allows for better understanding of the levers across the demand and supply side that are most influential to access and where they operate within the system. Several conceptual frameworks for access to medicines are worth noting. The WHO-MSH 2000 "Ferney-Voltaire" framework, building upon the work of Penchansky and
Thomas in the 1980s, focuses attention on barriers at the level of service-delivery by highlighting
4As (availability, accessibility, acceptability and affordability) with quality of products and services
as a cross-cutting determinant. A later model developed in 2004 by WHO, the 'equitable access
to essential medicines framework", focuses largely on the pharmaceutical and health sector level
by highlighting four different dimensions in medicines access: rational selection, affordable prices,
sustainable financing, and reliable health and supply systems. In 2010, Frost and Reich looked
specifically at medicines access in low-income communities, developing a framework that focuses
on a different set of 4As: architecture, availability, affordability, and adoption.
The framework presented by Bigdeli et. al (2012) seeks to move beyond the linear input-output
representation of health services seen until now, rather using system thinking to design a more
circular and dynamic model. This new approach gives more recognition to the unique social,
political, and economic contexts in which health systems exist, as well as influence from policy
actors across the spectrum, from local to international. Particularly, it emphasizes the role of
governance in relation to market forces, innovation, transparency, and donor agendas. Rather
than seeing medicines as just one building block, it makes medicines access dependent on all six
WHO Building Blocks functioning. Figure 1.4 links both drivers of the epidemiologic change from
infectious to chronic disease and components for ensuring responsive health systems to link the
discussions of health systems strengthening with changing trends in global health.
Ageing
UrbanizaIon
Morbidity MortalityEconomic Growth Economic Lose
Lifstyle Chengps Social Expenditure
Poor Diet I Exercise Prevalence Premature Lower Age Environfnental Radm of NCDs Deaths of Onset
Responsive Health Systems Financing MedicdnesalagnoauiculTech Skied worlkore Governance information Health-aervice delivery
Figure 1.4: Factors affecting global health, their consequences, and building blocks of
responsive health systems
1.2.2. Current Access Levels
A core component of any functioning health system is the timely access to safe, effective, and affordable medicines [28]. The access-to-medicines discussion is often part of the broader dialogue on the right to health and universal health coverage (UHC) [29]. The WHO Global Action Plan for the Prevention and Control of NCDs (2013-2020), a follow-up to commitments made in the 2011 General Assembly High Level Meeting on NCD prevention and control, has set an 80% minimum target for availability of affordable essential medicines in both public and private sectors of every country by 2025 [30]. A recent study, analyzing 2008-2015 data from across 30 LMICs on essential medicines to treat NCDs, showed that availability and affordability (less than one full day's wage for a 30-day supply of medicine) in public and private sector providers were, in many countries, below this 80% target [31]. For all countries, regardless of World Bank Income group, median availability of generic therapeutics did not exceed the minimum target for any of the four disease groups (cardiovascular, diabetes, COPD, and CNS) in the public sector, while only cardiovascular medicines reached availability targets in the private sector. None of the measures of median availability of originator brands passed the published targets. Affordability of in-stock medicines were also below targets. In order to provide safe and effective treatments to those who need it, additional challenges within the biopharmaceutical and healthcare ecosystem need to be overcome in order to adequately supply biologics.
1.3 Biopharmaceutical Industry
1.3.1 Small Molecules vs. Biologic Therapies
The above access challenges are particularly difficult with respect to biologic medicines, or "biologics". Biologics are a subset of pharmaceutical drugs that use biologic systems (e.g. microorganisms, animal cells, plant cells, tissues, or enzymes) to produce therapeutics [32]. Historically, the biologics market has been concentrated in the US, Europe, and Japan, though it is growing in other countries. Over the past few decades, platforms have evolved to allow for numerous products, including vaccines, proteins, and cellular and gene therapies. Compared to small molecule drugs, biologic products are more chemically complex, have very large molecular weight, and are comprised of heterogeneous structures as a result of unique post-translational modifications [33]. Table 1.2 highlights the primary differences between properties of small molecule drugs compared to biologic medicines. These molecular properties, along with distinct R&D, intellectual property, manufacturing, supply chain, and market features, lead to challenges
in ensuring the sustained supply of biotherapeutics. If these challenges are not explicitly
addressed, the WHO essential medicine targets may not be reached.
Essential biologic medicines can be used as primary therapeutics or as adjuvants to
small-molecule drugs for management or treatment of NCDs. Biologics are key elements of treatment
for diabetes and cancer, two of the fastest growing NCDs. Insulin and the anti-cancer monoclonal
antibodies such as Trastuzumab, Rituximab, and Bevacizumab are all on the WHO Model List of
Essential Medicines, and some groups are advocating for inclusion of more biologics despite their
high cost [34]. With the accelerating growth of NCDs expected in LMICs, access to biologics will
become an increasingly important issue, as discussed below [35].
Size / Molecular Small / Low Large / High Weight
Structure Simple, well-defined Manufacturing Chemical uynthcsis
kenticl copies
Stability Stable Immunogenicity Mostly not
Complex, heterogeneous CCl cuure Impossible to ensure
Acetysaliylic identical copy
Acetylsalicylic Unstable (temperature, Trastuzumab acid light, etc.) (Herceptin) (Aspiin)
Generics Common, lower Rare, similar price price
Table 1.2: Comparing molecular properties of small-molecule and biologic medicines. Molecular properties influence clinical outcomes, regulation, and supply.
1.3.2 Economics of health care industries
Global spending on medicines is projected to reach 1.8 trillion USD by 2018, an increase of 30% since 2013 with a compound annual growth rate of 4-7% on a constant currency basis [36]. The US market has been and continues to be the largest spender, accounting for one-third of the total with an expected annual growth rate of 5-8%. Growth is expected as a result of health reforms that are increasing demand for medicines, while the pharmaceutical industry experiences a shift from low-cost small-molecule drugs with an extensive generics markets, to high-cost biologics and specialty medicines with a nascent biosimilars market. Biologics comprise an increasing share of the pharmaceutical industry by sale and volume. The global market for biopharmaceuticals is approaching 300 billion USD, growing at about 15% annually, while making up 30% of products [37].
Biomanufacturing, and the industry as a whole, has strong roots in the US, with many companies based in-country due to market size, economic opportunities, relative sociopolitical stability, the presence of a highly educated and skilled workforce, and reliable infrastructure. To maintain their competitive advantage, many small-molecule manufacturers are beginning to explore biologics, raising questions regarding innovation and competition policies in the biopharmaceutical industry [38]. The Biologics Price Competition and Innovation Act passed in 2010, for example, outlines a biosimilar approval pathway modeled after the Hatch-Waxman Act's generic drug approval pathway, but with much more stringent definitions of what "highly similar" means. The complexity in characterizing biologics and demonstrating equivalence will likely limit the competitive, price-reducing potential of biosimilars and continue to impose financial strain on the health system as demand for biologics and other specialty drugs continues to increase. As demand grows, resources shrink, and biomanufacturing capacity wanes, new innovation policies will be important to lower costs, increase efficiency, ease patient administration, and maintain domestic competitive
advantage [39].
Despite the prevailing barriers to access, pharmaceutical medicines already constitute a large portion of the US's healthcare budget. Biotherapeutics account for less than 1 % of prescriptions filled but nearly 28% of drug spending, with expenditure growing three times faster than for small-molecule drugs [40, 41]. Since biosimilars are not expected to have the price-reducing effects previously observed with small-molecule generics, expenditure on biologics forecasted to account for up to 40% of drug spending by 2020 [42, 43, 44, 45].
1.3.3 Trend Towards Local Production?
Historically, the biomanufacturing industry has concentrated manufacturing of biologic products to several geographic locations, largely in developed countries (i.e. EU, US, and Japan). This allows them to take advantage of economies of scale needed to make up for the large capital investment cost in stainless-steel plants. Manufacturers have also aimed to locate these in settings that provide tax break and subsidies, taking advantage of unique laws in certain jurisdictions. More recently, there has been increased interest in establishing manufacturing sites closer to markets and in multiple locations at a time to lower risk of interruptions in the supply chain, as well as in emerging markets. This is driven by a host of factors, including economic incentives, increasing nationalization (mandates to manufacture locally to gain market access),
proximity to markets that currently lack access, the degree to which it has influenced overall access in resources-depleted regions is questionable. Given that the existing biomanufacturing process requires high costs of capital, highly-skilled labor (much more than small molecule drugs), and reliable infrastructure (e.g. clean water, energy, etc.), a more centralized approach that leverages economies of scale appears to still be more cost-effective. However, as manufacturing and supply chain technologies and policies evolve toward lower cost of capital, distributed models may become more financially attractive and a promising avenue for expanding global supply. Tools are needed to better assess the relative risks, value and tradeoffs of different manufacturing models on both cost and access [46].
1.3.4 Risks and Incentives
The risk-averse nature of the pharmaceutical industry is worsened when looking at biologic therapies, especially vaccines or products for conditions that disproportionally affect LMICs. Compared to small-molecule drugs, biologics often involve longer and more expensive clinical trials, while establishing bioequivalence for biosimilars is more challenging than making generics. In LMICs, there is an additional challenge related to uncertainty in market size and low purchasing power, which can make it unattractive for multi-national companies to serve these patients.
Despite risks associated with R&D investments, pharmaceutical companies are uniquely suited to develop the products necessary to provide care. The industry and regulations around it ensure high quality, safe, and efficacious products that demonstrate positive health benefits compared to
no treatment. The industry also takes advantage of economies of scale in order to manufacture
products in large enough volumes to meet demand, as well as lower costs of production. However, traditional incentives such as patent protection are not enough for pharmaceutical companies to heavily invest in R&D and manufacturing in LMICs. As little as 16 of the 1400 new medicines developed between 1975 and 1999 were for neglected diseases, amounting to just 10% of R&D specifically for indications unique to LMICs, highlighting the extent of the problem and associated market failure [47, 48]. Therefore, novel financing mechanism need to be designed to better incentivize investments aimed at addressing diseases increasingly concentrated in LMICs. Table 1.3 highlights major "push" (cost-reducing) and "pull" (demand-creating) policies under consideration for stimulating R&D and the types of risks do they hope to overcome [49, 50].
Both push and pull incentives have mixed positive and negative attributes. For example, while many push incentives such as grants can reduce deterrence pharmaceutical companies have to
R&D investment, it may lead to competition, potential duplication of efforts, and fails to promote sharing of ideas across industry players. Pull incentives, such as advanced purchase commitments can offer the tantalizing opportunity for revenue, but may underestimate actual demand and thus limit production volume in ways that adversely influence health outcomes. These mechanisms can also work synergistically to maximize incentives offered to pharmaceutical companies. Both address different aspects of the risk-adjusted net-profit-value and thus influence company decisions. Push incentives help reduce costs of R&D and manufacturing, while pull incentives help promote revenue. Thus both types of incentives are aimed at maximizing profit and addressing economic uncertainties surrounding investment.
Incentive Type of Risks Addressed
Incentive
Product development Push Reduce costs of exploratory research, clinical
partnerships (e.g. public trial, development and manufacturing. Costs
research funding grants) can be subsidized by philanthropic agencies,
governments, or other generous funders.
Tax breaks and subsidies Push Cost savings
Accelerated approval Push Expedite time to market and potential reduce clinical trial and regulatory costs.
Open access to research (data, Push Leverage existing research can lead to cost
molecular libraries, etc.) savings since early development has already
been done.
Development assistance (e.g. Pull Ensures that a market exists and some market guarantees in the form revenue stream will be generated, despite
of advanced purchase patients no having the purchasing power.
commitments) These can either be in volume or purchase
price, though are not always respected.
Prizes for successful Pull Immediate monetary reward for putting an
development/approval of approved drug into the market ensures some
therapy revenue independent of sales.
Extended market exclusivity Pull Extends period for attaining revenue from product before competition.
Priority review vouchers Pull Typically reduces review time at the FDA by about 4 months; vouchers have been sold for an average of $200 million each, thus serving as an alternate source of revenue.
Liability limitations, anti-trust Pull Reduce potential future costs during
post-waivers approval market surveillance.
Table 1.3: Examples of push and pull incentives for reduce risk in health care industries
Both push and pull incentives have mixed positive and negative attributes. For example, while many push incentives such as grants can reduce deterrence pharmaceutical companies have to R&D investment, it may lead to competition, potential duplication of efforts, and fails to promote