Publisher’s version / Version de l'éditeur:
Vous avez des questions? Nous pouvons vous aider. Pour communiquer directement avec un auteur, consultez la
première page de la revue dans laquelle son article a été publié afin de trouver ses coordonnées. Si vous n’arrivez pas à les repérer, communiquez avec nous à [email protected].
Questions? Contact the NRC Publications Archive team at
[email protected]. If you wish to email the authors directly, please see the first page of the publication for their contact information.
https://publications-cnrc.canada.ca/fra/droits
L’accès à ce site Web et l’utilisation de son contenu sont assujettis aux conditions présentées dans le site LISEZ CES CONDITIONS ATTENTIVEMENT AVANT D’UTILISER CE SITE WEB.
Paper (National Research Council of Canada. Division of Building Research),
1976
READ THESE TERMS AND CONDITIONS CAREFULLY BEFORE USING THIS WEBSITE.
https://nrc-publications.canada.ca/eng/copyright
NRC Publications Archive Record / Notice des Archives des publications du CNRC :
https://nrc-publications.canada.ca/eng/view/object/?id=e9b3dc2d-be7d-4b71-8380-ac949a53a04a https://publications-cnrc.canada.ca/fra/voir/objet/?id=e9b3dc2d-be7d-4b71-8380-ac949a53a04a
NRC Publications Archive
Archives des publications du CNRC
For the publisher’s version, please access the DOI link below./ Pour consulter la version de l’éditeur, utilisez le lien DOI ci-dessous.
https://doi.org/10.4224/40000380
Access and use of this website and the material on it are subject to the Terms and Conditions set forth at
Settlement analysis of the Gloucester test fill
Lo, K. Y.; Bozozuk, M.; Law, K. T.
TH1
-
N21dno.
691
c . 2 National Research Conseil national
k
Council Canada de recherches Canada-
ANALYZED
SETTLEMENT ANALYSIS OF THE GLOUCESTER
TEST FILL
1 by K.Y. Lo, M. Bozozukand K.T. Law
4
Reprinted from
Canadian Geotechnical Journal, Vol. 13, 1976,
15p.
DBR Paper No. 691
Division of Building Research
Canadian
Geotechnical
canadienne de
Revue
ANALYZED
Journal
geotechnique
Published by Publike par
THE NATIONAL RESEARCH COUNCIL OF CANADA LE CONSEIL NATIONAL DE RECHERCHES DU CANADA Volume 13 Number 4 November 1976 Volume 13 numCro 4 novembre 1976
Settlement analysis of the Gloucester test fill
K. Y. Lo
Faculty ofEngineering Science, The University of Western Ontario, London, O n t . , Canada N6A 3K7 A N D
M . B o z o z u ~ A N D K. T. LAW
Geotechnical Section, Division of Building Research, National Research Council of Canada, Ottawa, O n t . , Canada K I A OR6
Received April 18, 1975 Accepted May 26, 1976
This paper reports the observation and analysis of the rate and magnitude of settlement under the test embankment at Canadian Forces Station Gloucester. The embankment has been in existence for 7 years and, because of extensive instrumentation, a sufficiently complete record has emerged. An advanced finite element method has been used for the computation of the induced stresses in the foundation soil.
Both block samples and 5 in. (12.7 cm) diameter Osterberg samples were recovered at various depths from the site. An experimental program, including the use of the 6 in. (15.2 cm) Rowe cell, has been carried out and an analysis of the test results based on the Gibson and Lo theory. The test results have also been used in the estimation of the field performance.
From the present study it is found that: the coefficient of consolidation and the primary and secondary ,compressibility can be adequately determined from samples of size 4.5 in. (11.3 cm) diameter by 2 in. (5.1 cm) high or larger; the secondary compression contributes significantly to the total settlement for the soil considered; and the Gibson and Lo theory predicts fairly accurately both the time rate and magnitude of settlement in the field.
-
Cet article rend compte de l'observation et de l'analyse du taux et de la quantite de tassement du remblai d'essai de Base des Forces Canadiennes Gloucester. Grlce a une instrumentation considerable, le remblai en place depuis 7 ans, a fourni un dossier de donnees suffisamment complet. Une methode avancee d'elements finis fut utilisee pour le calcul des contraintes transmises dans le sol de fondation.
On a preleve de differentes profondeurs des blocs d'echantillon et des echantillons au carottier Osterberg de 5 po. (12.7 cm) de diametre. On a realist un programme d'essais, comprenant I'utilisation de la cellule Rowe de 6po. (15.2cm), et effectue l'analyse des resultats selon la theorie de Gibson et Lo. Les resultats d'essais ont egalement ete utilises pour l'estimation du comportement en chantier.
La presente etude demontre que: le coefficient de consolidation et la compressibilite primaire et secondaire peuvent &tre determines convenablement a l'aide d'echantillons de 4 . 5 ~ 0 . (11.3 cm) de diametre et 2 po. (5.1 cm) de hauteur ou plus gros; la compression secondaire contribue d'une maniere significative au tassement total du sol considere; la theorie de Gibson et Lo predit avec suffisamment de precision le taux et la quantite du tassement en place.
[Traduit par la revue] Can. Geotech. J., 13,339 (1976)
340 CAN. GEOTECH. J. VOL. 13, 1976
Introduction
In 1967, a test embankment was constructed and instrumented by the Division of Building Research, National Research Council of Canada at Canada Forces Station (C.F.S.) Gloucester, 13 mi (21 km) from Ottawa. The embank- ment, constructed in a 4 ft (1.2 m ) deep ex- cavation, is composed of a granular fill, 12 ft (3.7 m) high, 30 ft (9.2 m ) wide, and 120 ft (36.6 m ) long at the top, with 1.5 to 1 side slopes. The initial performance of the embank- ment has been described and analyzed by Bozozuk and Leonards ( 1972). Continuous monitoring of the test fill was maintained up to the end of 1974. From the results of these long-term observations, which covered a period of 7 years, it was found that most of the settle- ments, at the surface and at different depths of the subsoil, could be attributed to secondary compression. This case record is particularly significant in that pore water pressures, verti- cal settlements, and lateral movements were measured during this period so that both the nature of settlement and the geometric con- straints under which they occurred could be clearly defined. The purpose of this paper is therefore ( a ) to present the results of long- term laboratory tests on specimens from block and tube samples, whereby the parameters governing primary and secondary compression are evaluated, and ( b ) to analyze and predict the long-term settlements using a theory of one-dimensional consolidation accounting for secondary compression (Gibson and Lo 1961 )
.
Instrumentation
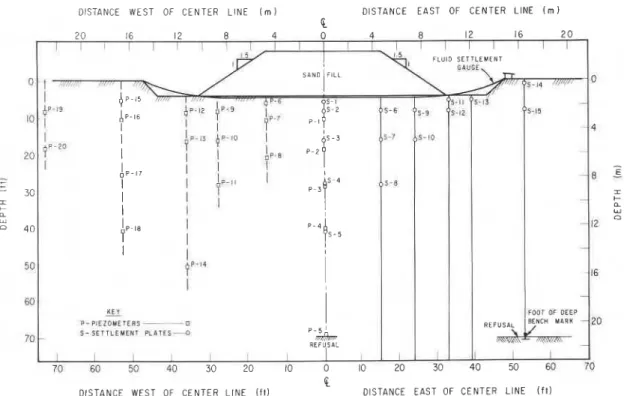
To measure the vertical, horizontal, and shear stresses transmitted to the subsoil, earth pressure gauges were installed at the base of the embankment. Vertical settlements at various locations were recorded with different settlement gauges, including one fluid settle- ment gauge used to obtain a continuous settle- ment profile along the base of the fill. Hori- zontal deformations were registered with gauge plates and inclinometers. Norwegian Geotech- nical Institute piezometers with open stand- pipes were used for monitoring pore pressure response. The geometry of the embankment and the location of the instrumentation are shown in Fig. 1.
Subsoil Conditions
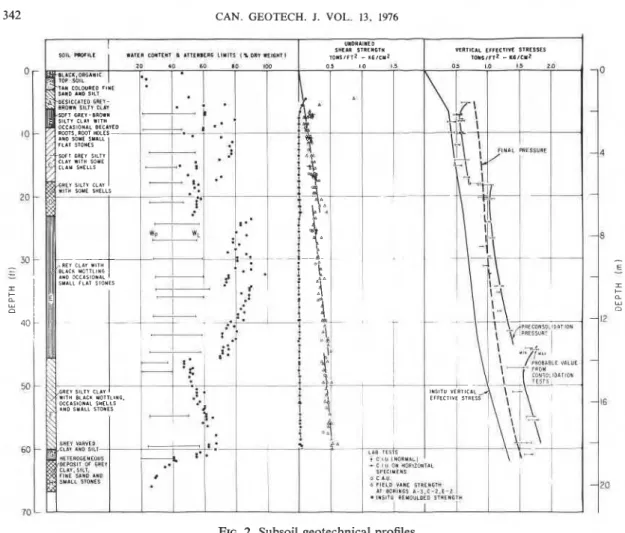
The soil profile and results of a detailed subsoil investigation are shown in Fig. 2. Based on in situ strength tests, the soil profile may be divided into three principal layers. The first, extending from the ground surface (eleva- tion 261.5 ft or 79.7 m ) to a depth of 23 ft (7.0 m ) , is further subdivided into strata A, B, C, and D, according to index properties. In this layer, the desiccated crust extends to a depth of 7.5 ft (2.3 m ) and the strength in- creases from 210 psf (0.103 kg/cm2) at this depth to 680 psf (0.332 kg/cm2) at 23 ft (7.0 m). In the middle layer, from 23 to 43 ft (7.0 to 13.1 m ) deep, the vane strengths in- crease from 460 to 980 psf (0.22 to 0.47 kg/cm2). Underlying this formation from 43 to 60 ft (13.1 to 18.3 m ) , the strengths in- crease from 800 to 1080 psf (0.384 to 0.527 kg/cm2). Finally, this formation is underlain with varved clay and glacial till. The in situ effective stress (from piezometric measure- ments) and the increase in vertical pressure under the centre of the test embankment are also shown. The average engineering prop- erties of the soil are summarized in Table 1.
For this study, additional undisturbed 5 in.
( 12.7 cm) diameter Osterberg ( 1952) samples were taken 100 ft (33 m) west of the embank- ment to a depth of 50 ft (15.2 m), and block samples were recovered from a test trench adjacent to the test fill from a depth of 8 ft (2.4 m ) . The stress conditions at these loca- tions were relatively unaffected by the embank- ment. Specimens were trimmed from both types of samples for laboratory tests.
Stress Increase Due to Embankment
In August 1967, the top part of the crust was excavated to a depth of 4 ft ( 1.2 m ) , over an area 94 ft (28.7 m) wide by 128 ft (39.0 m ) long. The test fill was constructed on the floor of the excavation. Construction began 11 September, and by 6 October the test fill was level with the original ground sur- face. Construction was completed 13 October 1967. The net height of the embankment which was constructed in 1 week is 8 ft (2.4 m )
-
In this analysis, the stress changes due to embankment loading were computed using a
LO ET AL.
DISTANCE WEST OF CENTER L I N E I m ) DISTANCE E A S T OF C E N T E R LINE (in)
'i
DISTANCE WEST OF C E N T E R L I N E ( f t ) DISTANCE EAST OF CENTER L I N E ( f t ) FIG. 1. Location of settlement gauges and piezometers.
finite element method incorporating the follow- ing conditions: ( a ) simulation of construction (excavation and backfilling) process in four steps, ( b ) taking into account embankment stiffness (and therefore induced shear stress along the embankment-soil interface) and stiff layer at 69 ft (21.1 m) depth, ( c ) using an average value of KO = 0.75 measured in the field by hydraulic fracturing method (Bozozuk 1974), and ( d ) the inhomogeneous distribu- tion of undrained moduli E (Bozozuk 1972) was taken into account, and the undrained Poisson's ratio was taken as 0.49.
The stress-strain relationship in monotoni- cally increasing loading of the sensitive clay was then assumed to be bilinear to represent a pseudo elasto-plastic behaviour, using the un- drained strength profile based on in situ vane strength tests shown on Fig. 2. Further details of the method have been described elsewhere (Law and Lo 1976).
For these conditions, computations show that the increase in vertical stress is insensitive to the stress-strain relationship assumed. The applied stresses are compared with the in situ
vertical effective stress and preconsolidation pressure on Fig. 2. The increase in vertical pressure Aa, exceeds PC to a depth of 17.5 ft (5.3 m ) with the ratio of hp/(PC -Po) = 2.4. Below 17.5 ft (5.3 m ) the applied stresses are within the over-consolidated range. The ratio Ap/(Pc - Po) is about 0.67 from 17.5 ft (5.3 m) to 43 f t (13.2 m). Further down to bed- rock ap/(P, - Po) is equal to 0.38. Along the base of the test embankment, the distribu- tion of the normal (vertical and horizontal) and shear stresses determined by the finite element analysis compared favourably with the field measurements reported by Bozozuk and Leonards ( 1 972).
Long-term Consolidation Tests
To study the consolidation behaviour of the clay strata, consolidation tests were carried out, ( a ) on specimens 2 in. (5.08 cm) in diameter and 0.5 in. (1.27 cm) thick, trimmed from 5 in. (12.7 cm) Osterberg samples taken at different depths (double drainage), ( b ) on specimens 2 in. (5.08 cm) in diameter and 0.5 in. (1.27 cm) thick, trimmed from block
342 CAN. GEOTECH. J. VOL. 13, 1976
FIG. 2. Subsoil geotechnical profiles.
Summary of index properties of soil at Gloucester test fill
PC
Depth W WL PI Y
-
Layer (ft) (%I (%) (%> LI st Activity ( ~ c f ) Po
1 &23 60 48 24 1 . 5 20-100 0.42-0.28 103 1 . 5
2 2 3 4 3 82 58 30 1 . 9 50-100 0.35 95 1 . 6
3 43-60 60 45 23 1 . 5 2C50 0 . 4 103 1.5
samples (double drainage), ( c ) on specimens 6 in. (15.24 cm) in diameter and 2 in. (5.08 cm) thick, trimmed from block samples (single drainage) using the Rowe cell and measuring the pore pressures at the base, and ( d ) on specimens 4.44 in. (11.28 cm) in di- ameter and 1.97 in. (5.0 cm) thick, trimmed from the Osterberg samples using a modified Rowe cell in which the axial load was applied by dead weights through a hanger system.
The samples were consolidated to the in situ vertical effective pressure for 3 days. Then
a load corresponding to the stress increase beneath the centre line of the embankment was applied to correspond with the load increment ratio a p / p in the field. The important influence of the load increment ratio on consolidation behaviour has been discussed by Leonards and Girault (1961). In all tests, the time range of observation varied from 15 to 150 days.
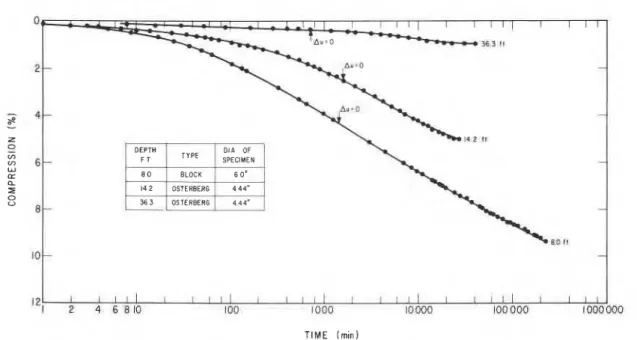
The test results for the 2 in. (5.08 cm) diameter specimens are shown on Fig. 3, and for the 4.44 in. (11.28 cm) diameter and larger specimen on Fig. 4. The strange be-
LO ET AL. TlME (days1 GLOUCESTER T E S T F I L L BLOCK S A M P L E -t- TUBE S A M P L E
-
0 1 2 5 1 2 5 1 0 100 1000 10 000 100 000 TlME ( r n l n )FIG. 3. Results of consolidation tests on 2 in. ( 5 cm) diameter specimens.
BLOCK 1 4 2 OSTERBERG 4 4 4 " 3 6 3 OSTERBERG 4 4 4 " -
-
ae 4-
--
Z 0-
6- - W (r a z 0 U 8 - 10 --
''1b
4
I I I I I I I I I I I 1 I I I I I I l l I I I I . 100 1000 10000 100 000 1000 000 TlME ( m ~ n )344 CAN. GEOTECH. J . VOL. 13, 1976
haviour of the specimen from 21.5 ft (6.56 eters cannot be precisely evaluated from ex- m ) was not due to experimental error as the perimental data. Since neither the mechanism results were reproducible even with a different of secondary compression nor the form of test apparatus. It appears that the specimen nonlinearity of the creep function is precisely resisted this stress level for a certain period of known, it is preferable to retain the simplicity time. Beyond this point, the structure of the of a linear theory from which the parameters clay particles broke down, resulting in the in- could be readily determined. The variation of creased rate of secondary compression with these parameters may then be investigated and logarithm of time. Similar discussion was also the nonlinearity studied. Nonlinear theories given by Lo (1961). From the tests, the £01- may then be adopted, if necessary. This ap- lowing general observations may be made: proach is adopted in the evaluation of experi- (a) The pore pressure measured in the 6 in. mental results and analysis of field observa- x 2 in. (15.24 cm
x
5.08 cm) specimen with tions in this paper.single drainage (Fig. 4 ) shows that the av-
erage degree of 90% consolidation was The Application of Gibson and Lo Theory
reached in 350 min. This suggests that the cor- To describe the entire consolidation process, responding time to reach the same degree of four soil parameters were used in this theory. consolidation in the 2 in. x 0.5 in. (5.08 cm X The primary compressibility, a, governs that 1.27 cm) sample with double drainage should part of the soil compressibility due to dissipa- be about 5.5 min. Based on conventional in- tion of pore pressure. The secondary compres- terpretation of test data (Fig. 3 ) , however, sibility, b, governs the creep deformation under a much longer period was obtained. sustained effective stress. In addition to the (b) A significant proportion of the total time lag of pore pressure dissipation, compres- compression in most specimens (Figs. 3 and sion of the clay is also retarded by the viscous 4 ) was due to secondary compression. deformation governed by the structural vis- (c) Few of the compression time curves show cosity l/h. The coefficient of consolidation c . a linear relationship in the semi-log plot is defined in terms of the primary compressi- throughout the complete stage of secondary bility a and is equal to k/(ayw), where k is the
compression. coefficient of permeability and y, the density
of water.
Methods of Predicting Settlement With the same initial and boundary condi-
Due to Secondary Compression tions as in the classical Terzaghi case, the Both empirical and theoretical methods have expressions for pore presure and average been developed for predicting settlements due degree of consolidation are given in the to secondary compression^ A common feature following dimensionless form (Gibson and Lo of the theories of consolidation taking secon- 1961):
dary compression into account is that the time 1 4 4 " 1 X
lag in secondary compression is attributed to
C11
- = - M[z1
(%
-
*)
the creep of the clay structure under constant A~ 7T n = o d d
effective stress. To incorporate this effect into
x e
the mathematical model the creep rate or vis- cous resistance has to be specified. In the em-
pirical approach, a simple creep rate with re- nnz
I
sin spect to the logarithm of time is measured e - ~ 1 ~ 1 / 4generally from oedometer tests (Buisman n(Z,
-
X2)1936; Leonards 1968; Walker and Raymond
8
"
1968). In the Gibson and Lo (1961) theory ~2-j
B
= 1+
-1
[(G
-
%,) e-'2Tl" the structural viscosity is assumed to be linear. 7T2 n=oddIn the theories of Barden (1965) and Gar- n 2 r 2
-
(T-
X 2 ) e - z 1 ~ l ~ 4 ] 1 langer (1972), the viscosity is assumed to ben 2 ( z ,
-
%,)nonlinear, with the result that the equations
LO ET AL. 345
I
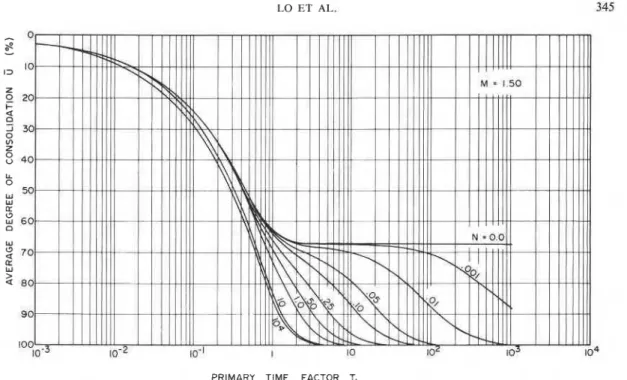
PRIMARY TIME FACTOR T,FIG. 5. Theoretical curves of average degree of consolidation (M = 1 . 5 ) .
and
1
N = - h h2 - , h = length of drainage pathb cv
The settlement-time relationship can be computed from the equation:
141 p(t) = o ( ~ ~ ) ( a
+
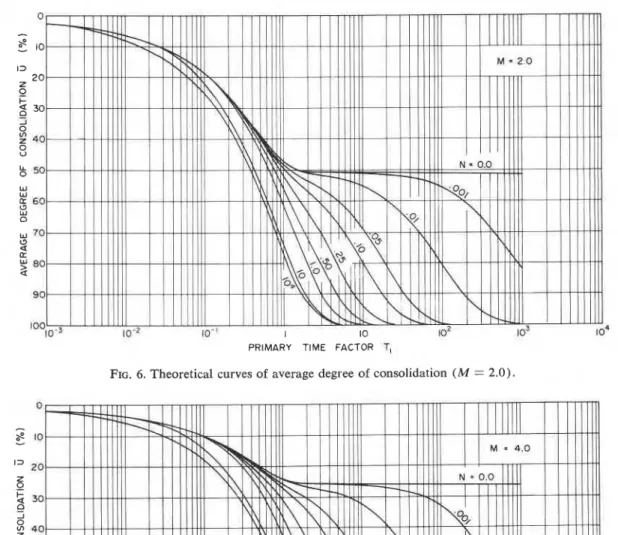
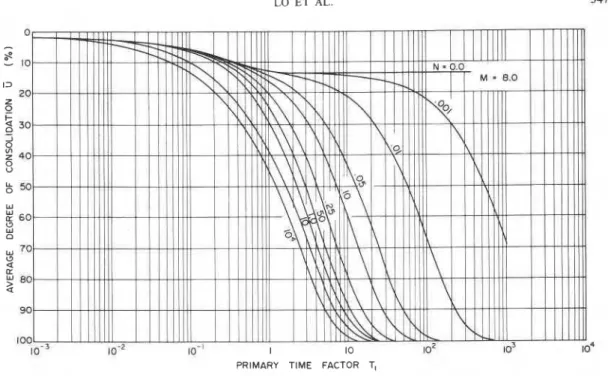
b)~u,'h where p(t) is the settlement at time t and AU.' the increase in effective vertical pressure. I Nomographs for pore pressure dissipationand average degree of consolidation vs. the time factor T1 for different values of M and N are shown on Figs. 5 to 8. Many of these curves could be classified as Type I1 and I11 (Leonards and Ramiah 1959, Marsal et al.
ondary compression. Note also that the 'waves' in the theoretical curves gradually smooth out as conditions proceed from the laboratory (N
ranges from 0.001 to 0.01) to the field (N ranges from 0.1 to 1 ). The behaviour in the laboratory and in the field, however, is not simply related by the h or h2 law. The func- tional relationship is complicated but is readily determined by choosing the appropriate the- oretical curves for the corresponding N value in the field.
These parameters can be determined from long-term oedometer tests by the methods pro- posed by Gibson and Lo (1961). Another method that is particularly useful in the anal- ysis of field records of settlement is described below.
A long time after the excess pore pressure has virtually dissipated, the approximate settle- ment S(t ) at any time t, is given by:
The vertical strain ~ ( t ) is given by the equa- tion:
346 CAN. GEOTECH. J. VOL. 13, 1976
PRIMARY TIME FACTOR TI
FIG. 7. Theoretical curves of average degree of consolidation (M = 4.0).
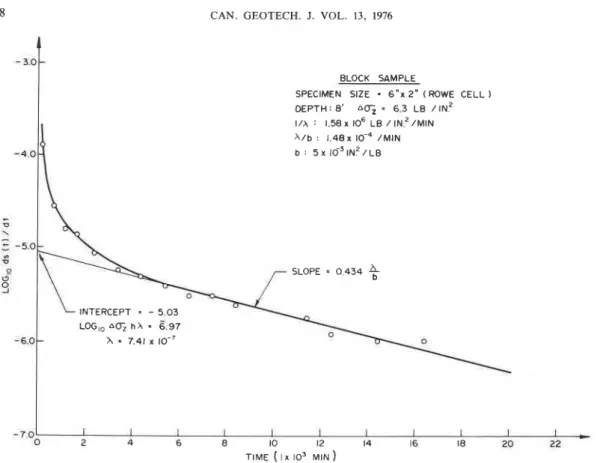
a'(t) Au,'A o(-"b)' Plotting the log of strain rate against time
C71
- -
-at from laboratory or field results of a particular Taking the logarithm of both sides of [7] layer under consideration produces a straight
line in the time range after excess pore pres-
a€
A sures have dissipated. The slope of this line is [8] log,, - = log,, Au,'A-
0.434-
tLO ET AL. 347
FIG. 8. Theoretical curves of average degree of consolidation (M = 8.0).
the value of l o g l o ~ ~ , ' h . Hence b and h may be
evaluated.
For a number of undisturbed and re- moulded clays, linearity was obtained for a
substantial time interval (Lo 1961 )
.
Thissuggests that the parameters are linear for the clays tested. Over a long period of time, how- ever, (months in the laboratory and years in the field), there is no theoretical reason to believe that the parameters are strictly linear. It is known that the behaviour of some clays is sensitive to time or strain rate, and there- fore, the parameter h (or h/b) may be highly dependent on time. Some evidence to this effect is discussed in the next section.
Analysis of Laboratory Test Results
The results from the test program described previously have been analyzed using [8]. Typ-
ical results for the 6 in. x 2 in. (15.24 cm
X 5.08 cm) specimens are shown on Fig. 9.
The curve can be approximated by a straight line in the time range from 3000 to 20 000
min, suggesting that the parameters b and A
are linear in this time range. The results of other tests, evaluated in the same way, are given in Table 2.
The most striking discrepancy between the
results of the 4.44 in. x 2 in. (11.28 cm x
5.08 cm) or larger and the 2 in. x 0.5 in.
(5.08 cm x 1.27 cm) samples lies in the vast
difference in the coefficient of consolidation. The smaller samples yield c, (Taylor 1948) one to two orders of magnitude less! The large decrease in c, may be due to several im- portant factors: ( a ) a larger proportion of sample disturbance resulting from trimming smaller samples (Van Zelst 1948; Bozozuk
1971 ) ; ( b ) larger hydraulic gradient due to
shorter drainage path (1/8 that of larger sample); and, (c) larger strain rate in the earlier phase of consolidation (say from 0 to 1000 min). Temperature effects and mechani- cal disturbance from tube sampling may also play an important role. It is probable that the combination of factors ( b ) and (c) leads to a progressive destruction of the cementation bonds in sensitive clays, resulting in the er-
roneous low values of c,. If such is the case,
the primary compressibility a and b will also be in error when determined from the smaller specimens. Consequently, the test results from the larger samples are considered as represen- tative. These are now being employed to study
the nonlinearity of the parameters b and A.
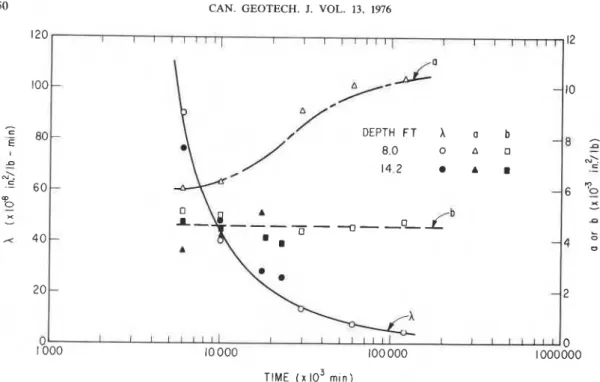
Taking the instantaneous slope and intercept
at a given time in Fig. 9, the parameters b
and A at any time may be calculated.
The results of calculations are plotted in Fig. 10. From this figure, it can be seen that b is
CAN. GEOTECH. J. VOL. 13, 1976
BLOCK SAMPLE
SPECIMEN SIZE
-
6 " x 2 " (ROWE CELL )DEPTH: 8 ' n q = 6 . 3 LB IN^ I/A : 1 . 5 8 ~ lo6 LB / I N ~ / M I N A / b : 1 . 4 8 ~ /MIN b : 5 x I O ~ I N . ~ / L B 348 -3.0- -4.0 1
-
INTERCEPT = - 5 . 0 3 LOG,, nuz h i = C.97 -6.0-
X = 7.41 x 10.' - 7 0 I 1 I I I I I I I I I_
0 2 4 6 8 10 12 14 16 I 8 20 22 TIME ( I x 103 MINFIG. 9. Plot of log strain rate with time from laboratory tests.
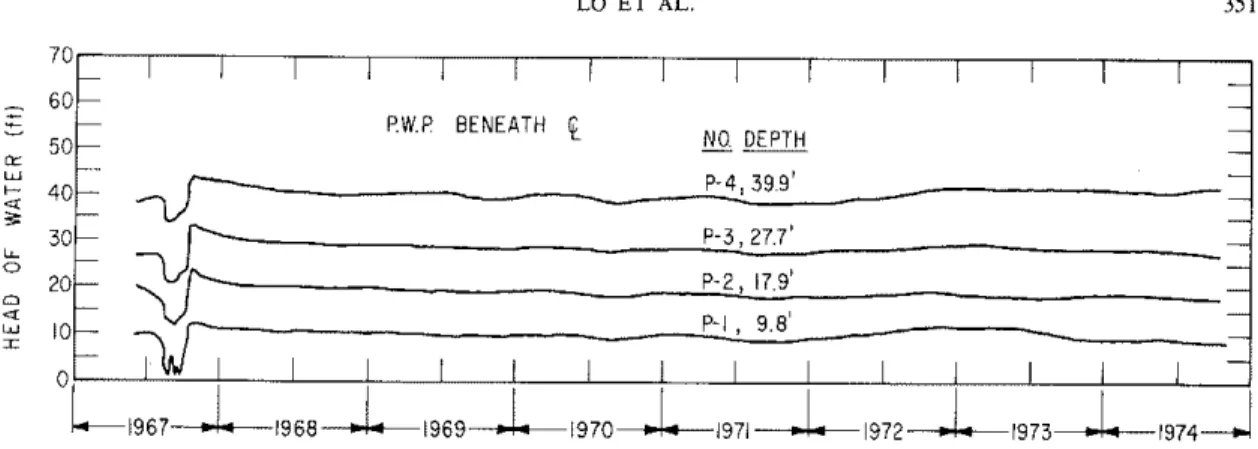
relatively linear, a mildly nonlinear, and h in Figs. 12 and 13 respectively. Because of the strongly nonlinear with time. For a satisfactory seasonal fluctuation of the ground water table, estimation of settlement in this particular direct interpretation of the pore pressure con- record, both a and b were taken from the linear ditions from Fig. 12 is difficult. By comparing portion of the curve as shown in Fig. 9 while these pore pressures with those measured with the value of h has to be extrapolated to the four reference piezometers installed 100 ft range of time in the field. To enable proper (30.5 m) north of the embankment, it was extrapolation, the apparent hyperbolic shape found that a small excess head persisted from of the curve (Fig. 10) is noted. In Fig. 11, 1% years after construction to November 1974. log h is therefore plotted against l/log t. A The values of these residual pore pressures for linear trend is seen from test results on soil PI, P2, PS, and P4 are 0.3, 0.7, 0.8, and 0.5 psi specimens recovered from the top compressible (0.02, 0.05, 0.06, and 0.035 kg/cm2) respec- layer. For the other soil specimen from 36 ft tively.
( 1 1 m) depth, a similar linear trend is ob- These measurements show that primary con- served after reaching a certain critical strain. solidation was largely completed 14 years after Extrapolation to field time is then based upon the full load was applied, and that subsequent this plot and the results, together with other settlement could be attributed mainly to secon- parameters for estimating the long-term settle- dary compression. Figure 13 also shows that ment, are shown in Table 3. a large proportion of settlements at different depths is due to secondary compression. The
Analysis of Long-term Settlement end of primary consolidation cannot be defined
The field measurements of pore pressures and easily by conventional empirical procedure, settlements at different depths beneath the and difficulty may arise in the use of the centre line of the test embankment are shown secondary coefficient c, (Buisman 1936).
TABLE 2. Summary of results of long-term d o m e t e r tests Sample Sample size type (in.) Pressure Depth W , PC increment CV a b h
(ft) (%) (TSF) VsF) A (ftz/yr) (in.'/lb x (in.'/lb x (in.2/lb-min x lo-') Block 6 x 2 8 66.1 0.58 0.40-0.84 1.1 29.6 6.3 5.0 6.25 (0.44) 51 .O* Block 2 x 0.5 8 67.0 0.58 0.40-0.84 1 . 1 0.29 14.0 4.0 2.22 (0.44) Tube 2 x 0.5 8.3 56.3 0.58 0.40-0.84 1.1 3.04 16.0 2.0 0.68 (0.44) Tube 2 x 0.5 11 .O 87.0 0.60 0.43-0.84 0.95 0.48 15.3 7.7 1 .O (0.41) Tube 2 x 0.5 21.5 75.7 1.0 0.58-0:86 0.47 x t 5.0 19.0 2.5 (0.28) Tube 2 x 0.5 30.0 86.0 1.1 0.684.96 0.41 X 9.0 12.0 1 .O (0.28) F 0 Osterberg 4.5 x 2 14.2 70.6 0.65 0.45-0:86 0.91 28.7 5.18 4.17 2.89 m (0.41) 4 Osterberg 4.5 x 2 36.3 87.0 1.20 0.76-1.04 0.37 27.9 1.01 1.39 1.65
*
(0.28)r
'From dissipation of pore water pressure.
t~ = curves that are inappropriate to determine c..
TABLE 3. Summary of soil parameters for estimating long-term settlement Layer
Layer thickness Ao. a b h k* cv t
No. (ft) (psi) (in.2/lbx10-3) (in.2/lbx10-3) (in.2/lb-minx10-9) ( f t / m i n ~ 1 0 - ~ ) (ftZ/yr) Remarks 1.64 31.5 Single drainage 1.64 38.4 Single drainage 1.31 157.3 Double drainage
*From field tests (Bozozuk 1972). ?From c, = klay,.
CAN GEOTECH. J. VOL. 13. 1976 120 I I I I I l I I I I I I 1 1 1 1 1 1 I I I f I I l l 12 100
-
,?-
-
10 3-
80 E I 0 A 0 - 8g
5 N' 14.2 A 8-
N ' .= 60 -6%
5
X X-
-
9 0 -0--- x 40 L -4:
20-
- 2 0 I t I 1 l l l l l I I 1 1 1 1 1 1 000 10 000 100 000 1 000000 0 TIME ( x lo3 m ~ n )FIG. 10. Variations of parameters X, a, and b with time from 4.5 and 6 in. ( 1 1.4 and 15 cm) diameter samples. 10"
,
I I I I 1 I I II
=
-
?
'
-
id"-
-
200 53 10 3-
-
-05 --
YEARS-
r
o - ~
=-
--
--
E-
-
.--
-
-
N-
;" 10-s--
n-
-
-
-
d --
d-
-
-
1 6 ' ~-
-
--
--
& - 1 0 ' O=
-
- --
-
-
-
-
1 0" I I I I I I I I I I I 0 10 0,14 0.18 0.22 0 26 0 30 0.34 IILOG t (min)LO ET AL. 35 1
FIG. 12. Pore pressure record along centre line. 7 0 TlME i y e o r s )
-
-
60--
-
50=
- I 1 I 1 1 I I I I I I I I I I - - - PWP B E N E A T H f - -- N O DEPTH - - T l M E ( d a y s )Fm. 13. Predicted and observed settlement along centre line
-
-
/ --
P - 3 , 2 7 1 ' --
P-2, 17.9' - - - P-1 , 9.8'.
- 1 2 5 10 20 50 100 OCT 3 , 1 9 6 7 1 1 1 1 I 1 - 1 0 ' F I L L ABOVE 0 - - - I - - 2 - -6-
-
-
-
3- C 0 Z 0 W I w 4 - LEGEND 0 i 0 THEORETICAL PREDICTION C i- MEASURED VALUES 0 w L" 5- 0 On 6 - -TOTAL THEORETICAL PREDICTION -
7- S I S 2 0 9 7 1 1 I I 8 11 5 3 0 5 3 1 1 0 0 R
-
-
U - I I 0 1 I 2 5 10 100 1000 10000 100000 0 2 4-"
-
-10,
Z W -125
1+
-14+
W V) 16 I8 20 -22 24 26:H. J. VOL. 13, 1976 CAN. GEOTEC T I M E (YEARS)
I t -
L A Y E R I G.T.F.1
-
FIELD MEASUREMENT-
THEORETICAL (GIBSON 8 LO 1961)1
- THEORETICAL ( T E R Z A G H I h r 9 '2 f iI
,,-..,
, , 0 = 6.3 x .'10 i n z / l b b = 5.0 x inz/lb h = 6 x l ~ - ~ i n ~ / l b-
min"
FIG. 14. Predicted and observed compression of the top layer of soil (layer 1)
To analyze the long-term settlements shown
in Fig. 13, the entire deposit was divided into
three layers in accordance with the location of measurements at different depths: layer 1 be-
tween plates S1 and S2; layer 2 between S2
and S3; and layer 3 between S3 and bottom of
the deposit. The reason for considering the soil
below S3 as one layer is that settlements re-
corded by S4 are too small for an accurate
analysis. Data for the analysis are given in Table 3.
Comparison of Theoretical and Measured Seftlem,ent-Time Curve of 1,ayer 1
The comparison of predicted consolidation
of layer 1 with the field measurements is shown
in Fig. 14. The agreement is reasonable both
in magnitude and time rate of settlement. In the same figure is also plotted the estimated
settlement based on Terzaghi's theory (1944).
Using data obtained from 24 h tests, the
classical Terzaghi's theory considerably nnder- estimates the measured settlement.
Long Term Settlements of the Foundation Clay
Figure 13 shows the predicted and measured
settlement at the elevations of the different settlement gauges. The general agreement is satisfactory. The somewhat larger predicted settlement stems from a slightly higher com- puted compression in the third layer. This is probably caused by an over-estimated value of
a obtained from the laboratory test on the
Osterberg sample. This over-estimation is par- ticularly true since the loading intensity in layer 3 is below the preconsolidation pressure
(Lo 1972).
The distributions of predicted and measured settlements along thc ccntrc linc in thc founda- tion clay at various times of interest is depicted
in Fig. 15. Good agreement can be seen in the
general shape of settlement profiles at different times.
Discussion
The present approach involved the use of a
LO ET AL.
SETTLEMENT If!)
0 M E A S U R E D
PREDICTED
Fro. 15. Predicted and measured settlements at various times mate solution of a two-dimensional (2-D)
problem. The apparent success of the method is based upon the following.
1. Test data from high quality (block and Osterberg) samples tested in a large Rowe cell were employed in the analysis.
2. By dividing the subsoil into three layers,
the average induced vertical pressures in each layer have been used in conducting the labora- tory tests and in estimating the settlement. Such a separation allows the treatment of that aspect
of the 2-D effect, which induces a steadily de-
creasing change in vertical pressure with depth.
3. The effect of lateral drainage and hori-
zontal displacement may not be significant in the first two layers where the ratio of width of loaded area to thickness of soil layer exceeds 2. There may, however, be a larger discrepancy in the third layer. This effect is not serious as this layer is far less compressible than the upper ones.
The use of the present approach should therefore be confined to cases similar to the one presented. In view of the good agreement, however, further verification of this approach is warranted.
Conclusions
Predicted and observed long-term settlement
of the Gloucester test fill are presented. Con- solidation tests to define the parameters gov- erning both primary and secondary compression have been performed on specimens trimmed from block and tube samples taken from this site. The results were analyzed by a theory of consolidation accounting for secondary com- pression and the predicted long-term settle- ments were compared with field measurements. The conclusions resulting from this study may be summarized as follows:
1. Reasonable estimates of the coefficient of consolidation, c,., the primary compressi-
bility,
a,
and the secondary compressibility, b,may be obtained from long-term consolidation tests on specimens 4.5 in. (11.3 cm) diameter by 2 in. (5.0 cm) high or larger with pore pressure measurements.
2. The structural viscosity l / x or its re-
ciprocal, A, is strongly nonlinear with time. T o
apply the laboratory results to the field, A must
be extrapolated to the field time.
3. The field measurements indicate that a large proportion of the settlements at different depths are attributable to secondary compres- sion occurring at essentially constant effective stress.
4. The application of Gibson and Lo's
354 CAN. OEOTECH.
rate and magnitude of settlement along the centre line of the embankment.
Acknowledgement
The authors gratefully acknowledge the co- operation of the Ontario Ministry of Transpor- tation and Communications (OMTC) and thank them for their permission to publish these research results. The work performed is part of a project supported by the OMTC under the Ontario Joint Transportation and Communications Research Program. It is also part of a co-operative study of the Division of Building Research, National Research Coun- cil of Canada, and the Faculty of Engineering Science, University of Western Ontario.
This paper is a contribution from the Divi- sion of Building Research, National Research Council of Canada, and is published with the approval of the Director of the Division.
BARDEN, L . 1965, Consolidation of clay with nan-linear viscosity. Geotechnique, 15(4), pp. 345-362.
B o r o z u ~ , M. 1971. Effect of sampling, size, and storage on test results for maline clay. Am. Soc. Test. Mater. Spec. Tech. Publ. No. 483,pp. 121-131.
- 1972. The Gloricester test fill. Unpubl. PhD thesis, Purdue Univ., Lafayette, Ind.
-
1974. Minor principal stressmeasurement in marine clay with hydraulic fracture tests. Subsuiface explora- tion for underground exploration and heavy construc- tion. Proc. Spec. Conf., New England College, Hen- niker, N.H.,August 11-16, 1974. pp. 333-349.B o z o z u ~ , M. and LEONARDS, G. A. 1972. TheGloucester test fill. Spec. Conf, on Pe~formance of Earth and Earth-Supported Structures, ASCE, Purdue Univ. Lafayette, Ind., vol. I, part l , p p . 299-317.
BUISMAN, A. S. K. 1936. Results of long duration settle- ment tests. Proc. 1st Int. Conf. on Soil Mechanics and Foundation Engineering, Cambridge, Mass., vol. I , pp. 103-105.
GAKLANGEK, J . 6 . 1972. Theconsalidationufsoilsexhibit- ing creep under constant effective stress. Geotechnique, 22(1), pp. 71-78.
Grssos, R. E. and 1.0, K. Y. 1961. A theory of consolida- tion of soils exhibiting secondary compression. Acta Polytechnical Scandinavia, Ci 10 296 (Scandinavian Academy of Science).
LAW, K. T , and1.0, K . Y. 1976. Analysisofsheafindliced anisotropy inLedaClay.Proc., 2ndInt. Conf. onNumeri- cal Methods in Geomechanics. Blacksburg, Va., vol. 1, pp. 329-344.
LEONARDS, G. A. 1968. Predicting settlements ofbuildings on clay soils. Proc. Lecture series January -May, 1968, Ill. section ASCE, Northwestern Univ., Evanstun, Ill. LEONAKDS, G. A. and G ~ R A U L T , P. 1961. A study of the
one-dimensional consolidation test. Proc. 5th Int. Canf. on Soil Mechanics and Foundation Engineering, Paris, Fiance, vol. 1, pp. 213-218.
LEONARDS, G. A. ~ ~ ~ R A M I A H , B. K. 1959. Timeeffectsin the consolidation of clays. Symp. on Time Rateof Load- ins in Testine Soils. Am. Soc. Test. Mater. Soec. Tech. ~;bl. No. 254,pp. 116-130.
Lo, K. Y. 1961. Secondaiy compression ofclays. ASCE, J. SoilMech. Ebund. Div. 87(SM4), pp. 61-87.
-
1972. The influence of mechanical disturbance on the consolidation of clays. 3rd Proc. Southeast Asian Conf. on Soil Enginceiing. pp. 223-232.MAKSAL, R. I . , SANDOVAL, R., and HIKIAT, F. 1950. Cur- vas deformation-tiempo en las arcillas del Valle de Mex- ico ~(Time-deformation cumes in clavs from the vallev of ~~ ,
-Mexico). li~genieria civil, colegio de lngenieria Civiles deMexico, 2(5), pp. 7-17.
OSTERRERG, J . 0. 1952. New piston tube sampler. Eng. News-Rec. 148,pp. 77-78.
TAYLOR, D. W. 1948. Fundamentals of Soil Mechanics. John Wiley and Sons, Inc., New York, N .Y.
TERZAGHI, K . 1944. Theoretical soil mechanics. John Wilevand Sans. Inc.. New York. N.Y.
VAN Z&.ST, T. W. 1948. An investigation of the factors affecting laboratory consolidation of clay. Proc., 2nd Int. Conf. on Soil Mechanics and Foundation Engineer- ing, Rotterdam, Neth.,vol. 7 , p p . 52-61.
WALKER, L. K. and RAYMOND, G. P. 1968. The prediction of consolidation rates in a cemented clay. Can. Geot. J . 5,pp. 192-216.