Publisher’s version / Version de l'éditeur:
Vous avez des questions? Nous pouvons vous aider. Pour communiquer directement avec un auteur, consultez la
première page de la revue dans laquelle son article a été publié afin de trouver ses coordonnées. Si vous n’arrivez pas à les repérer, communiquez avec nous à PublicationsArchive-ArchivesPublications@nrc-cnrc.gc.ca.
Questions? Contact the NRC Publications Archive team at
PublicationsArchive-ArchivesPublications@nrc-cnrc.gc.ca. If you wish to email the authors directly, please see the first page of the publication for their contact information.
https://publications-cnrc.canada.ca/fra/droits
L’accès à ce site Web et l’utilisation de son contenu sont assujettis aux conditions présentées dans le site LISEZ CES CONDITIONS ATTENTIVEMENT AVANT D’UTILISER CE SITE WEB.
Proceedings, ACEEE Summer Study on Energy Efficiency in Buildngs 2004, American Council for an Energy Efficient Economy: 01 August 2004, Pacific Grove, CA., U.S.A., pp. 129-140, 2004-08-01
READ THESE TERMS AND CONDITIONS CAREFULLY BEFORE USING THIS WEBSITE.
https://nrc-publications.canada.ca/eng/copyright
NRC Publications Archive Record / Notice des Archives des publications du CNRC :
https://nrc-publications.canada.ca/eng/view/object/?id=a784069c-10a3-452b-9764-b2a843d42bf3 https://publications-cnrc.canada.ca/fra/voir/objet/?id=a784069c-10a3-452b-9764-b2a843d42bf3
NRC Publications Archive
Archives des publications du CNRC
This publication could be one of several versions: author’s original, accepted manuscript or the publisher’s version. / La version de cette publication peut être l’une des suivantes : la version prépublication de l’auteur, la version acceptée du manuscrit ou la version de l’éditeur.
Access and use of this website and the material on it are subject to the Terms and Conditions set forth at Saving electricity and reducing GHG emissions with ECM furnace motors: results from the CCHT and projections to various houses and locations
Gusdorf, J.; Swinton, M. C.; Simpson, C. J.; Entechev, E.; Hayden, A. C. S.; Furdas, D.; Castellan, W.
Canadian
Centre
Centre
canadien
des
for Housing Technology
technologies résidentielles
Saving electricity and reducing GHG emissions with ECM furnace motors: results from the CCHT and projections to various houses and locations
Gusdorf, J.; Swinton, M.; Simpson, C.; Entchev, E.; Hayden, S.; Furdas, D.; Castellan, B.
NRCC-45419
A version of this document is published in / Une version de ce document se trouve dans: Proceedings, ACEEE Summer Study on Energy Efficiency in Buildings 2004, American Council for
The Canadian Centre for Housing Technology (CCHT)
Built in 1998, the Canadian Centre for Housing Technology (CCHT) is jointly operated by the National Research Council, Natural Resources Canada, and Canada Mortgage and Housing Corporation. CCHT's mission is to accelerate the development of new technologies and their acceptance in the marketplace.
The Canadian Centre for Housing Technology features twin research houses to evaluate the whole-house performance of new technologies in side-by-side testing. The twin houses offer an intensively monitored real-world environment with simulated occupancy to assess the performance of the residential energy technologies in secure premises. This facility was designed to provide a stepping-stone for manufacturers and developers to test innovative technologies prior to full field trials in occupied houses.
As well, CCHT has an information centre, the InfoCentre, which features a showroom, high-tech meeting room, and the CMHC award winning FlexHouse™ design, shown at CCHT as a demo home. The InfoCentre also features functioning state-of-the art equipment, and demo solar photovoltaic panels. There are over 50 meetings and tours at CCHT annually, with presentations and visits occurring with national and international visitors on a regular basis.
Saving Electricity and Reducing GHG Emissions with ECM Furnace Motors: Results from the CCHT and Projections to various Houses and Locations
John Gusdorf, Natural Resources Canada Mike Swinton, National Research Council Craig Simpson, Craig J. Simpson, Technical Services Evgueniy Entchev and Skip Hayden, Natural Resources Canada
David Furdas and Bill Castellan, Enbridge Gas Distribution
ABSTRACT
The two identical houses at the Canadian Centre for Housing Technology (CCHT) were used to measure the effects of an energy efficient furnace motor on electricity and natural gas use. In one house, the furnace had its standard motor replaced by an electronically commutated motor (ECM). Electricity and natural gas use were measured in both houses under a wide range of space heating and air conditioning weather. The house with the ECM consistently used significantly less electricity during both space heating and air conditioning, and more natural gas during space heating.
The HOT2000 energy simulation model was used to project the results to entire years in a variety of houses and climates. For houses that use the furnace fan for continuous circulation, electrical savings range from 1,535 to 1,823 kWh/y without air conditioning, and 2,795 to 2,991 kWh/y with A/C. Increased use of natural gas varies from 152 to 222 m3/y. Net utility bill savings range from $14 to $180 per year. Greenhouse gas (GHG) reductions depend on assumptions about “swing fuels,” and vary by location. Generally, it appears that ECMs result in significant GHG reductions. For houses without continuous circulation, the effects of ECMs are positive, but less significant. Continuous circulation is important in airtight houses, and ECMs can generally provide this circulation with no increase in utility bills.
These results are compared with others, including an ACEEE study. A program promoting furnaces with ECMs by one of the study sponsors has resulted in a significant number of installations.
Introduction
Electronically Commutated Motors (ECMs)are brushless, permanent magnet DC motors with integrated controls. ECMs are significantly more efficient than the Permanent Split Capacitor (PSC) motors used in most residential furnaces today. The efficiency improvement is especially evident in applications that utilize reduced circulating air flow rates, as is often done in systems with continuous fan operation. Thus, using a natural gas furnace with an ECM instead of a PSC motor should reduce electrical consumption. In turn, the decreased electrical consumption should increase the amount of natural gas required to heat the house, since much of the electricity used by the motor ends up as space heat, and the more efficient motor produces less heat. The net effects should be to save the homeowner money – since natural gas is less expensive than electricity per unit of energy, and to reduce greenhouse gas emissions. During air
conditioning, an ECM should save electricity directly and by reducing the load on the air conditioner, with no corresponding increase in gas use.
Reasons for Using the CCHT Houses
The Canadian Centre for Housing Technology (CCHT) is a facility designed for doing controlled experiments on residential technologies. It includes two highly instrumented, identical, unoccupied R-2000 houses. Each is two storeys with 223 m2(2,400 ft2) of floor area, not counting the full basements. Occupancy is simulated by computer controlled operation of lights and appliances, use of hot water, and generation of heat to simulate the presence of occupants. Repeated testing under identical conditions (benchmarking) has shown that the two houses use almost exactly the same amounts of energy for space heating, air conditioning, hot water and utilities. The CCHT is open to projects from manufacturers, utilities, government agencies, and others. For more information see www.ccht-cctr.gc.
The CCHT houses were ideal locations for the ECM test because having two identical houses at the same site allows the effects of a relatively small change in one of them to be clearly shown in the collected data, rather than based on an analysis of space heat loads derived from outdoor temperatures, wind speeds and solar radiation.
Testing Conditions
During this project, the furnace fans ran continuously, operating at higher speed when the furnace or the air conditioner was on, and at a lower speed when they were not. This is the recommended practice in newer, more airtight houses in which the furnace fan circulates ventilation air. However, actual practice seems to vary across the country. A study by Unies Ltd. (Phillips 1997)showed that in Quebec about 50% of respondents operated their furnace fans continuously, while in the rest of Canada only about 20% did. This is confirmed by a more recent study in Manitoba (Proskiw 2002). Continuous fan operation does increase the impact of switching to an ECM, and hence the real value of an ECM will be determined by the dominant ventilation practice in any region of the country.
The furnaces in both houses were mid-efficiency, single-stage units with rated AFUEs of 81%, and outputs of 17.8 kW. The PSC motors were the original ½ horsepower (HP) motors supplied with the furnaces and run in the second-highest of their four speeds during heating, in the highest speed during air conditioning, and in the lowest speed during circulation, as is normal for PSC fan motors in newer Canadian installations. The ECM was a ½ HP motor made by General Electric. Static pressures are shown in Table 1. Those for heating are within the typical range of 75 to 175 Pa for Canadian houses (Phillips 1997).
Methodology
BenchmarkingBenchmarking consists of running both of the CCHT houses under identical conditions for several days to verify that they are using the same amounts of energy. Conditions that are kept identical in the two houses include indoor temperatures, ventilation rates, hot water use, and internal gains from lights, appliances and simulated occupancy. Once benchmarking has shown
Table 1. Air Flows & Static Pressures
Air Flow (L/s) Pressure Drop (Pa) Mode
PSC ECM PSC ECM Circulation 454 204 75 27 Heating 622 595 161 130 Air conditioning 681 710 186 193
that the consumptions of the two houses are essentially identical, then an experiment can be conducted by making a change in the Test House while leaving the Reference House unchanged.
Measuring Duct Air Flows and Programming an ECM
As mentioned in the introduction, ECMs can be programmed to lower speeds than PSC motors, and energy savings are significantly increased by the lower ECM speeds. Thus, in order to take full advantage of the ECM, its circulation speed was set as low as was considered compatible with good circulation and air quality. With the PSC motor at circulation speed, the air flows from thirteen supply ducts were measured. The ECM motor was programmed for several circulation airflow rates, and the lowest rate that still provided adequate ventilation to all rooms was used. The air flow rates used in this project are shown in Table 1
The intent was to have the heating and air conditioning flows of the two motors equal. The 4% difference between them is due to the fact that the ECM is adjusted in steps, and is probably within the level of accuracy of the airflow measurements.
Projecting Results
The HOT2000 house energy simulation software1 was used to project the results from the specific days of testing at the CCHT houses to complete years at the CCHT, and to other houses, locations and furnaces. Projections were done with and without continuous circulation, and with and without air conditioning, and results are compared. As discussed below, net greenhouse gas (GHG) reductions were calculated in two ways: On the assumption that saved electricity displaces coal-fired electricity, and based on the actual mix of generation fuels in each province.
Results
Benchmarking for Heating
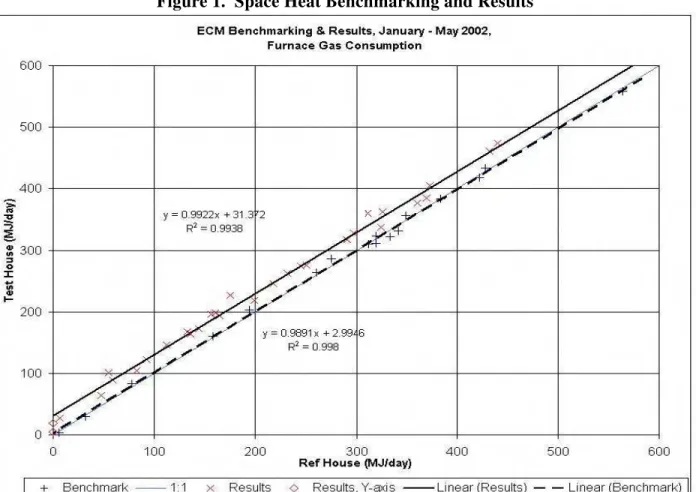
In Figure 1, the lower line (+ marks) shows the results of the benchmarking for the space heating period of this project. The coordinates of each point are the furnace gas consumption in each of the two houses for one day. If the consumption in both houses were exactly the same each day, then all points would fall exactly on the 1:1 line, the slope and intercept of their linear regression would be exactly one and zero, and the r2would be one. Any significant deviations from these values would indicate that the houses are not operating identically. The benchmarking results are considered excellent, and show that the operation of the two houses was almost identical, so that any significant differences during ECM testing are due to the ECM. The plotted results have a slope of 0.9891, an intercept of 2.99 MJ/day, and an r2 of 0.998.
1
Figure 1. Space Heat Benchmarking and Results
Benchmarking for Air Conditioning
In Figure 2, the upper line (+ marks) shows the benchmarking for the air conditioning period of this project. The points are based on the sum of daily electrical consumption of the air conditioner compressor and the furnace fan. The coordinates of each point are this sum for each of the two houses. As with the space heat benchmark, ideally all points should lie on the 1:1 line. The air conditioning benchmark is not as close to perfect as the one for space heat, because the Test House consistently uses slightly more energy than the Reference House, and the difference between them increases with daily energy use. Nevertheless, the r2 (0.9979) is still close to perfect, and as long as there is a clear and consistent difference between the benchmark and the results with an ECM, then the results are still useful.
Effects of the ECM during Heating
Motor & furnace electricity consumption. The power use of the ECM and the PSC motor were measured in one-time tests, and the results are shown in Table 2. The second row shows the results with the reduced ECM circulation flow rate, and the last row shows the results with the ECM circulation flow as close as possible to the PSC’s. In heating speed, the PSC motor used 423 Watts while the ECM used 246 W, or 58% as much as the PSC motor for a nearly equal flow rate. With the reduced ECM circulation rate (on which the results of this report are
Figure 2. Electricity Use by the Air Conditioners during the A/C Period: Benchmarking & ECM Testing
Table 2. Comparison of ECM & PSC Power and Flow Rates
Motor Power (W) Air Flow (L/s) Flow/Power (L/s.W)
Mode
ECM PSC ECM/PSC ECM PSC ECM/PSC ECM PSC ECM/PSC Heating 246 423 58% 591 658 90% 2.40 1.55 155% Circulation 22 316 7% 218 486 45% 9.91 1.54 644% Equal Circ. 146 316 46% 463 486 95% 3.17 1.54 206%
based), the PSC motor used 316 W while the ECM used 22 W, or only 7% as much. With the circulation rates nearly equal, the ECM used 146 W, or 46% as much as the PSC motor. As shown in Table 2, the ECM delivers over 1.5 times as much air flow per watt, and more than six times as much in reduced circulation mode. With equal circulation rates, the ECM still delivers twice as much, showing that electricity savings and therefore increased gas use are not dependent on the reduced circulation rate. A kWh meter in each house measures the consumption of the furnace, which includes the controls and draft-inducing fans as well as the motor. Daily results from these meters show that on average the furnace with the PSC motor uses 9.29 kWh/day, and the furnace with the ECM uses 2.38 kWh/day, a reduction of 6.91 kWh or 74%.
House electricity consumption. During benchmarking, electrical consumption for all purposes in the two houses was nearly identical and averaged 26.8 kWh in the Reference House and 27.1
kWh in the Test House. These values are fairly typical of Canadian houses. During ECM testing, the Reference House averaged 25.9 kWh/day, while in the Test House averaged 19.1 kWh/day. Thus, the house with the ECM saved an average of 6.8 kWh/day, and used 74% as much as the house with the PSC motor.
Gas consumption. During ECM testing, the average furnace gas consumption in the Reference House was 213.7 MJ/day, while in the Test House it was 243.4 MJ/day. Thus, the lower
electrical consumption of the ECM resulted in an average increased gas consumption of 29.71 MJ/day or 13.9%.
Figure 1 compares daily values of furnace gas consumption of both houses during benchmarking and ECM tests. The results of the ECM testing under normal conditions are shown as Xs. Theoretically, they should lie on a straight line above the 1:1 line, and with a slope of less than one. The line should be above the 1:1 line because the lower electricity use of the ECM causes gas consumption in the Test House to be higher. The slope should be less than one because the difference between the PSC and ECM electrical use is higher when the furnace spends less time in heating mode. Figure 1 also includes three points with no furnace gas consumption in the Reference House (two are indistinguishable), shown as diamonds (◊) on the Y-axis.
The linear correlation for the normal condition points has a slope of 0.992 and an intercept of 31.37 MJ/day. Its correlation coefficient (r2) is 0.994. The intercept is slightly larger than the average difference in gas consumption (29.71 MJ/day), as would be expected since the slope is less than one. The benchmark and results lines are clearly distinct. Both have r2s of over 0.99, and no individual point of one line crosses the correlation line of the other. Thus, the increased furnace gas use due to the ECM is clearly shown in the results.
Effects of the ECM during Air Conditioning
Figure 2 shows that, despite the imperfect benchmark for the air conditioning period, the energy savings due to the ECM are clear. Higher energy use for both PSC motors and compressors contribute to the higher A/C energy use in the Test House during benchmarking. The percentage savings due to the ECM at the CCHT are: 48% for the fan, 4% for the compressor, 21% for the A/C (fan plus compressor), and 13.9% for the house. Savings for the compressor are relatively small because they should be the fan savings (in kWh/day) divided by the COP of the compressor (~3.60).
Projections to Complete Years, and to other Furnaces, Houses and Climates
The results from the CCHT houses show the effects of the ECM for seventy particular days in a particular house with a particular furnace and air conditioner. To be generally useful, these results must be projected to entire years, and to other houses, locations and furnace types. An existing HOT2000 model of the CCHT Reference house was modified for the ECM and PSC motor, compared with the results, and used to project the results to an entire typical heating season. Then new models were created for the following furnaces, house types and cities:1. Furnaces: Mid-efficiency (82% steady-state efficiency), and high-efficiency (92%). 2. House types: R-2000, typical new, typical existing, and typical row housing.
Operating Conditions: Air conditioners and Furnace Fans
The furnace fans were operated at three different speeds: high speed for air conditioning, medium speed for heating, and low speed for continuous circulation. When the air conditioner or furnace is running, the fan always runs at the corresponding speed. However, when neither the furnace nor the air conditioner is active, the fan may operate in its continuous circulation speed, or it may be off. Since houses may or may not have air conditioners, and may or may not have continuous circulation, projections of ECM savings were done under four conditions: 1. Air conditioning and continuous circulation,
2. No air conditioning and continuous circulation, 3. Air conditioning and no continuous circulation, and 4. No air conditioning and no continuous circulation.
Together, these conditions cover the range of potential ECM effects. The first should show the greatest difference between a PSC motor and an ECM since the fan motor will be in use continually for the entire year, and will spend a large amount of time in circulation speed where the difference between the PSC motor and ECM is greatest. The last should show the smallest difference since the motor will only be on when the furnace is operating, and will never be in circulation speed.
Calculations of GHG Savings
ECMs save electricity and cause more natural gas to be consumed for space heating, so their effects on emissions of greenhouse gases (GHG) depends on the actual effects on the two fuels, and the GHG intensity of the fuels. The GHG intensity of natural gas is straight forward, but the intensity of electricity depends on the mix of fuels used to generate the electricity, and the GHG reductions from savings of electricity depends on which of these fuels will be displaced by the savings. This paper calculates GHG reductions from electricity savings in two ways. The first assumes that all electricity savings displace coal-fired electricity generation. Although each location has it own mix of fuels, reductions in demand result in reductions in coal-fired generation. Even in Manitoba where most generation is by hydro power (zero GHGs), excess electricity is sold to the U.S. where it can displace coal. The second way is based on the actual mix of generation fuels in each of the provinces in which projections are done. Table 3 shows the GHG intensities used in this report (Parekh 2000).
The values of kg CO2/GJ in Table 3 clearly show that if saved electricity is generated
from coal, then an ECM will definitely reduce GHG emissions. Electricity from coal is almost six times as GHG intensive as natural gas, so saving electricity and using more natural gas will significantly reduce GHG intensity, regardless of differences in their efficiencies of use. However, if electrical GHG intensity is based on provincial fuel mixes, the situation is very different. In Ontario, and especially in Manitoba, electricity is less GHG intensive than gas, so substituting gas for electricity could result in significant increases in emissions. In New Brunswick, electricity is 15% more GHG intensive than gas, so the net effect on emissions could depend on their efficiencies of use.
How to best calculate the GHG reductions from electrical savings is controversial. Some people are convinced that coal is always the swing fuel, while others believe that this assumption exaggerates GHG reductions because natural gas, oil or hydro power may be the swing fuel.
Table 3. Greenhouse Gas Intensities
Greenhouse Gas (GHG) Intensity Fuel
kg CO2/m3 kg CO2/kWh kg CO2/GJ
Natural Gas 1.9124 -- 51.367 Electricity from Coal -- 1.1 305.56 Electricity, Manitoba -- 0.010694 2.9706 Electricity, Ontario -- 0.073914 20.532 Electricity, New Brunswick -- 0.212889 59.136
Using provincial averages probably underestimates the effects of reductions because capital intensive nuclear and hydro plants (counted as zero GHG emitters) are less likely to be reduced than fossil fuel plants. This report presents GHG reductions calculated by both methods, and allows readers to make their own judgements.
Projection Results
Continuous Circulation Fan
To summarize the results for all cities, houses and furnaces:
• Savings of electricity are more than 1,500 kWh/year in all cases. Without A/C, savings are 1,535 to 1,832 kWh/y. With A/C they are 2,795 to 2,991 kWh/y. As a percentage of electrical use by the entire house, the savings are 12% to 18% without A/C, and 17% to 25% with A/C.
• Based on coal-fired electricity, net GHG reductions in houses without A/C range from 1,314 to 1,674 kg CO2/y, and with A/C from 2,703 to 2,962 kg CO2/y.
• Based on provincial mixes of generating fuels, the effects of ECMs on GHG emissions range from an increase of 383 kg CO2/y to a decrease of 312 CO2/y. Only Moncton showed any decreases; in the other cities the smallest increase was 60 kg CO2/y.
• Natural gas prices in the four cities vary by 37% from 0.3696 to 0.5073 $/m3, and electricity prices vary by 60% from 0.0559 to 0.0896 $/kWh. Net annual savings from an ECM can vary from $14 to $180 depending on the price of electricity and other factors. • Increased use of natural gas due to an ECM ranges from 152 m3/y to 222 m3/y. The
percentage increase in gas use for the entire house ranges from 4.7% to 9.7%.
Thus, in houses with continuous circulation, the use of ECMs for fan motors would have significant benefits as:
• a demand side management (DSM) tool for reducing demand for electricity,
• a means of reducing emissions of greenhouse gases, assuming that saved electricity is coal-fired, or has a GHG intensity between that of coal-fired electricity and electricity from the provincial mixes of generating fuels,
• a means of reducing homeowners’ utility bills, and • a means of increasing gas sales.
No Circulation Fan
All conditions are the same as in the previous section, except that the furnace fan operates only when there is a demand for space heat or air conditioning. As would be expected, the effects of an ECM without continuous circulation are much smaller than with. For Toronto, savings of electricity due to an ECM range from 90 to 372 kWh/y (1% to 3% of total house use), increases in natural gas are 8 to 29 m3/y (less than one percent of total house use), and net savings are $4 to $20 per year. Based on coal-fired electricity, net reductions of GHG emissions are 81 to 360 kg CO2/y, and based on the provincial fuel mix, increases in GHG emissions are 6
to 32 kg CO2/y. Results for the other cities are similar. Thus, whether ECM furnace fan motors will have significant benefits depends critically on whether the furnace fan is run in continuous mode for at least a significant part of the year.
“Free” Continuous Circulation with an ECM
A house with a PSC motor and no circulation mode that changed to an ECM with continuous circulation would see only a very small increase, or a small saving, in its utility bills. This can be seen by comparing the projections for ECMs with continuous circulation with those for PSC motors with no circulation mode. A comparison of the costs for all four cities shows that the maximum extra utility bill for continuous circulation with an ECM would be $5.14/y. The greatest reduction would be $19.09/y. For all cities and houses, the average result is a saving of $3.51/y. Thus, having made the initial purchase of an ECM, occupants could enjoy the health and comfort benefits of continuous circulation for virtually no cost, or even a small saving in their utility bills.
Comparison with other ECM Studies
A recent study for the ACEEE (Sachs & Smith 2003) predicts much larger effects than this report does from ECMs and similar energy efficient motors. The ACEEE study uses Gas Appliance Manufactures Association (GAMA) data on annual electrical use by high-efficiency gas furnaces to separate them into those with and without energy-efficient motors, and then to calculate the annual electrical savings and gas increases due to efficient motors. The GAMA ratings are based on operation of the furnace fan only when the furnace is producing heat. Thus, all of their findings are for no continuous circulation.
Table 4 compares electrical savings. The ACEEE savings for Wisconsin are compared with ours for a typical existing house in Toronto, which according to the GAMA map of heating load hours is in the same zone as Wisconsin. ACEEE gas increases are 65 m3 while ours are 26 m3. Thus, the ACEEE’s projections are 1.9 to 2.5 times larger than those in this report. Their results may be a product of aggregating all furnaces that appear to have efficient motors and all those that don't. This involves other factors besides motor efficiency, e.g., motor size and pressure drop through the furnace. Peter Edwards (Edwards 2003) used a very similar method to separate furnaces with and without ECMs, and found that it worked well, but was not 100% effective, i.e., some of the models that he could identify by model numbers were not in the correct category.
A Wisconsin study (Pigg 2003) of 31 new furnaces, including 14 with ECMs, produced results that are closer to ours. Table 4 shows that their results for electricity savings are within 25% of ours (they did not measure gas), except for the case with continuous circulation and no
Table 4. ECM Electrical Savings from Three Studies
Savings due to ECMs (kWh/year)
Without continuous circulation With continuous circulation
CCHT ACEEE Wisconsin CCHT ACEEE Wisconsin No air conditioning 324 617 400 1.535 N/A 3,360 With air conditioning 372 742 465 2,808 N/A 3,455
A/C. We modelled this case with the furnace fan off during the non-heating season, which explains our much lower savings. The other differences are easily explained by the facts that the Wisconsin study included multi-stage ECM furnaces, and took place in occupied houses, many of which used thermostat setbacks. Thus, the two studies based on measurements of actual furnace performance are in close agreement. A major strength of this study is that it directly measured the effects of an ECM in a particular furnace under controlled conditions. A weakness is that it used a single-stage furnace while many furnaces with ECMs are multi-stage.
ECMs and Power Factors
ECMs have lower power factors than PSC motors, and this could be a concern to utilities. A lower power factor (PF) results in a higher VAR (volt-ampere-reactive). Residential customers do not pay for VAR, but it results in higher line losses, and requires more generation capacity. Table 5 compares the true power (P), PF and VAR of the ECM and two PSCs used in this study. In circulation speed, the ECM’s P is so low that its VAR is less than 1/5 of the PSC’s. But, in the other two speeds, the ECM’s low PFs give it significantly higher VARs, despite its lower P. However, a recent study by Natural Resources Canada (Thomas, MacKenzie & Hayden 2004) has shown that a choke (induction coil), which should sell for about $5, improves an ECM’s PF by 24 to 31%, while at the same time improving its efficiency by 22 to 38%, the improvements being dependent on motor speed.
A Program to Promote Furnaces with ECMs
Enbridge Gas Distribution (EGD), an Ontario natural gas utility, was an initiator and sponsor of this project. EGD now has a program to promote the installation of furnaces with ECM fan motors (Furdas & Simpson 2003). Prior to the start of the program in 2003, virtually none of the furnaces installed by EGD’s business partners had ECMs. Results of the first year of the program were five times greater than EGD’s own targets. Out of the total of 13,000 retrofit furnaces installed in existing houses, 4,000 or 31% have ECMs. Of the furnaces with ECMs, 57% were high-efficiency, 39% were mid-efficiency, and 4% are unspecified. ECMs are promoted through retail partners, HVAC contractors, bill inserts and the Enbridge website. Installation contractors receive an incentive of $75 per installation.
Table 5. Power, Power Factor and VAR
ECM PSC #1 PSC #2 Motor
Speed P PF VAR P PF VAR P PF VAR Circulation 19.1 0.39 46.1 342 0.77 282 345 0.80 256 Heating 220 0.54 340 485 0.86 286 458 0.86 278 Air Conditioning 444 0.60 589 587 0.82 420 552 0.78 440
Summary & Conclusions
Electronically commutated motors (ECM) are significantly more efficient than the permanently split capacitor (PSC) motors used in most residential furnaces. This is especially true at the lower speeds used for continuous circulation in many new houses. In order to quantify the effects of an ECM on electricity and gas consumption, we installed an ECM in one of the two identical houses of the Canadian Centre for Housing Technology (CCHT), and observed the amounts of furnace natural gas, furnace fan electricity, air conditioner compressor electricity, and all internal electricity in the two houses.
With the ECM and PSC motors operating side by side, the differences in both electrical and natural gas consumption were clear. During the space heating test period, the ECM reduced the average furnace electrical consumption from 9.29 to 2.38 kWh/day, a 74% saving. Electrical consumption for the entire house was reduced from 25.9 to 19.1 kWh/day, which is a 26% saving in a house with a typical electrical load. Reducing the use of electricity by the furnace motor reduces the amount of heat it adds to the house, and thus increases the use of natural gas for heating. This increase was from an average of 213.7 to 243.4 MJ/day, or 14%. This demonstrates a unique fuel switching opportunity associated with ECMs, by which natural gas used at close to 90% efficiency, can displace significant amounts of electrical energy. This efficiency is at least twice the efficiency with which electricity could be generated from gas by any known technology. During air conditioning the ECM saved the following percentages: 48% of the fan energy, 4% of the compressor energy, 21% of the air conditioner (fan plus compressor) energy, and 14% of the electricity used by the entire house.
The HOT2000 house energy simulation model was used to project the CCHT results to a complete year, and also to combinations of other houses, furnaces and climates. For houses that operate furnace fans in continuous circulation mode, the projections show similar benefits over a wide range of conditions, and indicate that ECMs would have significant benefits as a demand side management tool for reducing electrical demand, and as a way of increasing natural gas sales. Electrical savings range from 1,535 to 2,911 kWh/y, and increased use of gas is between 152 and 222 m3/y. They would also reduce net utility bills by amounts that are significant in some locations. Net savings range from $14 to $180 per year, and except in Winnipeg, all are $38/y or greater. Currently, wholesale prices of ECMs are about US$170 resulting in increased consumer costs of around US$350 (Grinbergs 2003). Prices are expected to come down, and properly applied incentives could reduce or eliminate the additional cost to the consumer.
The largest variation among the cities is in the effects on GHG emissions based on provincial mixes of generating fuels. These vary from significant increases in Winnipeg, where electricity is mainly hydro electric with zero GHG intensity, to a range from small increases to significant decreases in Moncton, where electricity is more GHG intensive than natural gas. When GHG emissions are calculated on the basis of electricity from coal, then all locations show significant reductions. Since it is most likely that electrical savings displace some form of fossil fuel generated electricity, actual net GHG emissions would probably be reduced significantly in all cases.
For houses without continuous circulation, the benefits of ECMs are not very significant. But, ECMs would allow such houses to switch to continuous circulation with no significant increase in utility bills. In fact, in most cases utility bills would be reduced slightly. Continuous circulation provides benefits of more even distribution of fresh air and temperatures, and is
especially important in houses that use the furnace fan to distribute fresh air to the house. Thus, ECMs can be part of a package promoting better circulation, comfort and health.
Thus, this project demonstrated two important results. The key result is the demonstration of the benefits of the use of ECMs as furnace fan motors. The second result is the demonstration of the ability of the CCHT to be used as a valuable research facility for examining energy saving opportunities, by accurately measuring secondary and tertiary effects of a relatively small change in one of the houses.
Based on the results of this study, Enbridge Gas Distribution now has a successful program to promote the installation of furnaces with ECMs.
Further study to define the potential impacts of ECMs could include:
• A statistically significant study of the percentages of houses that use continuous circulation. The study should include questions as to whether people would use continuous circulation if they thought it would improve comfort and health, and how much they would be willing to pay for it.
• A study of the costs of ECMs and similar motors, including wholesale costs for various quantities, and resulting costs to consumers.
• Surveys of utilities to determine what their usual swing fuels are.
The results of this report indicate that there are significant potential benefits from ECMs. Further study would better define these benefits, and help to determine the most cost-effective incentive programs to promote them.
References
Edwards, Peter (Peter Edwards Co). 2003. Personal communication. June, 2003.
Furdas, David (Enbridge Gas Distribution) and Craig Simpson (Craig J. Simpson Technical Services). 2003. Personal communication. March 2004.
Grinbergs, Peter (Nutech Energy Systems Inc.). 2003. Personal communication. July, 2003 Phillips, Burt. 1997. “Residential Furnace Blower Efficiency and Power Requirements”.
Columbus, Ohio: International Appliance Technical Conference.
Pigg, Scott. 2003. Electricity Use by New Furnaces. Madison, WI: Energy Center of Wisconsin. Proskiw, Gary (Unies Ltd.). 2002. Personal communication. September, 2002.
Sachs, Harvey M. and Sandy Smith. 2003. Saving Energy with Efficient Residential Furnace Air
Handlers: A Status Report and Program Recommendations. Report Number A033. Washington, D.C.: American Council for an Energy-Efficient Economy.
Thomas, Martin, Derick MacKenzie, and Skip Hayden, 2004. “Laboratory Testing of Brushless DC Motors (ECM Motors),” In Proceedings of Natural Gas Technologies II: Ingenuity