READ THESE TERMS AND CONDITIONS CAREFULLY BEFORE USING THIS WEBSITE.
https://nrc-publications.canada.ca/eng/copyright
Vous avez des questions? Nous pouvons vous aider. Pour communiquer directement avec un auteur, consultez la
première page de la revue dans laquelle son article a été publié afin de trouver ses coordonnées. Si vous n’arrivez pas à les repérer, communiquez avec nous à [email protected].
Questions? Contact the NRC Publications Archive team at
[email protected]. If you wish to email the authors directly, please see the first page of the publication for their contact information.
NRC Publications Archive
Archives des publications du CNRC
This publication could be one of several versions: author’s original, accepted manuscript or the publisher’s version. / La version de cette publication peut être l’une des suivantes : la version prépublication de l’auteur, la version acceptée du manuscrit ou la version de l’éditeur.
Access and use of this website and the material on it are subject to the Terms and Conditions set forth at
Visual Support for Version Management
Wein, M.; Cowan, Wm.; Gentleman, W. M.
https://publications-cnrc.canada.ca/fra/droits
L’accès à ce site Web et l’utilisation de son contenu sont assujettis aux conditions présentées dans le site LISEZ CES CONDITIONS ATTENTIVEMENT AVANT D’UTILISER CE SITE WEB.
NRC Publications Record / Notice d'Archives des publications de CNRC:
https://nrc-publications.canada.ca/eng/view/object/?id=7ac75c74-c88b-46f6-91cb-c3e4b7d622e4 https://publications-cnrc.canada.ca/fra/voir/objet/?id=7ac75c74-c88b-46f6-91cb-c3e4b7d622e4
National Research Conseil national
Council Canada de recherches Canada
Institute for Institut de technologie Information Technology de l’information
Visual Support for Version
Management
M. Wein*, Wm Cowan** and W. M. Gentleman*
*Software Engineering Laboratory
**University of Waterloo
March 1992
This report also appears in Proceedings of the 1992 ACM/SIGAPP Symposium on Applied
Computing (SAC) ’92, Kansas City KS, March 1–3 1992, pp. 1217–1233.
Copyright 1992 by
National Research Council of Canada
Permission is granted to quote short excerpts and to reproduce figures and tables from this report, provided that the source of such material is fully acknowledged.
Additional copies are available free of charge from:
Publication Office
Institute for Information Technology National Research Council of Canada Ottawa, Ontario, Canada
K1A 0R6
Copyright 1992 par
Conseil national de recherches du Canada
Il est permis de citer de courts extraits et de
reproduire des figures ou tableaux du présent rapport, à condition d’en identifier clairement la source.
Des exemplaires supplémentaires peuvent être obtenus gratuitement à l’addresse suivante: Bureau des publications
Institut de technologie de l’information Conseil national de recherches du Canada Ottawa (Ontario) Canada
Visual Support for Version Management
M. Wein*, Wm Cowan** and W. M. Gentleman*
* National Research Council of Canada
** University of Waterloo
Abstract
Development of large systems requires a disciplined approach to dealing with configuration management. The cognitive load placed on the programmer is potentially large and the burden can be eased considerably if the programmer is presented with a clear view of the file system containing source files of the system under development, and the view is augmented with suitable tools. The paper presents the argument that tools and the techniques which exploit the visual metaphor and provide good reference models will increase the effectiveness and productivity of the programmer. This paper discusses the perceptual issues involved and presents the benefits of the visual approach in the context of a novel configuration control system.
Introduction
Software engineering of large systems is a hard problem: an important factor in its difficulty is the largeness of the enterprise. Software systems have a very large number of parts and the software engineer must move frequently between different views of the system: from individual statements to libraries of functions, from instructions to data to execution state. To cope with this complexity
programmers often build visual metaphors of the system as they work on it, encouraged by a variety of sources, from undergraduate textbooks to on-line tools. Clearly, tools and techniques for software engineering should consider the existence of the programmer’s visual metaphor, since ones that support and enhance it increase productivity, while ones that conflict with it have the opposite effect.
This paper discusses the role, that visualization plays in software engineering, concentrating on a particular application: configuration and version management. This application is attractive for researchers interested in visual metaphors because all operations are centred on a single well-structured entity: that part of the file system that stores all aspects of a program — source, executables and tools. This entity is generally far too complex for any programmer to hold completely in his or her conscious mind at one time. Consequently it must be accessed, navigated and
manipulated using a variety of views at different scales. In discussing these tools we will demonstrate the configuration management metaphor used in developing the Harmony Operating System [1], showing how its integration with the natural view of a file system makes it easy to understand and use. The configuration management system has been presented previously [2, 3], but the emphasis was on software engineering problems, and although pictorial illustrations of the visual metaphors it uses are essential for explaining it, its important visual properties have never been discussed.
The next section gives a brief overview of configuration management systems, and is followed by a discussion of the dominant visual metaphor for a file system, emphasizing how it exploits properties of the human visual system. The specific model for configuration and version management is then described, and placed in a visual metaphor that accords well with that of the file system. The paper then closes with a discussion of tools and working styles that follow from the visual metaphor, followed by a discussion and suggestions for further research.
A comment on terminology is in order. The original term “version control” was subsequently modified to “revision control,” implying evolution over time. This paper concentrates on maintaining many simultaneously valid versions, in fact, entire and consistent configurations. Therefore, the functions performed by the system discussed here are both for version and revision control as well as for database aspects of configuration management.
History of Configuration Management
The first system for version control (or revision control) was introduced as a commercial product [4] and it was followed by the two popular systems, SCCS [5] and RCS [6]. The principal features of these systems that have become part of many successors are: (1) support for evolution over time with a scheme of storing deltas or changes from one version to the next and, (2) control over concurrency of revision through a discipline of check-out and check-in of files thus ensuring one writer at a time. Both of these systems assume that there is a single, shared underlying file system. This assumption was a natural one at the time these systems were introduced. Both SCCS and RCS have been used extensively in managing versions of programs with an emphasis on managing evolution over time.
The approaches to revision control found in SCCS and RCS have been generalized to support development on networked workstations (on a local area network) [7, 8, 9]. Further generalization to Wide Area Networks is reported in [10] where bandwidth limitations are overcome through
discretionary, but controlled replication of files, as required. The evolution of revision control, from one that is centred on a single file tree in a time-sharing system, to a distributed system has been driven by changes in computing
environments as software development migrated to workstations to take advantage, among others, of the richer user interface where improved visualization tools are possible.
The original systems assumed a linear evolution of versions with only a few branches and consequently few
2 simultaneously valid versions. Increased complexity of
target environments, particularly in realtime systems has further increased the cognitive burden on the programmer. A theoretical study of Directed Acyclic Graphs of evolving versions is reported in [11]. The need for a consistent framework for software development with a clear model of the process in a distributed environment is discussed in [12]. An in-depth and recent discussion of Configuration
Management by one of the originators of the discipline is presented in [13]. The first and apparently the only prior instance of recognition that a visual metaphor is applicable for navigating in complex structured environments was described in the context of an approach to managing documents in an automated office [14]. This paper highlights the fact that there is an overall increase in this cognitive burden on the developer and presents an analysis of how programmers navigate in file systems, how they visualize these systems.
Visualizing File Systems
A file system is usually viewed as a tree. The file system may be an actual tree structure or it may be presented to the programmer as such. Even when the file system is not a tree but is, for example record-oriented, as in Cedar [8], the navigation tools are those of a tree-structured file system (Unix cd syntax for relative or absolute moves). Trees have the advantage of having a visualization that is extended in two dimensions: depth and breadth. In addition there is a root, which provides a reference point. Also, the concepts of Zoom and Pan are well-understood and can be used for display purposes and furthermore, are well-defined for a structure such as the file tree. They can be used as concrete operations within a real visualization of the file system, or as virtual operations within a purely mental representation. In the latter case the are natural analogues to operations performed continually by the human visual system. The simplest navigation system is, in fact the Unix command cd — one step at a time, based on “unique designator” of a file which is the complete path from the root. The complete path is usually a combination of implicit notation (current directory) and explicit notation (list of steps: xxx/yyy/zzz). Navigation in a file tree is similar to navigating while driving a car: the current location plus direction indicators are used to indicate the immediate direction to take. (We assume here that directories are well-enough named and that the model of the file system in the programmer’s head is effective. If so, directories function as well as direction indicators, as highway ones do.) The prevalent directory model, as in Unix gives a pin-hole view of the file system, and that only when cd is augmented by another command, pwd, to discover the current location. A better navigation system is one that uses a
two-dimensional representation to show the file system extended in two dimensions, so that one is navigating as if with a road map, but is in fact even better. Instead of locating the destination and finding a route to it which is then followed step by step, as occurs when one is using a map for navigation, the destination is achieved as part of the selection process. In this respect it may be more like using
an airline timetable. The destination is chosen; the timetable provides an assurance that there is a path from the current location to the destination; choosing to take the path produces the destination without any concern for
intermediate points that are passed through. (Control over intermediate points may still be interesting to a user who is interested in performance: don’t pass through O’Hare!) The main technical problem is the question of scaling. (One author’s home Macintosh has 10,000 files; a typical “source tree” has comparable number.) Large numbers of nodes cannot be shown individually on a 1000x1000 display. (The home Macintosh must use 400 pixels per node!) Devices of adequately high resolution — film recorders can put about 5,000,000,000 pixels on a page which is more than adequate to produce static renderings. However, these are unsuited for displaying the dynamic structure of a file system.
One answer to coping with scaling lies in employing pan and zoom. Users easily construct an overview based on two capabilities: the ability to perform visual search in parallel, making it possible to find an object with pre-defined characteristics efficiently, and the related ability to remember the locations of objects and the contents of locations easily. A fascinating ability of an idiot savant was reported by Luria in The Mind of a Mnemonist [15], where the entire basis for the ability to remember many facts was based on using the spatial metaphor. Likewise, the project at Media Lab at MIT to construct the media room [16] was based on everyone’s dependence on spatial relationships. Taking advantage of these abilities the standard strategy that humans use to organize complicated visual input is as follows: Locate objects of interest by processing an overview in parallel; then direct attention at interesting objects that have been located; attention can then be further focussed on sub-objects if desired. A visual representation with well-designed zoom and pan facilities interacts well with these human capabilities. The user can begin with a view of the file system showing only large scale features, find the part that contains the needed files, zoom in, centred on that part to see greater detail, iterating until the node of interest is found. In general, the user forms a model of the file system extended in space, knowing the location of the desired file. Then, landmarks visible on the large scale view allow him or her to select a smaller scale view, and so on until the file of interest appears. The scheme is particularly effective if views, with at least two scales, are presented at any one time. A well-designed tree usually allows the larger scale views to be constructed using only the higher levels of the tree. As a result the structure is both cognitively and computationally efficient.
Three comments about this scheme must be made. First, an interface like the Macintosh Finder or the OpenLook Filetool does not really implement this scheme. The Finder shows all files in each open folder, so is a peephole into the system, not a bird’s eye view. It is, in fact, common for users of the Finder to keep open all folders between the current folder and the root, using a systematic arrangement of windows on the screen. Multiple branches are presented by keeping the corresponding windows open. A utility like
MacTree Plus [17] is much closer to being able to present
the scalable view of the file system that is desirable (see Figure 2). The OpenLook Filetool adds a graphical display
3 of the path from the root to the current directory, which is
useful information, but incomplete compared to the large scale overview. In particular, it presents a strictly linear path along one set of branches.
Second, the user’s ability to retain information about the contents of different locations in the spatial metaphor depends on the file system maintaining the same spatial structure, but how precisely, is currently an open question. It is obvious that major rearrangements of the large scale structure of the file tree make the zooming paradigm unworkable, and that minor changes in which files maintain their relative positions is quite acceptable. But the point at which acceptable changes become unacceptable is not known, although the problem arises in other interface applications [18].
Third, much information about the mapping of the file system structure onto two-dimensional space is maintained internally by the programmer, making frequent reference to the pictorial representation unimportant once the structure is well-learned. Thus, it is common to find programmers using the spatial metaphor even when spatial display tools are not available to them. For example, when a programmer draws a representation of part of a file system on a napkin in a restaurant it is almost always laid out in accord with this metaphor. In this case they are using a spatial memory as an aid similar to the one used so impressively by Luria’s mnemonist.
The DaSC Model of Configuration and Version Management
Rationale and basic system
The DaSC (Database Selectors Cel) model for configuration and version management places the software source files into an overlapping set of layers. Changes and evolution are supported by the layer model where the current view of a particular version is the view through all the relevant layers with the most recent layer on top and the original release in the bottom layer. The basic major release of the system is in the bottom read-only layer. The term Cel in DaSC is derived from the animator’s Cel which is a sheet of celluloid on which portions of an animation image are drawn. A complete frame of an animated film is a sandwich of cel layers, each containing a portion of the image.
At the National Research Council of Canada the DaSC system is used for version control of a realtime
multiprocessing operating system for configurable single -board computers. The target systems are building-block computers with a different valid version for each
configuration. The need to maintain additional valid versions for different development systems and compilers further escalates the problem. Thus, the DaSC system must support fifteen to twenty simultaneously valid versions, all of which evolve over time. The software engineering requirement for supporting many valid versions is described in [2] and [3] while the visualization issues are discussed here. In order to
discuss the issues of visualization the actual system needs to be described in more detail.
The first step in the organization is to place each function in a separate file in the file tree, as shown on the right of Figure 1. Each file contains one function or one abstraction, for example a set of related “ .h” definitions. No conditional compilation (no #ifdefs) is used because these constructs, especially nested ones, lead to programs that are virtually unreadable by humans. Instead the directory structure is used to place siblings (different versions of a function) in adjoining directories as shown in Figure 1, where
differentiation with respect to processor type and board type have been highlighted. Here, the function fcn1.c is specific to the board type. Each sub-directory under “boards” is specific to the board type and contains a board-specific version of fcn1.c. Note that all the versions have the same name and are differentiated by the path to the directory. The functions on the src side of the tree also do not contain any #include statements so that the entire src branch is independent of the development system, i.e. of the pathname syntax.
A specific version is defined by a selector file on the left branch (inc) of the file tree as shown on the left of Figure 1. A selector file contains pointers to all the components that represent a specific valid version. A selector file is composed only of #include statements, each of which consists of the pathname to the selected variant. The exact form a pathname depends on the syntax of the particular file system on the development platform, though its semantics depends only on the file system being a tree, which is true of all file systems supported. Because all #include
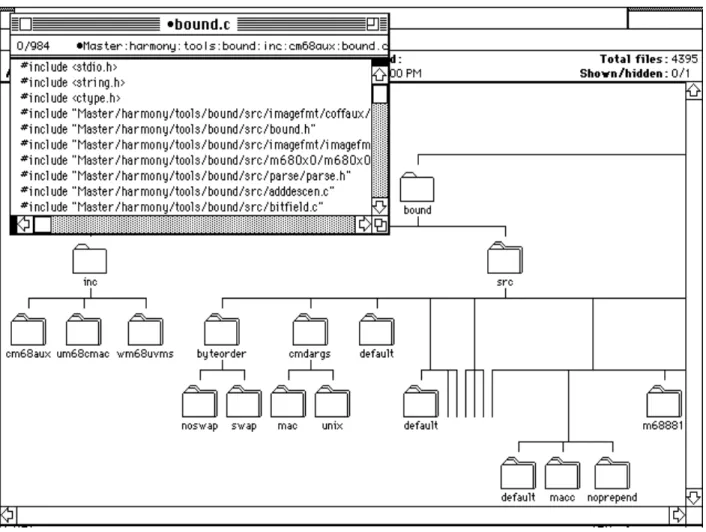
statements are confined to the inc side of the file tree, all dependencies on the file system syntax are concentrated on that side of the tree. A more detailed view of the a fragment of the base layer is shown in Figure 2, which shows a part of the src tree for the tool bound.1 The inset window in Figure 2 shows a portion of the selector file for the version with Unix pathname syntax (slash separators). On any one development platform, of course, only the selector files with the appropriate syntax can be compiled.
Evolution over time
Evolution over time is indicated by adding layers that are placed on top of the master read-only layer containing the major release of the software. A hollow file tree containing no files and only some of the branches is created in the
Working layer and functions that need to be modified are
copied to the corresponding directories on src side of the
Working layer, as shown in Figure 3. As well, the selector
file for the new version is placed on the inc side in the
Derived layer, as shown in Figure 3. All #include
statements in the new selector file still point to targets in the
Master layer, except the two entries for the modified files
that are now in the Working layer. Thus the composite view
1 Bound is a tool for calculating stack size required by a
4 of the revised version consists of the ordered set of the three
layers. Compiling and linking of the selector file in the
Derived layer produces a binary executable for the new
version. All the derived files that the tools produce (listing, map, .s files and cross-reference) are placed in the inc directory in the Derived layer (hence the name). For example, say the program illustrated in Figure 2 needed revision, where the two files bound.h and bitfield.c needed to be revised. The two files are copied to the
Working layer and modified as required. The selector file
shown in the inset of Figure 2 is copied to the Derived layer and the two lines pointing to the two files are changed as shown in Figure 4. The principal tool for these operations is the editing system, as described later. The new selector file may then be compiled and will pull in the revised versions while all original files remain intact in the Master layer. An important consequence of the layer model is that the bottom layer is read-only and can be replicated on each workstation for each developer — a second one is shown on the right of Figure 3. This arrangement reduces bandwidth requirements for running tools because there are no network accesses and more importantly, permits development while either detached from, or intermittently attached to the network. It should be noted that the scheme uses “free -wheeling” concurrency control based on the concept of optimistic concurrency control in databases [19, 20, 21]. Multiple writers are permitted to proceed and in great majority of cases no actual collision occurs and the update is accepted, while in a small number of cases a collision is detected and resolved as a special case.
#include <stdio.h> #include <string.h> #include <ctype.h>
#include "Master/har ..efmt/coffaux/symtab.h" #include " Working / .. rc/bound.h "
#include "Master/har .. imagefmt/imagefmt.h" #include "Master/har .. m680x0/m680x0.h" #include "Master/har .. parse/parse.h" #include "Master/har .. adddescen.c" #include " Working / .. rc/ bitfield.c" ...
Fig. 4. The selector file from the inset of Fig. 2, copied to the Derived layer and with two pointers revised to select items in the Working layer (shown in bold).
Visualizing Multiple Versions
The layer model is easy to visualize. The master layer sits at the bottom, forming a foundation for the structure. Above it float partial trees containing modifications. These trees are exactly the same in size and shape to those parts of the foundation that they modify. This easy-to-understand structure captures the essence of DaSC model in a single representation which may be presented graphically but is more likely to be used mentally by the programmer. The visual model can be viewed from two interesting directions. From above it shows the current state of the system, with newer versions obscuring the older versions below them. Furthermore passing down through the layers offers a series of views that show the system as it was at
earlier stages of the revision process, views that are often important when the programmer is reviewing progress or comparing the present state of the system with objectives that were set out in the context of an earlier version. From an edge on viewpoint the programmer sees the progress of the revisions. In this perspective large scale views allow easy differentiation between regions of the tree that have been heavily modified and ones that are relatively untouched. When the programmer then zooms on the large scale representation individual files can be seen as modified or not. Additionally, the local context of this modification is also easily visible: it is easy to see that a file was modified earlier or later than similar files that lie near it in the source tree.
This model is very natural. It plays such an essential role in explaining the system that we believe most programmers visualize it when using the DaSC version management system. Part of its naturalness lies in the transformation of a temporal sequence of modifications into spatial extension. Such transformations are common in the physical sciences when motion is presented in static images, and is also common when sequences of states are presented in undergraduate computer science textbooks.
An essential feature of this representation is preservation of the structure of the file system as changes are made. The
DaSC system requires rigid preservation of file system
structure, and, as noted in our earlier description of file system visualization, this constancy is exactly what human cognition requires to make effective use of spatial memory aids. Furthermore the changes that do occur within the DaSC system, such as including files for a new compiler or CPU, insert individual files in well-defined positions in the file tree. In the visual representation neighbouring files are squeezed aside to make room, preserving the overall structure, a jostling model similar to the one used in window systems [18]. The rigid overall structure requires definition of the file structure at the beginning of the project, with the expectation that it will be retained to avoid upsetting the mental models of all participating programmers. This constancy may be considered a drawback or an advantage. It provides no places for genuinely novel parts that get added to the system later. On the other hand it severely limits the programmer’s natural tendency to graft parts carelessly onto the file system.
This visualization uses the third dimension to indicate progress through time of a two-dimensional visualization of the file system. A possible alternative strategy might be to use the additional dimension to encode configuration information like compiler or CPU instead. In fact, one of the authors, WC, originally advocated using a field-structured file system to create a matrix that would encode
configuration information. This idea shows immediately why encoding configuration information spatially is not useful: there are so many possible dimensions of configuration that the result is a structure of many dimensions. Techniques for effective display of such structures simply do not exist, and it is doubtful that they can be visualized successfully by any but very exceptional programmers.
5
Tools For Configuration and Version Management
Navigating and working in the visually oriented system described here requires tools. A consequence of the approach is the need to work with a large number of files, therefore the approach can be affective only if it is supported by suitable tools for multi-file editing.
First of all, one must be able to view large portions of the file system simultaneously even if only to refresh the visual reference model. At the time when the system was first placed into use, the Macintosh computer offered the most suitable environment with its own Finder and because it offered the richest set of tools from third-party developers. The file tree representation in Figure 2 was produced with a tool MacTree Plus [17]. This tool is now being supplanted by newer ones from other developers.
The key element in the development process is the multi-file programmer’s editor [22]. The programmer is able to open for editing a large number of files, as shown in Figure 5, where all code files can appear, if desired, tiled on the screen, permitting rapid shift of attention from one file to the next. The customary “grow-box” is used to zoom in on a file, perform some editing task and zoom the tile back to its small icon-like appearance in the tiled array. What
distinguishes the current generation of editors (and word processors) on personal computers is their ability to open many documents. Many traditional Unix-based editors run a separate copy of the editor for each open file. As a
consequence, it is impossible to perform global operations, such as regular-expression searches, on all open documents. There is still a shortcoming in the editor being used, in that the view of the file system from the Finder is different from that seen from the editor (or any other Macintosh
application). A better symmetry of view is preserved in the interface of the NeXT computer.
see end of document
Figure 5 Multifile editor with several files open. Each document window can be enlarged rapidly for editing.
The macro script facilities within the editor are used to manage files in the layer model. For example, a script is used to copy a file from one layer to the corresponding place in the tree in another layer. If necessary, the script creates all
the intermediate nodes to the desired location in the tree. Doing this by macro is essential to maintaining the precise visual identity needed for successful visualization, not to mention the ability of operating on the file system using programmed tools. (It is interesting in this context that the requirements necessary for program management of a data structure—the file system—concur exactly with those necessary for human interaction — visualization—with the data structure.) Most commonly, this process is used to create a layer with a hollow tree containing no files, where a few files to be edited, will be placed. Of course, a new version of the selector file must be created in the Derived layer, as shown in Figure 3, to contain pointers to the revised files. The selector file has one other useful function. It is often used as a collection of pointers, to open a specific file: Double-click on an entry and execute a script that extracts the pathname and opens the file. The user then requests with a specific menu selection that the screen be re-tiled.
Automatic re-tiling is undesirable because it would have rearranged all the open documents and thus violating the principle of stability of screen layouts.
Another interactive tool that was written constructs the most recent version of a selector file by taking each entry in the selector file and searching upper layers for the existence of more recent versions [23]. It is not the date stamp but the order of layers that determines the time line to the most recent version.
A final tool [23] is used to coalesce layers in a consolidation process, which is done to produce a new release, either a major one (one final layer) or a minor one (one layer on top of the un-modified base layer). Prior to consolidating layers one must execute a macro script to identify conflicts between layers that may have been produced by different programmers. From the visualization’s point of view coalescence of layers does not change the appearance of the original composite layers. They are now merely one or two layers instead of the original several layers.
The tools are described here from the point of view of their consistency with, and the contribution to, the perceptual model. Of course, these tools include many algorithmic functions that are necessary in a working environment. A detailed discussion of the tools is given in [23].
Conclusions
The premise presented in this paper is that programmers can cope with complexity if they work in an environment in which the complexity has a representation that is easy to visualize. Such representations can be explicitly displayed, or they can provide the programmer with a spatial model that is mental, or a combination of both. In general, systems that are cognizant of these perceptual issues are likely to be more successful than other non-visual ones.
The paper discussed the perceptual and visual aspects of the layer oriented approach to configuration control in managing the evolution over time of the source file system for an operating system that supports many simultaneously valid versions. Within this context some of the useful tools, both developed as part of the project and also commercial ones, were discussed.
6 Future work will include the further development of tools
that accord well with the visual models described here, and new tools that will allow programmers to manipulate such models directly. One possible benefit of such tools is that all programmers on a project begin using the same spatial representations, with a probable increase in productivity. The authors have already established that the layer model is a useful exchange medium between cooperating
organizations where portions of a system are being developed in both organizations.
Acknowledgments.
Many ideas as well as the implementations of the various tools and scripts were developed by S.A. MacKay, assisted by a number of students. A detailed discussion of the tools is in preparation [23].
References
[1] W.M. Gentleman, S.A. MacKay, D.A. Stewart, and M. Wein, “Using the Harmony Operating System, Release 3.0,” NRC/ERA-377, National Research Council of Canada, Ottawa, Ont., February 1989. [2] Gentleman, W.M., MacKay, S., Stewart, D., and
Wein, M., “Commercial realtime software needs different configuration management,” Proceedings of 2nd International Workshop on Software
Configuration Management (SCM), Princeton, NJ. October 24 –27, 1989. Published in Software Eng. Notes, Vol. 17, Nr. 7, pp.152–161; 1989.
[3] W.M. Gentleman, “Managing Configurability in Multi-Installation Realtime Programs,” Proceedings of the Canadian Conference on Electrical and Computer Engineering, Vancouver, B.C., pp. 823–827,
November 3 –4 1988.
[4] DeJong, S.P., “The System Building System (SBS),” IBM Research Report RC4486, IBM Yorktown Heights, New York, August 1973.
[5] Marc J. Rochkind, “The Source Code Control
System,” IEEE Transactions on Software Engineering, Vol. SE-1, No. 4, December 1975, pp. 364 –370. [6] Walter F. Tichy, “RCS – A System for Version
Control,” Software - Practice and Experience, Vol. 15, No. 7, July 1985, pp. 637–654.
[7] D.B. Leblang and R.P. Chase Jr., Computer Aided Software Engineering in a Distributed Workstation Environment, Sigplan Notices, Vol. 19, No. 4, 1984, pp. 104–112.
[8] B. W. Lampson and E. E. Schmidt, Organizing Software in a Distributed Environment, Sigplan Notices Vol. 18, No. 6, June 1983, pp. 1–12. [9] David B. Leblang, Robert P. Chase Jr. and Howard
Spilke, “Increasing Productivity with Parallel Configuration Manager,” in Berichte of the German Chapter of ACM, Vol. 30, ed. J.F.H. Winkler.
Proceedings of the International Workshop on Version
and Configuration Control, Grassau, January, 1988, pp. 21–37.
[10] B. Donovan and J.B. Grimson, A Distributed Version Control System for Wide Area Networks, Software Engineering Journal, Vol. 5. No. 5, 1984, pp. 255– 262.
[11] N. Nishimura, Complexity on Tree-Based Version Control, Lecture Notes in Computer Science, Vol. 382, 1989, pp. 472–486.
[12] J. Walpole, G.S. Blair, J. Malik and J.R. Nicol, A Unifying Model for Consistent Distributed Software Development Environments, Software Engineering Symposium on Practical Software Development, ’88, Sigplan Notices Vol. 24, No. 2, Feb 1989.
[13] Walter F. Tichy, “Tools for Configuration
Management,” in Berichte of the German Chapter of ACM, Vol. 30, ed. J.F.H. Winkler. Proceedings of the International Workshop on Version and Configuration Control, Grassau, January, 1988, pp. 1–20.
[14] J.W. Davison and S.B. Zdonik, A Visual Metaphor for Database with Version Management, ACM
Transactions on Office Information Systems, Vol. 4, No. 3, July 1986, pp 226 –256.
[15] A. R. Luria, The Mind of a Mnemonist: a little book about a vast memory, translated by Lynn Solotaroff, Basic Books: New York, 1968.
16] C.M. Schmandt, “Interactive Three-dimensional Computer Space,” Proc SPIE, Conf. on processing and display of three-dimensional data, Aug 1982.
[17] MacTree Plus, The hard disk management for the Macintosh, Go Technology, 1988.
[18] K.G. Schlueter, Perceptual Synchronization in Window Systems, M. Math. Thesis, University of Waterloo, Waterloo Ontario 1990.
[19] H.T. Kung and J.T. Robinson, “On Optimistic Concurrency Control,” ACM Transactions on
Database Systems, Vol. 6, No. 2, June 1981, pp. 213 – 226.
[20] L. Lamport, “Concurrent Reading and Writing,” Communications of ACM, Vol. 20, No. 11, November 1977, pp. 806–811.
[21] M. L. Kersten and H. Tebra, “Application of an Optimistic Concurrency Control Method,” Software Practice and Experience, Vol. 14, No. 2, February 1984, pp. 153–168.
[22] V. Romano and J. Lewak, “QUED/M Programmer’s Editor,” Paragon Concepts, Solana Beach CA, 1988. [23] S.A. MacKay, A Set of Tools for Software
7 Figures
inc
src
selectors
source files
•
Fig.1 A tree of selector files is in the inc branch on the left. The tree of
functions is on the right in the src branch. Function fcn1.c depends on the type of
processor board and five versions are placed in five directories under boards.
Function fcn2.c depends on processor type and three versions are placed in three
directories under m680x0.
68000 68020 68030
fcn2.c
fcn2.c fcn2.c
m680x0
fcn1.c
fcn1.c
fcn1.c
fcn1.c
fcn1.c
iov68 dvme134 dy750
atarist
chorus
boards
sys
root
8
Fig. 2. A portion of the file tree for the tool bound. The inset window shows a portion
of the selector file for the Unix (AU/X) version of the tool, with Unix style pathnames
with “/” separators.
9
inc src
inc src
inc src
Master - read only
Working
Derived
selector
revised files
Layer model of the file system. Master layer is read-only. Revised files are
placed in the Working layer. The new selector file is placed in the Derived layer
with revised entries pointing to new files in the Working layer.
Fig. 3.
Master - read only
(another user)
#include <stdio.h> #include <string.h> #include <ctype.h>
#include "Master/har ..efmt/coffaux/symtab.h" #include "Working/ .. rc/bound.h"
#include "Master/har .. imagefmt/imagefmt.h" #include "Master/har .. m680x0/m680x0.h" #include "Master/har .. parse/parse.h" #include "Master/har .. adddescen.c" #include "Working/ .. rc/bitfield.c" ...
Fig. 4. The selector file from the inset of Fig. 2, copied to the Derived layer and with two pointers revised to select items in the Working layer (shown in bold).
10