Publisher’s version / Version de l'éditeur:
Journal of Environmental Polymer Degradation, 5, 3, pp. 137-151, 1997
READ THESE TERMS AND CONDITIONS CAREFULLY BEFORE USING THIS WEBSITE. https://nrc-publications.canada.ca/eng/copyright
Vous avez des questions? Nous pouvons vous aider. Pour communiquer directement avec un auteur, consultez la
première page de la revue dans laquelle son article a été publié afin de trouver ses coordonnées. Si vous n’arrivez pas à les repérer, communiquez avec nous à PublicationsArchive-ArchivesPublications@nrc-cnrc.gc.ca.
Questions? Contact the NRC Publications Archive team at
PublicationsArchive-ArchivesPublications@nrc-cnrc.gc.ca. If you wish to email the authors directly, please see the first page of the publication for their contact information.
Archives des publications du CNRC
This publication could be one of several versions: author’s original, accepted manuscript or the publisher’s version. / La version de cette publication peut être l’une des suivantes : la version prépublication de l’auteur, la version acceptée du manuscrit ou la version de l’éditeur.
For the publisher’s version, please access the DOI link below./ Pour consulter la version de l’éditeur, utilisez le lien DOI ci-dessous.
https://doi.org/10.1007/BF02763657
Access and use of this website and the material on it are subject to the Terms and Conditions set forth at
Degradable polymers : The role of the degradation environment
Day, M.; Shaw, K.; Cooney, D.; Watts, J.; Harrigan, B.
https://publications-cnrc.canada.ca/fra/droits
L’accès à ce site Web et l’utilisation de son contenu sont assujettis aux conditions présentées dans le site LISEZ CES CONDITIONS ATTENTIVEMENT AVANT D’UTILISER CE SITE WEB.
NRC Publications Record / Notice d'Archives des publications de CNRC:
https://nrc-publications.canada.ca/eng/view/object/?id=b9cc1699-1b24-483d-ad88-abfbbed9849d https://publications-cnrc.canada.ca/fra/voir/objet/?id=b9cc1699-1b24-483d-ad88-abfbbed9849dJournal of Environmental Polymer Degradation, Vol. 5, No. 3, 1997
Degradable Polymers: The Role of the Degradation
Environment 1
M. Day, 2'3 K. Shaw, 2 D. Cooney, 2 J. Watts, 2 and B. Harrigan 2
The degradability of several degradable polymers was examined using three types of degradation environments. These include exposure in a laboratory-scale composting test system containing material representative of the organic fraction of municipal solid waste (MSW), exposure in a
thermal hydrolytic environment consisting of water at 60~ and exposure in a thermal-oxidative,
dry oven environment of 60~ The results of the investigation clearly indicate that, in addition
to chemical and biological activity which can lead to polymer degradation, physical restructuring and reorganization of the macromolecular structure may also occur at temperatures typically found in a compost environment, resulting in changes in the mechanical properties of the polymer films. In the case of the polyethylene-modified polymers evaluated in this study, all behaved similarly, but differently from the other polymer types. The polyethylene-based films appeared to be sus- ceptible to oxidative degradation and should degrade in a composting environment providing that there is sufficient air in contact with the film for a sufficient period of time. However, when exposed in a laboratory composter, it appears that although ideal temperature-time curves may be obtained, the test time period was insufficient in comparison to the induction period required to achieve the desired thermal oxidative degradation.
KEY WORDS: Biodegradation; thermal degradation; hydrolytic degradation; composting.
I N T R O D U C T I O N
Over the last few years there has been growing in- terest in degradable polymers. The key focus of much of the earlier research and development was on ecolog- ical applications, principally waste disposal [1-4]. To- day " n e w e r " degradable polymers are being engineered for highly specialized niche markets [5-8] such as pack- aging for the fast food industry, where sorting, clean- ing, and recycling are not competitive with composting. Other opportunities include use as mulchable agriculture films and personal hygiene products. However, it is pos- sible that the recent increase in the number of commer- cial composting operations for the management of mu-
~Issued as NRCC No. 37620.
2 National Research Council Canada, Institute for Chemical Process and Environmental Technology, Ottawa, Ontario, K1A 0R6 Canada. 3To whom correspondence should be addressed.
nicipal solid waste (MSW) that has spurred current renewed interest [9, 10].
It has been estimated that in North America, up to 60% of the MSW [11, 12] is organic in nature and po- tentially compostable. In certain states in the United States and provinces in Canada, in order to achieve mandatory landfill diversion rates of 50% or higher, composting is seen as an essential component of the solid waste management system. Consequently, the use of biodegradable polymers in the packaging of organic/ biodegradable materials, such as food, enables this waste to be directly composted without the need to separate the contents from the packaging. In addition, the use of degradable plastic bags to collect yard wastes has an appeal from the compost management point of view, since it solves the problem of debagging incoming ma- terial.
This interest in degradable plastic bags has spawned numerous research projects on the compostability of a
137
wide range of polymer types [ 13-20]. However, in many of these studies it has not been clearly established that the loss in the physical properties of the polymeric ma- terial in the composting environment was actually the result of biological processes. Other degradation pro- cesses may have been occurring which do not involve the action of naturally occurring microorganisms such as bacteria, fungi, and molds. For example, it is possi- ble that the polymer may be degrading as a result of hydrolysis, or alternatively, it may be due to thermal oxidative cleavage of the polymer chains.
In order to assess the decomposition pathways, a series of experiments was performed in an attempt to separate the roles of thermal oxidation, hydrolysis, and biological activity. It should be pointed out that in a composting environment all the above degradable path- ways are possible and all can result in the degradation of the polymer. However, irrespective of the initial deg- radation step, it is likely that smaller molecular frag- ments will be produced, which will then be more ame- nable to biological activity, resulting in enhanced biodegradation of the polymer [8].
EXPERIMENTAL
Materials
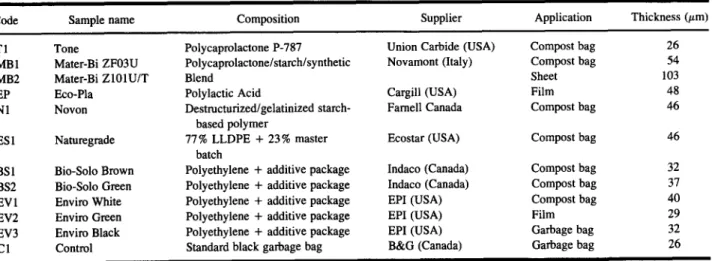
A wide range of degradable polymeric materials was obtained from suppliers in Canada, the United States, and Europe. These materials are listed in Table I, along with their chemical composition as provided by the supplier or obtained from other sources. The poly-
mers selected for this evaluation included biodegradable polymers based upon polycaprolactone and polylactic acid as well as those based upon starch blends and poly- ethylene containing additive packages. The polyethyl- ene samples all contained specific additive packages, which were designed so that the degradation of the poly- mer was initiated once specific conditions were attained. In order to facilitate the evaluation, all samples were available as either a sheet or a film.
Composting
MixtureA standard, reproducible synthetic composting mixture was used throughout the testing program. This mixture was based upon a formula developed by Procter and Gamble, which was recommended as a good sim- ulation of MSW. This material provides a greater degree of replication of a test environment in order to ensure consistency between experimental runs [21]. The syn- thetic formula was made up of 27.3 % rabbit chow, 23 % ground corn cobs, 12.9% sand, 0.7% composted cow manure, 0.5% shredded newspaper, and 35.6% water. The resulting composition was then blended together to give a homogeneous mixture which typically had a start- ing carbon-to-nitrogen ratio of 30 : 1, a moisture content of 45.3%, a bulk density of 0.50 g/ml, 53% air voids, and an initial pH of 6.5.
The Composting System
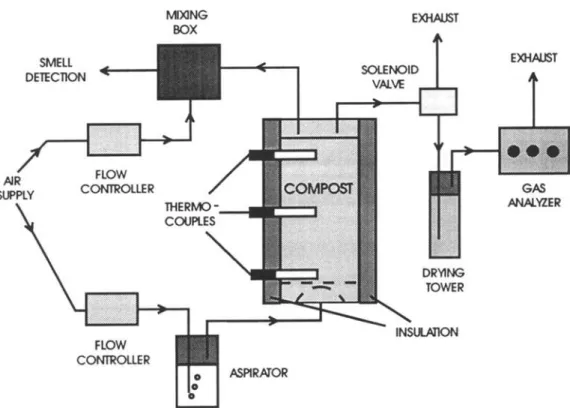
The composting experiments were conducted in 6-L bench-scale units fabricated from 100-mm-diameter glass piping (Fig. 1). Each unit was about 600 mm tall,
Code Sample name
Table I. Polymeric Materials Evaluated in the Study
Composition Supplier Application Thickness (#m)
T 1 Tone MB1 Mater-Bi ZF03U MB2 Mater-Bi Z101U/T EP Eco-Pla N1 Novon ES 1 Naturegrade BSI Bio-Solo Brown BS2 Bio-Solo Green EV 1 Enviro White EV2 Enviro Green EV3 Enviro Black C 1 Control Polycaprolactone P-787 Polycaprolactone/starch/synthetic Blend Polylactic Acid Destmcturized/gelatinized starch- based polymer 77% LLDPE + 23% master batch
Polyethylene + additive package Polyethylene + additive package Polyethylene + additive package Polyethylene + additive package Polyethylene + additive package Standard black garbage bag
Union Carbide (USA) Novamont (Italy) Cargill (USA) Famell Canada Ecostar (USA) Indaco (Canada) Indaco (Canada) EPI (USA) EPI (USA) EPI (USA) B&G (Canada) Compost bag 26 Compost bag 54 Sheet 103 Film 48 Compost bag 46 Compost bag 46 Compost bag 32 Compost bag 37 Compost bag 40 Film 29 Garbage bag 32 Garbage bag 26
Degradable Polymers
139
Fig. 1. Schematic of the laboratory-scale composting system.
with 50 mm of free airspace at the bottom and a 100- mm headspace at the top. Air entering the composting reactor first flowed through a water aspirator to saturate the air and prevent the mixture from drying out. The water saturated air supply was then distributed into the base of the reactor by means of a mushroom shaped air diffuser. A fine-mesh screen was used as an interface between the synthetic mixture and the air diffuser to fa- cilitate air diffusion and prevent the compost mixture from obstructing the air inlet ports. The filling of the reactor with the test mixture was done with care to en- sure that the desired bulk density was achieved and air channeling was minimized. During the filling process, three thermocouples were positioned centrally in the re- actor at heights of 80, 240, and 440 mm from the base of the test mix to record temperatures during the com- posting process. The unit was then sealed with a gas- tight cap which allowed for the collection and analysis of the gases exiting the reactor. The exit gas from the composter was then dried and analyzed for carbon di- oxide (CO2), oxygen (O2), and methane (CH4) by the use of a portable Triple Landfill Gas Analyzer (ADCLFG20).
The thermocouple temperature readings and con- centrations of CO2, 02, and CH 4 in the exit gases were
all recorded automatically using a 486 DX 33 IBM- compatible computer operating under Labview Software control. The air supply to the composter was controlled at the desired flow rate of 450 ml/min by the use of a MKS flow controller. Once filled, the reactor was in- sulated with 4-in.-thick polyurethane foam, and all ex- periments were performed in a room maintained at 35 + 1 ~ in order to minimize heat loss.
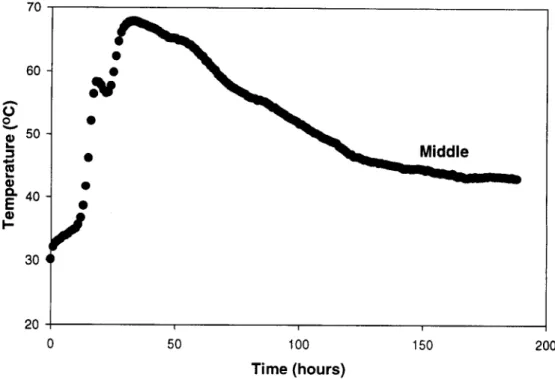
The temperature-time profiles obtained using this setup were reproducible and Fig. 2 represents a typical curve as recorded by the thermocouple located in the center of the composter.
Composting Exposures
Prior to exposure, test strips 2.54 x 15.25 cm were cut from each test sample, with the long dimension par- allel to the machine processing direction. These samples were then sewn into nylon, nondegrading netting bags, which allowed free contact of the composting medium with the sample, while facilitating sample recovery at the conclusion of the experiment. Samples were re- moved from the composter after periods of 3, 7, and 12 days, at which time most of the biological activity was complete (see Fig. 2).
70 60 A tO 9.. p 50
~- 40
=E
I-- 30 20)
Middle I I I 50 100 150 Time ( h o u r s )Fig. 2. Typical temperature/time curve for the synthetic composting mixture.
200
Hydrolytic Treatments
Once again, each sample was cut into test strips 2.54 x 15.25 cm. These samples were then placed in beakers of water, which were heated in an oven at 60~ This temperature of 60~ was selected based upon the typical temperatures achieved in an active composting system (see Fig. 2) and the requirements for composting to be maintained at temperatures of 55-60 ~ for at least 3 days [22]. Samples were removed for evaluation after various exposure times up to a total of 30 days' expo- sure.
Thermal Oxidative Treatments
In this series of experiments the test strips were al- lowed to hang freely in a circulating air-drying oven
maintained at 60~ once again selected to represent the
temperatures typically achieved in an active compost system. Specimens were removed, as in the other ex- periments, at periodic intervals up to a total of 30 days' exposure in order to assess the extent of degrada- tion.
Material Characterization
Following the appropriate exposure, specimens were carefully removed from the test environment and
dried to a constant mass on filter paper at 35~ In the
case of the composted samples, they were first rinsed well with Milli Q water before drying. The specimens were visually inspected prior to the evaluation of changes in physical characteristics such as mass loss, dimensional change, and changes in elongation and strength. The tensile properties of the films were mea- sured using an Instron Model 1123 test machine. Test strips were cut 2 mm wide and 70 mm long and tested with a jaw separation of 25 mm. The tests were per- formed on an average of at least 10 specimens using "Method A--Static Weighting--Constant Rate of Grip Separation Test," outlined in ASTM D 882-83 [23]. The load at break, percentage elongation at break, and yield strength were all calculated for each specimen and the averages were calculated.
RESULTS AND DISCUSSION
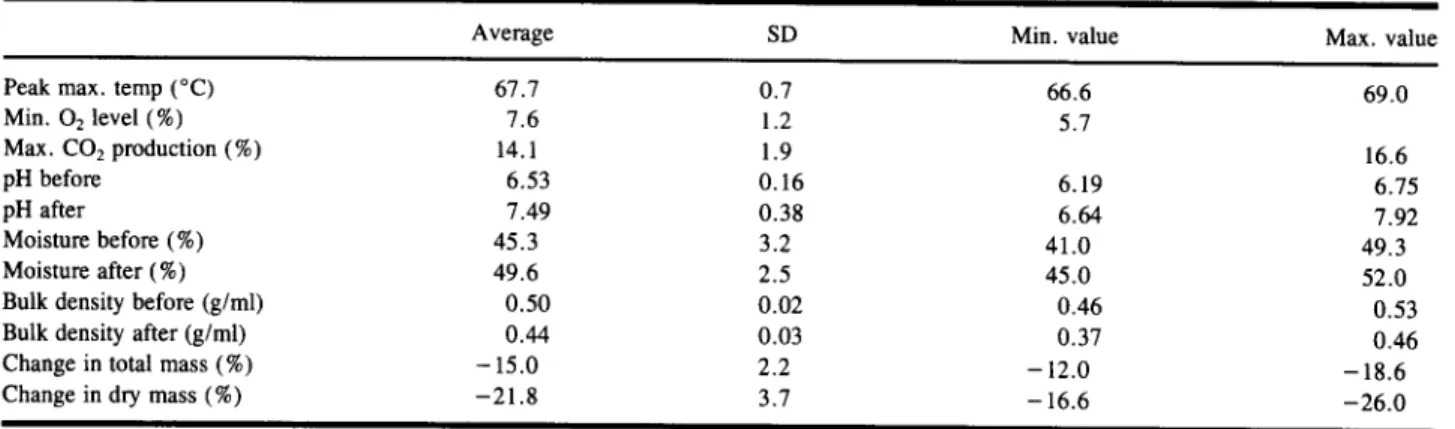
In order to ensure replication of the composting methodology, the physical characteristics of the syn- thetic composting mixture were monitored before and after the composting process. The results of these mea- surements are summarized in Table II. From the data presented in this table it is clear that good repeatability was obtained from run to run, with the material achiev-
Degradable Polymers
141
Table
II. Characteristics of the Synthetic Composting MixtureAverage SD Min. value Max. value
Peak max. temp (~ 67.7 0.7 66.6 69.0
Min. 02 level (%) 7.6 1.2 5.7
Max. CO2 production (%) 14.1 1.9 16.6
pH before 6.53 0.16 6.19 6.75
pH after 7.49 0.38 6.64 7.92
Moisture before (%) 45.3 3.2 41.0 49.3
Moisture after (%) 49.6 2.5 45.0 52.0
Bulk density before (g/ml) 0.50 0.02 0.46 0.53
Bulk density after (g/ml) 0.44 0.03 0.37 0.46
Change in total mass (%) - 15.0 2.2 - 12.0 - 18.6
Change in dry mass (%) -21.8 3.7 -16.6 -26.0
ing temperatures in excess o f 6 0 ~ for a period o f about 2 days (Fig. 2). This high biological activity was con- firmed in terms o f the depletion o f oxygen and evolution o f CO2 noted in the exhaust gas from the composters (Fig. 3). While the initial pH o f the material was just less than neutral, composting caused a slight increase in pH to a value just above 7. In 12 days, mineralization of a typical composting mix resulted in an approxi- mately 22 % mass loss. Meanwhile the use o f a 450 ml/ min saturated airflow rate appears to be sufficient to maintain satisfactory moisture and oxygen levels within the composting medium.
Composting Data
The changes in mass and thickness o f the samples, as measured after 12 days o f exposure in one o f the lab- oratory-scale composting reactors, are summarized in Table III. These measurements represent the average o f three specimens. In addition, the mechanical strengths o f the samples removed from the composter are sum- marized in Tables IV, V, and VI, which present the data for the percentage elongation at break, the load at break, and the yield load, respectively. Because o f similarities in the behavior o f the tensile strength measurements,
Sample
Table III. Change in Mass and Thickness as a Result of Exposure in a Composting Environment
Mass change (%) Thickness change (%)
3 days 7 days 12 days 3 days 7 days 12 days
T1 ND ~ ND ND ND ND ND MBI - 2 5 - 5 9 - 5 1 - 2 8 ND ND MB2 - 2 0 - 80 - 9 5 ND ND ND EP - 50 - 80 - 95 ND ND ND N1 - 14 - 12 - 3 6 - 7 ND ND ES1 + 2 + 1 + 4 + 8 0 0 BS1 + 6 + 5 + 2 + 6 +18 + 1 8 BS2 +1 +1 +1 0 + 8 0 EV1 0 - 1 + 1 + 7 + 5 + 7 EV2 + 1 0 0 + 20 + 27 + 34 EV3 0 0 - 1 +12 +18 +18 C1 +1 +1 +1 0 + 3 + 3 a Not determined.
Table IV. Percentage Elongation at Break for Polymer Samples Exposed in the Composting Environment for Different Periods of Time
Composting duration (days)
Sample 0 3 7 12 T1 1717 • 647 ND a ND ND MB1 770 • 220 17 • 6 11 • 6 17 • 6 MB2 1617 • 283 ND ND ND EP 19 • 9 ND ND ND N1 673 • 5 + 2 8 • 3 ND ES1 1051 • 101 1044 • 95 1298 • 256 928 • 118 BS1 960 • 78 853 • 89 1003 • 77 905 • 161 BS2 764 • 139 1009 • 198 1004 • 77 836 • 123 EVI 157 • 23 116 • 18 106 • 23 110 • 19 EV2 162 • 27 227 • 75 350 + 120 251 • 127 EV3 320 • 100 290 • 64 355 • 107 322 • 71 C1 1411 • 340 1309 • 130 1178 • 251 1135 • 167 Not determined.
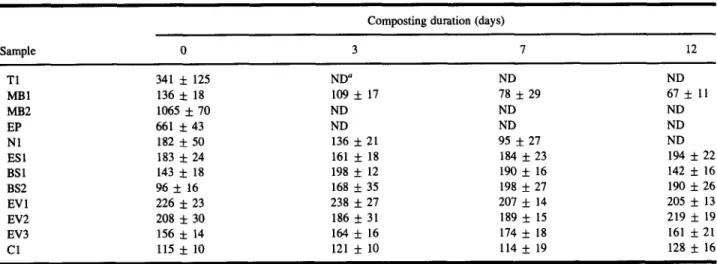
Table V. Load at Break (g) for Polymer Samples Exposed in the Composting Environment for Different Periods of Time
Composting duration (days)
Sample 0 3 7 12 T1 341 • 125 ND a ND ND MB1 136 • 18 109 • 17 78 • 29 67 • 11 MB2 1065 • 70 ND ND ND EP 661 • 43 ND ND ND N1 182 • 50 136 • 21 95 • 27 ND ESI 183 • 24 161 • 18 184 • 23 194 • 22 BSI 143 • 18 198 • 12 190 • 16 142 • 16 BS2 96 • 16 168 • 35 198 • 27 190 • 26 EV1 226 • 23 238 • 27 207 • 14 205 • 13 EV2 208 • 30 186 • 31 189 • 15 219 • 19 EV3 156 • 14 1 6 4 • 16 1 7 4 • 18 161 • 21 C1 115 • 10 121 • 10 114 • 19 128 • 16 aNot determined.
Degradable Polymers 143
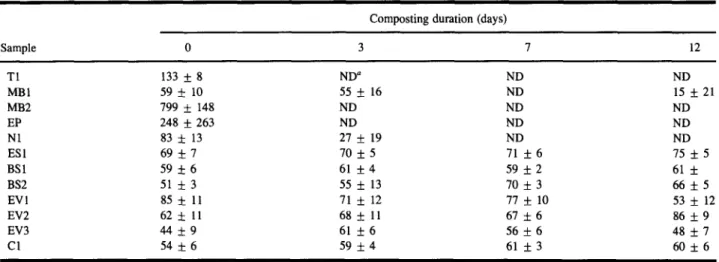
Table Vl. Yield Load (g) for Polymer Samples Exposed in the Composting Environment for Different Periods of Time
Composting duration (days)
Sample 0 3 7 12 T1 133 + 8 ND a ND ND MB1 59 5- 10 55 _ 16 ND 15 + 21 MB2 799 + 148 ND ND ND EP 248 + 263 ND ND ND N1 83 5- 13 27 + 19 ND ND ES1 6 9 _ 7 7 0 + 5 71 + 6 75 + 5 BS1 59 5-6 61 + 4 59 + 2 61 + BS2 51 5- 3 55 + 13 70 + 3 66 + 5 EV1 85 5: 11 71 + 12 77 + 10 53 5- 12 EV2 62 5- 11 68 + 11 67 5-6 86 5-9 EV3 44 5-9 61 + 6 56 + 6 48 + 7 C1 54 + 6 59 5-4 61 + 3 60 5- 6 Not determined.
only the elongation at break has been plotted as a func- tion of exposure time. These data are presented in Figs. 4-12 for each polymer type studied.
From these data it can be seen that some polymers do indeed rapidly degrade and disappear in the corn- posting environment used in this study, while others show no signs of degradation.
The Tone polymer (T1) rapidly disappeared in the composting environment, with no sign of the polymer
film inside the nylon net bag when the sample was re- moved after 3 days.
Both Mater-B• samples (MB1 and MB2) showed substantial changes as a result of the compost• expo- sure, with appreciable mass loss noted in both cases. In the case of MB1, after only 3 days of exposure the film showed appreciable relaxation (accounting for the ob- served increase in film thickness). However, the mate- rial was still in one piece after the full 12 days of ex-
1000 800 r
.o
600 c o ILl 400 200Composting
MB1
Wet
I B ..~ i l 0 t i -- t I I t 0 5 10 15 20 25 30Days
Fig. 4. Changes in the percentage elongation of the Mater-B• sample (MB 1) as a result of exposure in the composting environment, water at 60~ and a drying oven at 60~
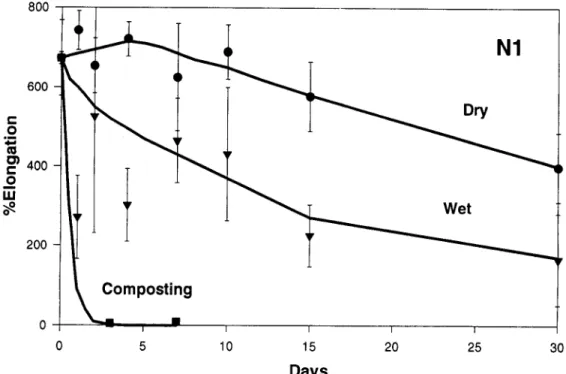
800
N1
600 C O ~ 4 ~ m o } 400 c o i i i 200Composting
Dry
Wet
i -- i I I I I I 0 5 10 15 20 25 30Days
Fig. 5. Changes in the percentage elongation of the Novon sample (N1) as a result of exposure in the composting environment, water at 60~ and a drying oven at 60~
1600 t- O o m t - O Iii 1400 1200 1000 800 600 400 200 0
Composting
ES1
Wet
Dry
I I I I 1 I I 0 5 10 15 20 25 30Days
Fig. 6. Changes in the percentage elongation of the Ecostar sample (ES1) as a result of exposure in the composting environment, water at 60~ and a drying oven at 60~
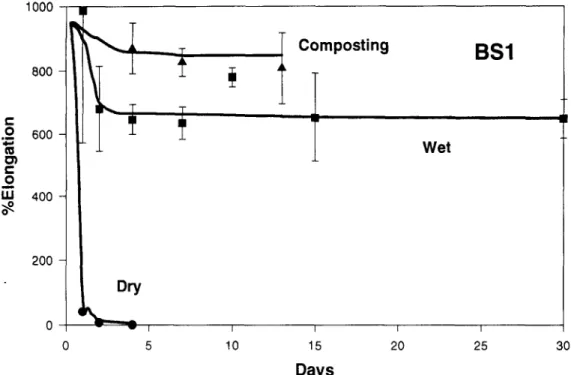
D e g r a d a b l e P o l y m e r s 145 1000 800 600 0 ";i 400 200
icomposting BSl
Wet
k_7
, w I I I I I 0 5 10 15 20 25Days
30Fig. 7. Changes in the percentage elongation of the Bio-Solo Brown (BS1) as a result of exposure in the composting environment, water at 60~ and a drying oven at 60~
1200 - C 0 0') 0 LU 1000 800 600 400 200
[ ~ ~ , ~
posting
Wet
BS2
0 5 r ~ - 10 15Days
q 2O 1 25 30Fig. 8. Changes in the percentage elongation of the Bio-Solo Green (BS2) as a result of exposure in the composting environment, water at 60~ and a drying oven at 60~
200 150
8
~ 1 0 0o
I,LI 50Dry
EV1
Composting
Wet
v I I I I I 0 5 10 15 20 25 30Days
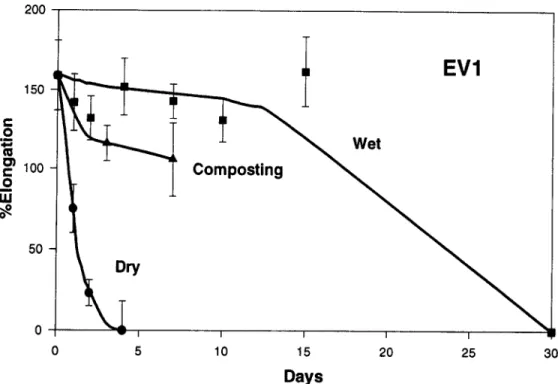
Fig. 9. Changes in the percentage elongation of the Enviro White (EV1) as a result of exposure in the composting environment, water at 60~ and a drying oven at 60~
400 300
8
~ 2 0 0 0 100 0t
EV2
_ i y
~
Composting
I I qP~ [ I uP 0 5 10 15 20 25 30Days
Fig. 10. Changes in the percentage elongation of the Enviro Green (EV2) as a result of exposure in the composting environment, water at 60~ and a drying oven at 60~
Degradable P o l y m e r s 1 4 7 400 300
.2
~ 2 0 0 .2o i i i 1 0 0I
0 5 10I
I
CompostingEV3
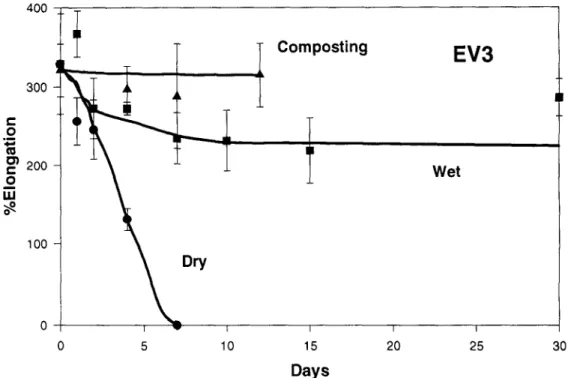
Wet I I I 15 20 25 Days 30Fig. 11. Changes in the percentage elongation of the Enviro Black (EV3) as a result of exposure in the composting environment, water at 60~ and a drying oven at 60~
1800 1600 1400 " 1200 0 ~ 1000 C 0 800 60O 4O0 20O
~T ~
C1
=
I
w e t
" Composting I I I I I 0 5 10 15 20 25 30 DaysFig. 12. Changes in the percentage elongation of the Control (C1) as a result of exposure in the composting envi- ronment, water at 60~ and a drying oven at 60~
posure, and although it did show clear signs of discolouration and loss in physical strength and elon- gation, it was still possible to handle the film without it fragmenting. The other Mater-Bi sample, MB2, how- ever, showed appreciable degradation after only 3 days in the composter. After this 3-day period the film be- came brittle and fragmented easily such that the material had insufficient strength for tensile testing. Conse- quently at the end of the 12-day test period not very much of the sample remained, and what was left was brown in color and adhered to the netting in small frag- ments. Clearly the MB2 degraded appreciably in a corn- posting environment,
The Eco-Pla polylactic acid material (EP) also de- graded very rapidly in the composting environment, such that after only 3 days of exposure the sample was ex- ceptionally brittle and fragmented easily. On removal from the composter after 12 days of exposure, only small fragile fragments remained within the netting.
The Novon sample (N 1) lost a great deal of its flex- ibility after only 3 days of exposure but it did retain its integrity and shape for the full 12 days of exposure, al- though very little strength remained after the 12 days. It should be noted, however, that the observed mass in- crease noted in Table II for this material was due to relatively large amounts of compost and bacterial growth which adhered to the fragile film and which could not be removed without damaging the film.
The Ecostar sample (ES 1) survived the composting exposure tests with only a slight loss in mass and elon- gation at break. However, the physical strength of the material did show some weakening in that the break load was noticeably reduced after 6 days exposure.
Both Bio-Solo samples (BS1 and BS2) remained
virtually unaffected by the 12 days of composting ex- posure, with both samples being in one piece and com- pletely flexible on removal from the composting envi- ronment. The samples also showed no changes in physical properties in terms of elongation at break, break load or yield strength.
The three Enviro samples, EV1, EV2, and EV3, supplied by EPI also showed a similar behavior, i.e., complete stability during the full 12 days of composting exposure. From a control point of view, the standard garbage bag showed no measurable changes during this exposure period, as would be expected for a conven- tional polyethylene material.
A standard Whatman filter paper placed in a com- poster for the same 12 days of exposure became quite fragile, fragmented into several pieces, and was dark brown in color. This Whatman paper result clearly in- dicates that there was plenty of biological activity in the composting systems used for these evaluations.
Thermal Hydrolytic Data
The changes in mass of the samples heated in water at 60~ are presented in Table VII for each sample tested as a function of exposure time. The data on the elongation at break, meanwhile, are presented in Figs. 4 to 12 for each sample, from which measurements were possible. Also provided in these figures are the data for the composting and thermal oxidative degradation stud- ies.
The Tone sample (T1), once exposed to the warm- water environment, was observed to shrivel up into a small ball, from which it was impossible to do any mea- surements on the changes in its physical characteristics,
Table VII. Mass Loss of Samples (%) on Exposure to Thermal Hydrolytic Conditions (60~ for Various Time Periods" Exposure time (days)
Sample 1 2 4 7 10 15 30 T1 0.2 0.1 0.5 0.9 (2.1) 0.3 0.1 MB1 11.0 11.3 10.2 10.6 10.8 10.7 10.7 MB2 8.6 9.1 6.5 21.1 8.4 7.5 63.0 EP 0 0 0 0.5 4.8 21.9 37.8 N1 8.6 9.4 11.0 9.0 8.1 8.7 6.9 ES1 (2) (0.6) 0.8 (0.1) 0 0 (0.1) BS1 0.2 (0.1) 0.5 0.5 (0.1) 0.1 0 BS2 . . . . EV1 (0.4) (0.6) (0.4) (0.6) (0.2) (0.5) 0 EV2 0.5 0.8 0.9 0.8 (0.1) 0.7 47.0 EV3 0.7 0.8 (6.9) 0.7 (0.3) 5.2 0.6 CI 0 0 0 0 0 0 0
Degradable Polymers 149 although the material could be recovered for mass de-
termination. Analysis of the thermal characteristics of the material by differential scanning calorimetry (DSC), however, revealed that melting of the polymer com-
menced at about 49~ with a peak transition occurring
at 62~ Clearly, in view of this low melting point it is
difficult to ascertain if any degradation occurred at 60~ This thermal behavior of the Tone sample (T1) could also explain the disappearance of the sample in the com- posting environment once temperatures in excess of 60~ are achieved.
Both Mater-Bi samples showed significant changes as a result of the hydrolytic exposures with MB2 exhib- iting the most pronounced changes. This material be- came quite rubbery when exposed to the 60~ water and swelled considerably. It was difficult to handle, tearing very easily in the wet state and becoming very brittle when dried, making measurements very difficult if not impossible. Thermal analysis of the sample by DSC re- vealed that the material had a low endothermic transi-
tion temperature of 53~ suggesting that this loss in
physical strength could be associated with a physical re- structuring of the polymer at 60~
The MB 1 sample also showed signs of physical re- laxation when placed in water at 60~ and had to be uncurled into long strips on removal from the liquid be- fore its mechanical properties could be measured. These measurements clearly indicated that the material had be- come brittle and lost some of its strength as a result of hydrolytic exposure. Examination by DSC, once again, revealed a low endothermic transition temperature of about 60~ where physical relaxation and restructuring of the film were occurring. Once again, these effects appear to be responsible for the changes noted in the mechanical properties.
The Eco-Pla polylactic acid sample (EP) showed a gradual deterioration of physical properties under ther- mal hydrolysis exposure conditions. While it was pos- sible to remove test specimens from the water for ex- amination for the first 4 days, after 7 days of exposure the films had become quite brittle and opaque and dif- ficult to handle. Finally, after 15 days of exposure the sample had fragmented into several pieces and was al- most impossible to handle without breaking. DSC ex- amination of the polymer revealed a glass transition
temperature of 55 ~ which suggested, once again, that
molecular rearrangements are occurring within the poly- mer structure at 60~ which could be responsible for some of the changes being noted, rather than chemical hydrolytic action.
Although the Novon sample (N1) showed little loss in strength as a result of thermal hydrolytic exposure,
the sample did show a slight loss in elongation at break indicating some change in the samples. However, with a major endothermic transition at 58 ~ detectable in the DSC analysis, molecular restructuring rather than ther- mal degradation could, once again, be the cause of these changes.
Thermal hydrolytic action appeared to have little or no effect upon the physical and mechanical properties of the Ecostar sample (ESI). Although this sample showed a slight decrease in elongation at break within the first 7 days of exposure, the load at break and yield values remained virtually unchanged for the full 30 days of exposure.
The Bio-Solo samples (BS1 and BS2) appeared to be unaffected by the thermal hydrolytic exposure, re- mining most of their physical characteristics and strength throughout the whole 30-day test period. However, the BS 1 sample did show a slight loss in elongation at break after 7 days of exposure, although the break load and yield values remained virtually unaltered.
The behavior of the three Enviro samples, EV1, EV2, and EV3, proved rather interesting. Sample EV3 appeared to be unaffected by the thermal hydrolytic treatment for the full 30 days of exposure. Samples EV 1 and EV2, meanwhile, appeared to retain their strength for the first 10 to 15 days of exposure but then degraded rapidly, such that the samples removed after 30 days were very fragile and broke into small fragments on re- moval from the exposure environment.
Thermal analysis of all the polyethylene samples with additive packages (i.e., BS1, BS2, EV1, EV2, and EV3) revealed the absence of any major thermal tran- sitions, and their DSC traces were similar to that ob- served for the control sample C 1. Therefore, it may be concluded that the changes noted with samples EV1 and EV2 are more than likely associated with chemical deg- radation processes.
Thermal Oxidative Data
The results of the thermal oxidative degradation study are summarized in Table VIII and Figs. 4 to 12.
Once again, because of the temperature employed in the test, the Tone sample (T1) melted and contracted into a small ball within the first 24 h of exposure in the oven. The Mater-Bi (MB2) and the polylactic acid (EP) samples also were seriously affected as a result of heat- ing in air at 60~ in a manner similar to that noted in the thermal hydrolytic experiments (i.e., they rapidly lost strength and became too brittle to measure any me- chanical properties). For example, the Eco-Pla polylac- tic acid sample (EP) exhibited a deterioration in me-
Table VIII. Mass Loss of Samples (%) on Exposure to Thermal Oxidative Conditions (60~ for Various Time Periods ~ Exposure time (days)
Sample 1 2 4 7 10 15 30 T1 100 100 100 100 100 100 100 MB1 3.8 6.8 7.9 9.0 0.5 40 MB2 (1.6) 2.5 4.4 8.9 2.4 1.9 2.7 EP 0.1 0.4 0.6 0.7 7.5 2.6 14.3 NI 3.3 5.6 1.1 8.1 28.3 2.8 7.2 ES1 (0.2) 0.1 (2.5) (0.2) (1.1) (1.3) (2.3) BS1 1.9 1.3 (0.1) (1.2) 4.9 2.7 3.8 BS2 0 (0.4) (0.3) (1.6) (0.4) 0.8 1.7 EV1 0.4 (1.8) (3.3) 5.9 8.6 11.7 11.5 EV2 0 (0.5) 0 (0.1) 4.0 23.9 2.1 EV3 0 0 (0.3) (3.6) (2.9) ( 1.4) 4.3 C1 0.1 (0.5) 0.1 0.1 0.1 0.1 0
~Values in parentheses denote mass gains.
chanical strength that appears to be consistent more with molecular rearrangement occurring at the 6 0 ~ expo- sure temperature than with actual chemical degradation. The Mater-Bi sample (MB1), meanwhile, did retain suf- ficient strength to permit the measurement o f mechani- cal properties. However, the measured loss in elonga- tion at break, load at break, and yield strength mirrored very closely the observations noted with the hydrolytic experiments. In a similar manner the Novon sample (N 1) mirrored very closely the behavior in the wet atmo- sphere. These similarities in behavior o f the above poly- mers in both the wet and the dry atmospheres, coupled with their known sensitivity to structural reorganization at temperatures below or close to 60~ suggest that these changes in mechanical properties are more than likely physical than chemical.
In the case o f the polyethylene-modified polymers, however, some very interesting and consistent changes were noted in comparing the behavior in a wet and a dry environment at 60~ For example, while little change was noted in the mechanical strength o f the Ecostar sample (ES1) in a wet environment, when the testing was conducted in a dry oxidative environment the ma- terial rapidly loss its strength and, after 12 days o f ex- posure, had completely lost its percent elongation.
The behavior o f the two Bio-Solo samples (BS 1 and BS2) in the two environments were similar except that the changes were more rapid in air than in water, losing their strength within the first 4 days o f exposure.
The other three samples from EPI, namely, EV1, EV2, and EV3, behaved in an almost-identical manner, in both environments, with all three samples showing a rapid loss in elongation, break load, and yield strength within the first 4 - 7 days.
Although not confirmed, it also appears that there are slight weight gains with many o f the polyethylene- based polymers in the initial stages o f exposure. This observation would be consistent with the formation o f oxidative products which act as precursors to subse- quent oxidative chain scission process.
C O N C L U S I O N S
The results o f this degradation study are summa- rized in Table IX using a general ranking scheme. How- ever, when examining the data presented in this table, one has to remember the thermal characteristics o f the polymers as measured by DSC.
Table IX. Summary of the Degradation Study Change noted in environmental exposure a
Thermal Thermal
Sample C o m p o s t hydrolytic oxidative
T1 + + + + + + MB1 + + + + MB2 + + + + + + EP + + + + + + N1 + + + + ES1 0 0 + BS1 0 + + + BS2 0 0 + + EV1 0 + + + + EV2 0 + + + + EV3 0 0 + + C1 0 0 0
Degradable Polymers 151
It appears that the tested polymer samples T1, MB1, MB2, EP, and N1 undergo physical microstruc- tural changes when heated at temperatures between 45 and 60~ as shown by DSC. Consequently exposure in all of the test environments used in this study, in which temperatures of 60~ were attained, is liable to cause changes in the structure of these polymers and influence the mechanical properties of the material. In the case of the samples T1, MB2, and EP, these changes were sufficiently large as to make the polymer films unsuitable for mechanical evaluations. In the case of the Novon (N1) and the Mater-Bi (MBI) samples, however, although thermally induced physical changes were noted, exposure to the biological activity of a com- posting environment clearly results in additional loss in the mechanical properties of these two poly- mers.
The polyethylene-based samples ES, BS1, BS2, EV1, EV2, and EV3, meanwhile, appear to show no signs of appreciable degradation in the laboratory com- posting environment. However, thermal exposure in an oxidative environment at 60~ results in a rapid loss of mechanical properties for all systems. In the case of the thermal hydrolytic conditions, however, only BS1, EV1, and EV2 show any measurable changes, and these changes are not as large as those noted under dry ther- mal exposure conditions. Clearly, free access of oxygen and a steady temperature of 60~ are required for the rapid degradation of these polymers. Even the protec- tive covering of water appears to be responsible for a retardation of the degradative process. Meanwhile, the lack of changes in the composting environment are more than likely due to the limited time of exposure to tem- peratures in excess of 60~ (see Fig. 2).
REFERENCES
1. G. Scott (1990) Polym. Degrad. Stab. 29, 135-154.
2. J. D. Evans and S. K. Sikdar (1990) Chemtech 20(1), 38-42.
3. M. M. Nir, J. Milty, and A. Ram (1993) Plastics Eng. 393, 75-
93.
4. S. J. Huang (1995) J.M.S. PureAppl. Chem. A32(A), 593-597.
5. L. R. Krupp and W. J. Jewell (1992) Environ. Sci. Technol. 26,
193-198.
6. M. Waland, A. Daro, and C. David (1995) Polym. Degrad. Stab.
48, 275-289.
7. P. B. Shah, S. Bandopadhyay, and J. R. Bellare (1995) Polym. Degrad. Stab. 47, 165-173.
8. G. Swift (1995) J.M.S. Pure Appl. Chem. A32(4), 641-651.
9. R. B. Monk (1994) World Wastes 37(5), CS1-14.
10. N. Goldstein and R. Steuteville (1994) Biocycle 35(11), 30-35.
11. U.S. Environmental Protection Agency (1994) Characterization
of Municipal Solid Waste in the United States: 1994 Update,
EPA-S30-C-95-001, Washington, DC.
12. G. H. Hyatt (1995)Agricultural Utilization of Urban and Indus- trial By-Products, ACS Special Publication No. 58.
13. H. G. Greizerstein, J. A. Syracuse, and P. J. Kostyniak (1993)
Polym. Degrad. Stab. 39, 251-259.
14. J.-D. Gu, S. Coulter, D. Eberiel, S. P. McCarthy, and R. A.
Goss (1993) J. Environ. Polym. Degrad. 1(4), 293-299.
15. J.-D. Gu, D. T. Eberiel, S. P. McCarthy, andR. A. Gross (1993)
J. Environ. Polym. Degrad. 1(2), 143-153.
16. F. Lefebvre, C. David, and C. V. Wawen (1994) Polym. De- grad. Stab. 45, 347-353.
17. M. Weiland and C. David (1994) Polym. Degrad. Stab. 45,371-
377.
18. J. Mergaert, C. Anderson, A. Wouters and J. Swings (1994) J.
Environ. Polym. Degrad. 2, 177-183.
19. R. M. Gardner, C. M. Buchanan, R. Komarek, D. Dorschel, C.
Boggs, and A. W. White (1994) J. Appl. Polym. Sci. 52, 1477-
1488.
20. J.-D. Gu, S. Yang, R. Welton, D. Eberiel, S. P. McCarthy, and R. A. Gross (1994) J. Environ. Polym. Degrad. 2(2) 129-135.
21. A. C. Palmisano, D. A. Maruscik, C. J. Ritchie, B. S. Schwab, S. R. Harper, and R. A. Rapaport (1993) J. Microbiol. Methods
18, 99-112.
22. E. Epstein and J. I. Epstein (1989) BioCycle 30(8), 50-53.
23. American Society for Testing and Materials (1988) in ASTM Book