Characterizing Markets for Biopharmaceutical
Innovations: Do Biologics Differ from Small Molecules?
The MIT Faculty has made this article openly available. Please share how this access benefits you. Your story matters.
Citation Trusheim, Mark R., Murray L. Aitken and Ernst R. Berndt.
"Characterizing Markets for Biopharmaceutical Innovations: Do Biologics Differ from Molecules?." Forum for Health Economics & Policy (Frontiers in Health Policy Research) (2010) 13.1 p. 1-45 ©2010 The Berkeley Electronic Press.
Publisher National Bureau of Economic Research
Version Final published version
Citable link http://hdl.handle.net/1721.1/62181
Terms of Use Article is made available in accordance with the publisher's policy and may be subject to US copyright law. Please refer to the publisher's site for terms of use.
Forum for Health Economics & Policy
Volume13, Issue 1 2010 Article4
(F
RONTIERS INH
EALTHP
OLICYR
ESEARCH)
Characterizing Markets for Biopharmaceutical
Innovations: Do Biologics Differ from Small
Molecules?
Mark R. Trusheim
∗Murray L. Aitken
†Ernst R. Berndt
‡∗Massachusetts Institute of Technology, [email protected] †IMS Health, Healthcare Insight, [email protected]
‡Massachusetts Institute of Technology and National Bureau of Economic Research, [email protected]
Characterizing Markets for Biopharmaceutical
Innovations: Do Biologics Differ from Small
Molecules?
∗
Mark R. Trusheim, Murray L. Aitken, and Ernst R. Berndt
Abstract
While much has been written about the distinctions between biologics and small molecules in terms of their scientific, manufacturing and regulatory experiences, relatively little has been published comparing their clinical and commercial experiences. Employing a data base encom-passing all 96 biologics and 212 small molecules newly launched in the U.S. between 1998Q1 and 2008Q4, we compare their downstream clinical and commercial characteristics. Substan-tial heterogeneity occurs across therapeutic classes. Biologics are more concentrated than small molecules in their therapeutic class composition, but have obtained FDA indication approvals in 13 of 15 classes. While average delays between FDA approval and first observed sales revenues are similar, biologics are twice as likely as small molecules to be Orphan Drugs, are slightly more likely to be designated FDA priority rather than standard review status, and gain slightly more supplemental indication approvals. Although 9.4% of new small molecules permanently exited the market for a variety of reasons, 7.3% of new biologics exited, but 26% of biologics had black box warnings compared to 20% of small molecules. Both biologics and small molecules take 21-22 quarters from launch to reach $100 million in real revenues. Small molecules have an ini-tially more rapid uptake, but thereafter biologics’ mean revenues tend to be slightly greater than for small molecules. While launch prices for biologics are commonly perceived as being greater than for small molecules, price growth per standard unit is generally greater for small molecules than biologics, with rates of price growth increasing for small molecules in the first five years since launch, and decreasing thereafter. We conclude that the market dynamics of biologics differ substantially from those of small molecules, although therapeutic class composition plays a major role.
KEYWORDS: biologics, small molecules, pharmaceuticals, innovation, price growth
∗This research has been sponsored by Pfizer Inc., whose support we gratefully acknowledge. We also acknowledge with thanks the extensive data support from and discussions with Michael Klein-rock of IMS Health, superb research assistance from Lauren Trusheim, and constructive comments from David Cutler, Alan Garber and Tomas Philipson. Any opinions expressed herein are those of the authors, and do not necessarily reflect the views and judgments of the sponsor or the institu-tions with whom the authors are affiliated.
I.
INTRODUCTION AND BACKGROUND
The biotechnology therapeutic industry is relatively young, tracing its creation to science breakthroughs in the 1970s. Cetus was founded in 1971, Genentech in 1976, and Genzyme in 1981. The first U.S. sales of major recombinant therapeutic—human insulin—occurred in 1982. A decade later in 1992 Amgen became the first biotech Fortune 500 Company, driven by the sales of Epogen (epoietin alfa). A decade later, just after the millennium, the human genome was sequenced leading to an explosion of new companies pursuing novel therapeutic targets. Today, in the midst of an economic crisis, the biotechnology industry is retrenching while simultaneously moving forward hundreds of candidate therapeutic products.
The biotechnology industry has always been a mix of genetic research techniques and the resultant biologic products. Therefore defining the industry is challenging, for the techniques can be used to produce products not thought of as biologic. Biologic products span industrial, agricultural, food processing and healthcare markets. In addition, commercial evolution, particularly over the past decade, has further blurred the biotechnology identity as large biopharmaceutical companies formerly focused entirely on small molecules now develop and market both biologic and small molecule drugs, while small “biotech” companies often use genetic research techniques to create small molecule therapies.
We focus here on biologic human therapeutic products. These medicines are produced by living organisms and then isolated by various separation technologies. Because of their size and complexity, particularly with regard to their folding and chirality-their ‘handedness’, these medicines are not made by chemical synthesis as are small molecules. Sometimes they are made from extracts of animal blood or tissues. Some blood products to enhance clotting for hemophiliacs, or avoid clotting for cardiac patients, are made this way as are some forms of insulin for diabetics. Vaccines are still mostly made by inoculating chicken eggs and then isolating the antigens after a period of time. This is one reason rapidly expanding production for pandemics has proven difficult. In many cases today, however, biologics are made by animal, yeast or bacteria cells that have had a gene, often a human gene, inserted into them. Using that genetic blueprint, the cells then use all their other DNA, RNA and protein producing mechanisms to make the desired product, along with all the other structures, products and wastes that cells create to live. So not only are biologic therapeutics (biologics) themselves larger and more complex than traditional small molecule medicines like aspirin, their production methods are also more complex and subject to natural, biological variation. Finally, many biologics cannot be taken orally because the patient’s digestive track would deconstruct them as a large protein for food. Thus, biologics must often be injected or infused rather than
1 Trusheim et al.: Do Biologics Differ from Small Molecules?
swallowed. As a result, biologics are often administered by health care providers in physician offices or clinics, unlike self-administered tablets and capsules. Moreover, many biologics are covered by a medical rather than pharmaceutical benefit in health insurance plans.
For all these reasons of innate biology, production and dosing approach, biologics often differ from small molecule medicines in their product development, regulatory approval, distribution and commercial paths. Thus while having the same medical goals-to treat disease, small molecule and biologic therapeutics differ substantially in ways that might affect innovation, safety, costs, clinical adoption, patient access and pricing. Biologics are now about a third of the medicines approved. Understanding whether their biological differences translate into commercial and economic differences is therefore important for understanding health care economics, effective innovation incentives and anticipated public health improvements.
Much has been written about the seemingly less formal, more agile biotech industry and about its extensive interfaces among academia and startups. Recently a literature has also developed that compares the costs of developing biologics vs. small molecules. For example, see Berndt, et al. (2009), Calfee and Dupre (2006), and DiMasi and Grabowski (2007). Literature also addresses the time and cost differences across therapeutic classes in bringing new biopharmaceuticals to market. Among articles addressing this issue, see Abrantes-Metz et al. (2005, 2008), Adams and Brantner (2006, 2009), Danzon, et al. (2005), DiMasi et al. (2004), and DiMasi et al. (2003). This literature demonstrates that biologics and small molecules have reasonably similar costs to bring to market, though success rates vary at different development phases.
Within the recent past much attention has also been given to the potential for generic or biosimilar pathways for biologics that could in principle mimic what the Hatch-Waxman 1984 legislation did for small molecules. On this, see, for example, Cacciatore et al. (2008), Grabowski (2008), Grabowski et al. (2006), Grabowski and Kyle (2008), Grabowski et al. (2007), Hollingshead and Jacoby (2009), Kotlikoff (2008), Mishra (2009) and U.S. Federal Trade Commission (2009). With passage of health care reform in 2010, a regulatory pathway for biosimilar products was created, and biologics were granted a twelve year data exclusivity, longer than the five years accorded small molecules.
Over the last year the pace of merger announcements has increased, combining firms with significant biologics and vaccine portfolios with traditional small molecule pharmaceutical companies, such as those between Genentech and Roche, Schering Plough and Merck, and Wyeth and Pfizer. These combinations raise issues concerning possible new directions for traditional pharmaceutical companies. Will these mergers result in the synergies and amplified success their originators expect or will they result in mismatched organizations such as that
2
Forum for Health Economics & Policy, Vol. 13 [2010], Iss. 1, Art. 4
http://www.bepress.com/fhep/13/1/4 DOI: 10.2202/1558-9544.1200
experienced by the integrated financial service companies and life science conglomerates in the late 1990s?
Although we build on these various literatures and industry experiences, our focus here shifts downstream – subsequent to the FDA approving a new therapeutic. At the level of the individual product, the difference between biologic and small molecule drugs remains sharp as scientific characterization, manufacturing process and regulatory reviews have tended to remain substantially distinct. It is at this level of individual products, rather than aggregate organizations, that we focus our attention and examine how the clinical and market experiences differ depending on whether thet therapeutic is a biologic or a small molecule.
We begin our analysis by examining several potential clinical distinctions between biologics and small molecules that may have substantial commercial implications. Are the diseases and conditions for which biologics are approved different from those for small molecules? Is there a sense in which biologics embody more significant medical innovation than do small molecules? Are there differences in safety profiles, and rates of product exit? Since biologics are largely infused or injected, whereas small molecules are most commonly delivered in oral tablet/capsule form – are there differences in physician specialty types who prescribe biologics vs. small molecules?
Having characterized clinical issues such as therapeutic area, innovation, provider and safety differences and similarities among biologics and small molecules, we then go on to consider commercial market issues. Over their product life cycles, do patterns of revenue growth since initial product launch differ? Do small molecule revenues on average grow more rapidly and to greater levels than do biologics? In the late stages of the product life cycle shortly before loss of patent protection, do biologic and small molecule sales revenues and clinical/payer value (as reflected in real price growth) continue to increase, or do they tail off?
We examine these various issues empirically, employing a data base that encompasses all new biologics and small molecules launched in the U.S. from 1998Q1 though the end of 2008Q4 – an 11 year time frame.
The outline of our article is as follows. We begin with a definition of what we consider a biologic vs. a small molecule. We next describe the construction of a unique, complete, curated and annotated data set derived from a wide variety of sources that include all 308 new molecular entities (“NMEs”) launched in the United States over the eleven year period, and then briefly outline statistical methods we employ. Next we present results of analyses concerning similarities and differences in biologic and small molecule product characteristics such as therapeutic area prevalence, along with various measures of innovation and safety. We follow up this more clinical discussion with an examination of
3 Trusheim et al.: Do Biologics Differ from Small Molecules?
comparative commercial experiences, such as real dollar sales, growth and pricing over the product life cycle. We then discuss our findings in a broader context, and suggest issues meriting future research. Finally, we summarize findings and identify limitations of the data and analyses.
II.
DATA SOURCES AND METHODS
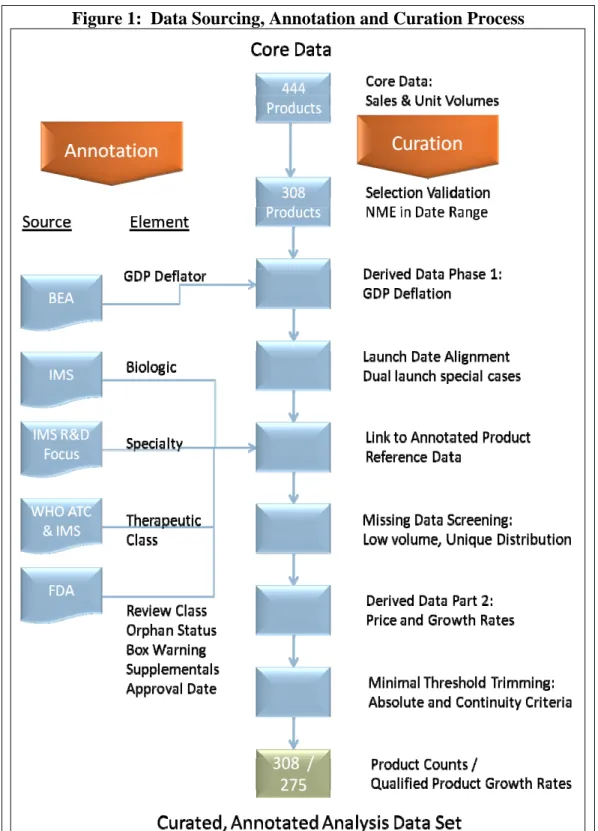
To examine the differences and similarities between biologics and small molecule products we constructed the TABITHA (Trusheim, Aitken, Berndt Innovative Therapeutics Historical Archive) database which includes information from the IMS Health MIDAS database, the FDA, the World Health Organization and the U.S. Bureau of Economic Analysis for all new molecular entity therapeutic products launched in the U.S. from 1998Q1 through 2008Q4.1 The data set was hand curated and subject to multiple cross checking and data integrity checks as described below. Figure 1 illustrates the data sources as well as the data curation and annotation methods we employed.
A. DEFINITION: WHAT IS A BIOLOGIC?
Before describing the data sources and curation steps, we believe it is important to be clear about distinguishing between biologic and small molecule medicines. In the introduction we provided a general sense of what makes biologics unique and how they differ from traditional, small molecule medicines. For the purposes of this paper, we adopt the specific technical biologic definition as developed and implemented by IMS Health in its IMS MIDAS information resource. The definition is intended to yield a set of molecules that are relevant to market analysis. For a molecule to be defined as a biologic, it must possess the following characteristics:
¾ Molecular structure: Specific macromolecules included in the definition are proteins, nucleic acids and carbohydrates. Current conventions can refer to a collection of molecules as a single entity (e.g., antisera). Only if all the components in such a collection are biologic molecules will this collective entity be deemed a biologic.
¾ Molecular identification: Biologic molecules must be clearly identified. Any “molecule” where the molecule name is descriptive and the actual composition of the molecule is not identified (e.g., vegetable extract) is not classified as a biologic.
1
Note that our inclusion and exclusion criteria involve launch date, not FDA approval date. Launch date is determined by identifying the first month in which IMS Health observes sales in the U.S. market.
4
Forum for Health Economics & Policy, Vol. 13 [2010], Iss. 1, Art. 4
http://www.bepress.com/fhep/13/1/4 DOI: 10.2202/1558-9544.1200
¾ Active substance: Biologic molecules must be, or are intended to be, clearly defined active therapeutic ingredients embodied within a product.
¾ Regulatory: Biologic molecules must have undergone (or be undergoing) a regulatory human clinical trial program under the auspices of a national or regional regulatory authority.
Those therapeutics which did not meet these criteria remain classified as small molecule therapeutics.
B. CORE DATA SET: SALES AND UNIT VOLUMES
We extracted U.S. sales and unit volume data for all NMEs and novel biologics launched from 1998-2008, inclusively, from the global IMS MIDAS database. Generic sales and volumes are not included in this data set, since none of the products approved since 1998 experienced loss of patent protection by the end of 2008.
The IMS MIDAS database provides therapeutic product U.S. market sales at the ex-manufacturer level, as well as standard unit volume data. We calculate price as unit value (sales revenues/standard units). Sales revenue values are based on wholesaler invoice data, and therefore include prompt payment discounts and chargebacks, but do not include rebates given to non-providers (non-mail order PBMs, third party payers, HMOs, etc.).
C. PRODUCT SALES AND VOLUME DATA CURATION
The core data set was hand curated for data quality and satisfaction of all selection criteria through a multistage process of selection validation, missing data screening, derived data creation (such as GDP deflated constant dollar transformation and relative launch date alignment), and minimal threshold trimming.
In terms of selection validation, we initially identified 444 named therapeutic products as approved or commercially introduced branded products in the U.S. during, or near the January 1998 – December 2008 time period.
5 Trusheim et al.: Do Biologics Differ from Small Molecules?
Figure 1: Data Sourcing, Annotation and Curation Process
6
Forum for Health Economics & Policy, Vol. 13 [2010], Iss. 1, Art. 4
http://www.bepress.com/fhep/13/1/4 DOI: 10.2202/1558-9544.1200
A product was determined as qualifying for inclusion if it met the following primary criteria:
1. The product was approved by the FDA or had its first full quarter of sales between January 1, 1998 and December 31, 2008;
AND EITHER:
2A. The FDA Center for Drug Evaluation and Research (CDER) classified the product’s Chemical Type as ‘1 New Molecular Entity’ OR the product was a new formulation or packaging form of an NME originally appearing in the qualified period;
OR
2B. The FDA Center for Biologics Evaluation and Research (CBER) approved the product’s original (not supplemental) Biological License Application.
Of those 444 possible new products, upon further examination we identified 110 products as new formulations, new manufacturers of previous products, branded generic introductions, or outside the date range. We removed these 110 products from the analysis.
We then identified 26 products that were formulation or packaging variations by the original manufacturers of the qualified products. Although we do not consider these as new products, their sales and volumes were added to those of the originally qualified product to yield total molecule-specific sales and volume data.
The 308 remaining distinct new products were included in the analysis for purposes of product counts.
Derived Data Creation Part 1: To adjust for general inflation, sales data for each product were transformed using the Bureau of Economic Analysis’ quarterly GDP Price Deflator data, with 2005 as the base year. Monthly GDP deflators were linearly interpolated from quarterly values and were then applied to the monthly sales data.
Relative Launch Date Alignment: The monthly core sales and volume data for each product were aligned on the basis of the first month in which sales and volume were observed for that product. Several products had an initial shortened launch followed by a period of low or zero sales, and then a second sustained launch thereafter. The BiogenIdec product Tysabri is an example of such a product which was launched, halted and re-launched after a monitoring system was instituted for surveillance of a particularly concerning adverse reaction. In such cases, after confirming source data integrity, the initial launch was ignored and the data were aligned to the first month of the second sustained launch. Data were aggregated from monthly to quarterly sales and standard unit volumes. Final quarters with less than three full months of data were truncated from the data set.
7 Trusheim et al.: Do Biologics Differ from Small Molecules?
Missing Data Screening: IMS audits generally cover 99% of the U.S. market, although this varies on very low volume products, and on those with very specific distribution patterns. To avoid inappropriate conclusions, some of these products, particularly products from Genzyme, were excluded from the growth rate and pricing analysis, but were included in analyses based on product counts. In addition, products with approval dates in the period but no recorded sales or intermittent sales or other factors resulting in zero or missing sales were excluded from the growth rate analyses.
Derived Data Creation Part 2 -- Sales, Volume and Pricing Growth Rates: Rolling annual growth rates for sales and standard unit volumes were calculated for each quarter compared to the prior year’s same quarter, to facilitate year-over-year same quarterly growth computations. Therefore the first quarter for growth rate data is the fifth quarter from launch. Prices were calculated for each product by dividing sales by standard unit volumes. Price growth was then calculated using the same methodology as that used for sales and volumes. Some products possessed less than the minimal five quarters of data required to enter the growth rate analysis.
Minimal Threshold Trimming: To avoid misleading results due to erratic quarterly growth rates caused by small or seasonal products, minimal threshold rules were implemented based on absolute levels and data continuity. Several minor products with sales under $50,000 (nominal) per month were deleted from the analysis. In addition, products that exited the US market (sales and volume data ceased prior to 12/31/2008) were examined for clear market cessation. Any sales and volumes after an initial quarterly sales drop of 90% or more were subsequently trimmed from the data set as were those quarters, and subsequent quarters, with sales less than $150,000 (nominal). In addition two seasonal products with alternating quarters of large and zero sales were trimmed from the growth rate and pricing analysis data.
D. ANNOTATION WITH PRODUCT REFERENCE DATA
In addition to the core data set consisting of each product’s sales, volume and price data, each product was further annotated with a broad set of metadata regarding its product form, therapeutic class, specialist or primary care physician status, FDA status, FDA review process and number of supplemental approvals.
Biologic Classification: As discussed above, each product was annotated as being either a biologic or a non-biologic product. For convenience and ease of reading, hereafter we refer to non-biologic products as small molecule products regardless of which FDA office approved them.
ATC assignment: IMS Health assigns each drug to a therapeutic class according to the World Health Organization’s Anatomical Therapeutic Chemical
8
Forum for Health Economics & Policy, Vol. 13 [2010], Iss. 1, Art. 4
http://www.bepress.com/fhep/13/1/4 DOI: 10.2202/1558-9544.1200
classification system (ATC).2 The ATC system allocates drugs into different groups according to the organ or system on which they act and on the basis of their chemical, pharmacological and therapeutic properties.
Drugs are classified in groups at five different successively disaggregated levels. The drugs are divided into main groups (first level), with one pharmacological/therapeutic subgroup (second level). The third and fourth levels are chemical/ pharmacological/ therapeutic subgroups and the fifth level is the chemical substance. The second, third and fourth levels are often used to identify pharmacological subgroups in cases where that is considered more appropriate than therapeutic or chemical subgroups. We annotated each product with its one, two and three digit ATC classification.
Specialist or Primary Care Status: The IMS specialist (SP) driven and primary care (PC) driven therapy class segmentation is an assignment of SP or PC status respectively, based on a review of available data and IMS’ experts’ review of predominant physician type prescribing the drug. Classes where the majority of prescribing and particularly new and changed prescribing is driven by specialists or primary care physicians are assigned to one category or the other. This analysis allows the segmentation of sales data by the type of physician who most routinely makes the key decisions regarding drug prescriptions within the class, regardless of whether physician-specific data is available.
FDA Review Classification: Using FDA website and third party published information, we annotated each product according to whether it underwent a priority or standard review process.
FDA Orphan Status: Each product’s orphan status at the time of its original approval was researched and annotated. If supplemental approvals gained orphan status but the original NDA/BLA did not, for this analysis the product is not considered an orphan drug.
Black Box Warning Status: Using information originally provided on the FDA website as a single table regarding black box warning actions, and after confirming this action via sampling of our data set, we determined whether over the life of each product a black box warning status was ever indicated.
sNDA and sBLA History: Using the IMS Lifecycle R&D Focus, we identified the number and timing of supplemental approvals for each product. IMS Lifecycle R&D Focus is a database of all active pipeline products, including follow-on indications of marketed products. Our analysis was based on the dates of U.S. approvals of follow-on indications for the products in the core data set.
2
See WHO Collaborating Centre for Drug Statistics Methodology. About the ATC/DDD system. Available online at http://www.whocc.no/atcddd/.
9 Trusheim et al.: Do Biologics Differ from Small Molecules?
E. OTHER DATA
Aggregate product pipeline data was obtained from the IMS Lifecycle R&D Focus database.
F. STATISTICAL METHODS
Because we observe the population universe of newly launched products, rather than a random sample drawn from the population universe, we do not carry out traditional statistical inference tests. However, we compute a variety of population means and standard deviations. Our computations were carried out in Microsoft Excel, from Office 2002.
Our commercial analyses focus on sales and price growth rather than on absolute prices. We calculate such growth rates for each individual product prior to computing population statistics to obtain important data quality advantages. Pricing per unit varies substantially among the therapeutic classes, making comparisons across classes difficult. Dosing approach such as oral, intravenous infusion, subcutaneous injection and inhalation also vary widely, making comparisons of standard units and unit prices difficult across formulations. A tableted oral drug taken four times a day carries a dramatically different price per dose than a monthly injection even if the price per patient treatment year is identical. Moreover, the price per patient treatment year varies among medicines. In addition, distribution channels and their pricing transparency vary dramatically. Injectable drugs and oral drugs are often covered under different medical benefit plan sections with differing patient co-pays, provider incentives and distribution margins, thereby affecting pricing and demand. In addition, the transparency of the different channels for injectables, vaccines, infusions and oral drugs differ. For instance, oral drugs often carry rebates which are not reported to the IMS Health database. Injectables, particularly those for oncology or which are hospital-administered, are often obtained at a discount by providers who are then reimbursed at the higher Average Wholesale Price or Average Sales Price. While now undergoing more restrictions, such “Buy and Bill” practices were prevalent during the examined period. Calculating sales growth and price growth for each product separately self-corrects for reporting biases among these various dosing, distribution and reimbursement regimens. For this reason we emphasize growth rates rather than absolute measures. We emphasize average growth rates where the growth rates themselves are averages of individual product growth rates rather than a sum of product sales divided by the count of products. While this corrects for the biases discussed, it also has the effect of not weighting products by their relative sales-a small product carries as much importance as a large product. Thus, the reader is cautioned on interpreting the results average growth rate results.
10
Forum for Health Economics & Policy, Vol. 13 [2010], Iss. 1, Art. 4
http://www.bepress.com/fhep/13/1/4 DOI: 10.2202/1558-9544.1200
III.
RESULTS
A. NUMBER AND COMPOSITION OF NEW PRODUCT LAUNCHES
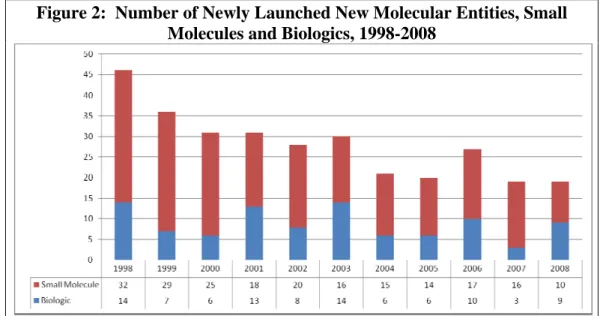
Over the 1998-2008 time frame, a total of 308 new biopharmaceuticals were launched in the U.S. market, averaging 28 per year over the eleven-year time period. Of these, 212 (69%) were small molecules, and 96 (31%) were biologics. As shown in Figure 2 and as discussed by numerous others, (See, for example, Berndt et al., 2006 and U.S. Food and Drug Administration, 2004). There is a clear downward trend in the number of new biopharmaceuticals launched annually.
Figure 2: Number of Newly Launched New Molecular Entities, Small Molecules and Biologics, 1998-2008
Table 1 shows that between 1998 and 2003 the mean number of launches averaged just under 34 per year, and then fell to an average of about 21 annually between 2004 and 2008—a decline of about 37%. Although the biologics share of total launches varies considerably across years, over multi-year periods it has remained remarkably stable – 31% between 1998 and 2003, and 32% from 2004 through 2008. The biologics share was highest in 2008 – 47% (9 of 19 new approvals), the final year in our investigation.
11 Trusheim et al.: Do Biologics Differ from Small Molecules?
Table 1: Mean Number of Newly Launched New Molecular Entities, Small Molecules and Biologics, 1998-2003, 2004-2008
Over the entire eleven year period, as shown in Table 2, the largest number of new products were launched in the anti-infectives for systemic use therapeutic class (n=61), antineoplastic and immunomodulating agents (49), alimentary tract and metabolism (42), and central nervous system (37) classes; together these four therapeutic classes accounted for 189 of the 308 (61%) new product launches.
Table 2: Therapeutic Class Composition of Biopharmaceutical Innovations: Biologics and Small Molecules
Newly launched biologics have tended, however, to be more concentrated in select therapeutic classes than have small molecules. Table 2 indicates there are four therapeutic classes in which ten or more new biologics have been launched: anti-infectives for systemic use (n=23), antineoplastic and immunomodulating agents (n=21), alimentary tract and metabolism (n=16) and blood and blood forming organs (n=16). In comparison, ten or more new small molecules have been launched in nine of the 15 therapeutic classes. While new
Percentage 98-03 04-08 98-03 04-08 Total Biologic 10.3 6.8 31% 32% 31% Small Molecule 23.3 14.4 69% 68% 69% Total 33.7 21.2 Mean
ATC Classification Biologic Small Molecule Total
A: Alimentary Tract and Metabolism 16 26 42
B: Blood and blood forming organs 16 6 22
C: Cardiovascular System 1 20 21
D: Dermatologicals 3 5 8
G: Genito-Urinary Systems and Sex Hormones 13 13 H: Systemic Hormonal Preparations, Excl. Sex Hormones And Insulins 7 7 J: Anti-Infectives For Systemic Use 23 38 61
K: Intravenous Solutions 1 1
L: Antineoplastic And Immunomodulating Agents 21 28 49
M: Musculo-Skeletal System 4 6 10 N: Nervous System 1 36 37 P: Antiparasitic Products 1 1 R: Respiratory System 1 11 12 S: Sensory Organs 2 10 12 V: Various 1 11 12 Total 96 212 308 12
Forum for Health Economics & Policy, Vol. 13 [2010], Iss. 1, Art. 4
http://www.bepress.com/fhep/13/1/4 DOI: 10.2202/1558-9544.1200
small molecule launches occurred in 14 of 15 therapeutic classes (only systemic hormonal preparations had no new small molecule product launches), no new biologics were launched in three classes – genito-urinary systems and sex hormones, intravenous solutions and antiparasitic products.
The biologics share of new biopharmaceutical products is highest in the blood and blood forming organs class at 73% (16 of 22), but is also substantial in oncology at 43% (antineoplastic and immunomodulating agents, 21/49). By contrast, small molecules strongly dominate among central nervous system new product launches (36/37), cardiovascular (20/21), genito-urinary systems and sex hormones (13/13), respiratory system (11/12) and the “various other” class (11/12).
Table 3 documents that biologics are more concentrated than small molecules. The concentration of new biologics in their top four therapeutic classes is substantial, accounting for almost 80% of the new biologic launches (76 of the 96 biologics). By contrast the top four small molecule therapeutic classes contain only 60% of the new small molecule NMEs.
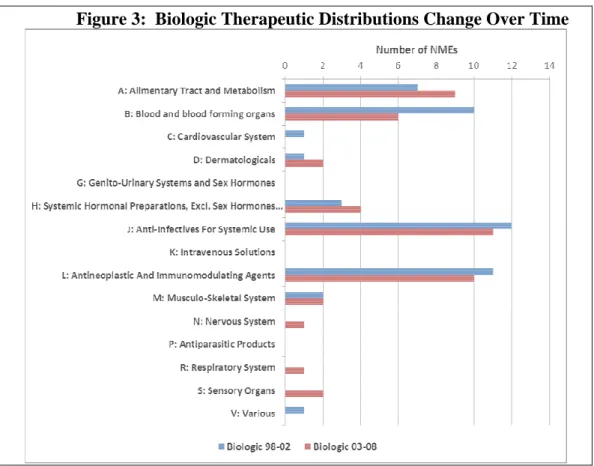
Nonetheless, the fact that new biologics have been introduced in a wide variety of therapeutic classes reflects the breadth of their clinical applicability and suggests that the future composition of new biologics might diffuse more generally, differing considerably from that observed historically. In this context, in Figure 3 divides the data set into two periods, 1998-2002 and 2003-2008. In the latter period biologics are present in three additional therapeutic areas (nervous system, respiratory system and sensory organs) while losing presence in the cardiovascular system therapeutic area. Over the period the top four therapeutic area biologics concentration falls from 83% to 75%. We comment briefly on pipeline composition later on in this article.
13 Trusheim et al.: Do Biologics Differ from Small Molecules?
Table 3: Therapeutic Class Concentration of Biopharmaceutical Innovations: Biologics and Small Molecules
Biologic Rank Ordered Therapeutic Classes Small Molecule Rank Ordered Therapeutic Classes
ATC Classification Biologic Cumulative Percent ATC Classification Small Molecule Cumulative Percen J: Anti-Infectives For Systemic
Use 23 24%
J: Anti-Infectives For Systemic
Use 38 18%
L: Antineoplastic And
Immunomodulating Agents 21 46% N: Nervous System 36 35% A: Alimentary Tract and
Metabolism 16 63%
L: Antineoplastic And
Immunomodulating Agents 28 48% B: Blood and blood forming
organs 16 79%
A: Alimentary Tract and
Metabolism 26 60%
H: Systemic Hormonal Preparations, Excl. Sex
Hormones And Insulins 7 86% C: Cardiovascular System 20 70% M: Musculo-Skeletal System 4 91%
G: Genito-Urinary Systems
and Sex Hormones 13 76% D: Dermatologicals 3 94% R: Respiratory System 11 81%
S: Sensory Organs 2 96% V: Various 11 86%
C: Cardiovascular System 1 97% S: Sensory Organs 10 91% N: Nervous System 1 98%
B: Blood and blood forming
organs 6 94%
R: Respiratory System 1 99% M: Musculo-Skeletal System 6 97%
V: Various 1 100% D: Dermatologicals 5 99%
G: Genito-Urinary Systems
and Sex Hormones 100% K: Intravenous Solutions 1 100% K: Intravenous Solutions 100% P: Antiparasitic Products 1 100%
P: Antiparasitic Products 100%
H: Systemic Hormonal Preparations, Excl. Sex
Hormones And Insulins 100%
Total 96 Total 212
14
Forum for Health Economics & Policy, Vol. 13 [2010], Iss. 1, Art. 4
http://www.bepress.com/fhep/13/1/4 DOI: 10.2202/1558-9544.1200
Figure 3: Biologic Therapeutic Distributions Change Over Time
We now digress briefly to examine in greater detail the four therapeutic classes in which the most new biologics have been launched. As seen in Figure 4, among the infectious disease class, while new antibacterials and antimycotics (antifungals) are entirely small molecules (as historically have been all the penicillins), the antivirals (including AIDs medicines) are a mix of biologics and small molecules. By contrast, the various immune sera and immunoglobulins (circulating antibodies) and prophylactic vaccines have no small molecule analogs, and are therefore entirely comprised of new biologics. Note that over the 1998-2008 timeframe, 14 new vaccines were launched.
15 Trusheim et al.: Do Biologics Differ from Small Molecules?
Figure 4: Product Distribution Within ATC J, Infectious Disease Acronym Key J01 Antibacterials for Systemic Use J02 Antimycotics J05 Antivirals J06 Immune Sera and Immunoglobulins J07 Vaccines
Figure 5 decomposes the various cancer-related new products into three subcategories. Among the antineoplastic and endocrine therapy agents, there have been both substantial new biologics (12/38) and new small molecules (26/38), reflecting the fact that different mechanisms have been pursued to disrupt binding at receptor sites; notably, among the new small molecules is Novartis’ Gleevec (imatinib mesylate) tablet, one of the “poster children” of the new “personalized medicines”. For a discussion of targeted, personalized or what we have called stratified medicines, see Calfee and DuPre (2006), and Trusheim, et al. (2007). All three new immunostimulants are biologics, as are six of the eight new immunosuppressive agents.
0 5 10 15 20 25 J01 J02 J05 J06 J07 Product Distribution in ATC J Infectious Disease Small Molecule Biologic 16
Forum for Health Economics & Policy, Vol. 13 [2010], Iss. 1, Art. 4
http://www.bepress.com/fhep/13/1/4 DOI: 10.2202/1558-9544.1200
Figure 5: Product Distribution Within ATC L, Oncology
Acronym Key
L01, L02 Antineoplastic Agents and Endocrine Therapy L03 Immunostimulants
L04 Immunosuppressive Agents
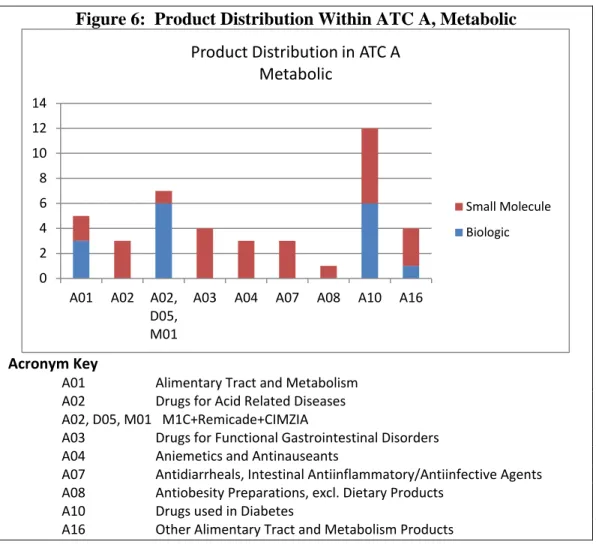
The digestive and metabolic therapeutic class (alimentary tract and metabolism) includes a wide variety of conditions, as shown in Figure 6. Among new products used in treating diabetes, six are biologics and six are small molecules. A fascinating set of biologics are the monoclonal antibodies which modulate inflammation. These biologics can manifest their effects in seemingly disparate conditions, see Reichert (2005) and Reichert and Paquette (2003). Centocor’s Remicade (infliximab), for example, while originally approved for rheumatoid arthritis, is now also approved for Crohn’s disease (a gastrointestinal condition), ankylosing spondylitis (a spine and joint illness often also affecting the eyes and heart, and co-occuring with inflammatory bowel disease),3 psoriatic arthritis, plaque psoriasis, and ulcerative colitis.4 Other monoclonal antibody biologics with a diverse set of FDA indication approvals include Abbott’s Humira (adalimumab) and Amgen’s Enbrel (etanercept).5 It is worth emphasizing here that although supplementary indication approvals granted by the FDA can constitute very important and significant innovations, because these FDA approvals are typically granted subsequent to the initial new Biologics License Application or New Drug Application approval, they are typically not counted as
3
See “ankylosing spondylitis” in Anderson, Anderson and Glanze [1998], pp. 94-95.
4
See “Remicade” in Physicians’ Desk Reference [2009], p. 954.
5
See “Etanercept” and “Adalimumab” in Drug Facts and Comparisons [2008], pp. 2453-2461. 0 10 20 30 40 L01, L02 L03 L04 Product Distribution in ATC L Oncolo Small Molecule Biologic 17 Trusheim et al.: Do Biologics Differ from Small Molecules?
“new products” when tallying up the number of new product approvals or launches annually.6 For discussion of review time to initial NME FDA approval relative to review time from sNDA/sBLA application to supplemental approval, see Berndt et al. (2006), Gosse and Nelson (1997), and Gosse et al. (1996). We comment on supplementary indications for biologics in further detail below.
Figure 6: Product Distribution Within ATC A, Metabolic
Acronym Key A01 Alimentary Tract and Metabolism A02 Drugs for Acid Related Diseases A02, D05, M01 M1C+Remicade+CIMZIA A03 Drugs for Functional Gastrointestinal Disorders A04 Aniemetics and Antinauseants A07 Antidiarrheals, Intestinal Antiinflammatory/Antiinfective Agents A08 Antiobesity Preparations, excl. Dietary Products A10 Drugs used in Diabetes A16 Other Alimentary Tract and Metabolism Products
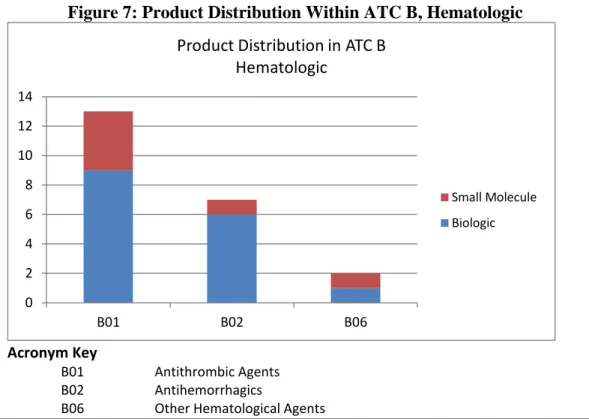
The fourth largest number of new biologics is found in the hematologic (blood and blood forming organs) class; this is the only class in which new biologics dominate small molecules (16 of 22). As seen in Figure 7, of the 13 antithrombic (anticlotting) agents, nine are biologics, and four are small molecules. Although smaller in absolute numbers, biologics also comprise the
6
In some cases the number of patients affected by a supplementary approval is considerably larger than those benefiting from the original indication. For examples and further discussion, see Berndt et al. (2006). 0 2 4 6 8 10 12 14
A01 A02 A02, D05, M01
A03 A04 A07 A08 A10 A16
Product Distribution in ATC A Metabolic
Small Molecule Biologic
18
Forum for Health Economics & Policy, Vol. 13 [2010], Iss. 1, Art. 4
http://www.bepress.com/fhep/13/1/4 DOI: 10.2202/1558-9544.1200
predominant share of new antihemorrhagics (six of seven) – products used to treat hemophilia and other blood loss conditions. The “other hematological agents” subcategory includes second generation erythropoietin (“epo”) products, such as Amgen’s Aranesp (darbepoietin alfa) used for treatment of anemia.
Before leaving this section and moving on to discuss the significance of innovation embodied in new biopharmaceuticals, we comment on relative delays following FDA approval but before launch of the new product and the initial recording of sales revenues. There are several sources of launch delays that can occur following FDA new product approval. First, quite frequently there is considerable discussion between the FDA and the new biopharmaceutical sponsor involving the precise wording that will appear on the product label (also frequently called the product insert).
Figure 7: Product Distribution Within ATC B, Hematologic
Acronym Key
B01 Antithrombic Agents B02 Antihemorrhagics
B06 Other Hematological Agents
Second, occasionally companies experience manufacturing difficulties and delays in scaling up their production from clinical to commercial levels. Since manufacturing complexities are generally thought to be more common among biologics than small molecules, one might conjecture that delays between FDA approval and actual product launch are likely to be greater for biologics. Finally, sponsoring companies may need to prepare marketing materials and train sales representatives for the new product launch, and since date of FDA approval is
0 2 4 6 8 10 12 14 B01 B02 B06 Product Distribution in ATC B Hematologic Small Molecule Biologic 19 Trusheim et al.: Do Biologics Differ from Small Molecules?
uncertain, training sales representatives with material containing approved labeling may delay the launch date. We quantify the launch delay as the number of days between FDA product approval and the date at which new product sales revenues are first observed by IMS Health’s shipment invoicing data.7
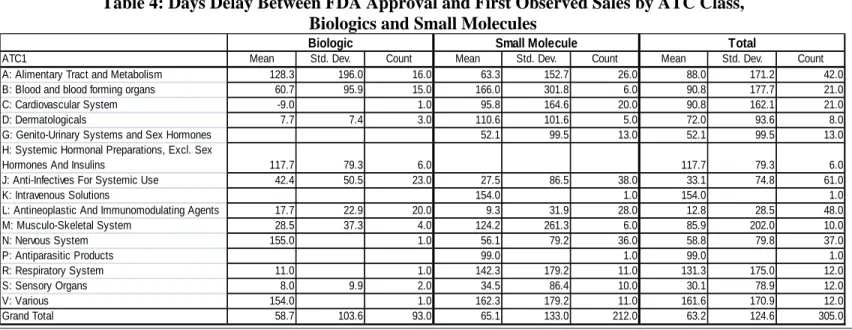
Table 4 presents average days delay between FDA approval and first observed sales, by therapeutic class, separately for biologics and for small molecules, and then for all new biopharmaceuticals. As seen in the bottom row of Table 4, mean days delay for biologics is 58.7, about a week less than the 65.1 mean delay for small molecules. Given the very large standard deviations (above 100), this one week difference is not significant. These apparent similarities in days delay between biologics and small molecules mask, however, very large difference within certain therapeutic classes. In class A (alimentary tract and metabolism), for example, the average delay for biologics is about four months (128 days), twice that for small molecules (63 days); in class B (blood and blood forming agents), however, the reverse occurs – for biologics the mean delay is 61 days, less than half that for small molecules (166 days). This striking heterogeneity is also observed in other therapeutic classes. Given the small number of products in each class, the means are often driven by a lengthy delay by one or two products in the class. This is reflected in the very large standard deviations in these classes which make the apparent mean differences statistically insignificant. An understanding of whether the hypothesized causes for delay occurred, to what extent and in which classes is not suggested by this data and would require individual investigations of specific cases, which is beyond the scope of this article. The data do, however, clearly indicate that a wide range of delays occurs with 56% (172) having a mean delay of a month or less and 13 having a mean delay of more than one year.
7
When a new product’s sales revenues are first observed by IMS Health, we set the date to the 15th of that month. As a result, it is possible for a launch delay to be negative (if, for example, the product received FDA approval after the 15th of that month, and sales were observed by IMS Health during that month).
20
Forum for Health Economics & Policy, Vol. 13 [2010], Iss. 1, Art. 4
http://www.bepress.com/fhep/13/1/4 DOI: 10.2202/1558-9544.1200
Table 4: Days Delay Between FDA Approval and First Observed Sales by ATC Class, Biologics and Small Molecules
ATC1 Mean Std. Dev. Count Mean Std. Dev. Count Mean Std. Dev. Count A: Alimentary Tract and Metabolism 128.3 196.0 16.0 63.3 152.7 26.0 88.0 171.2 42.0 B: Blood and blood forming organs 60.7 95.9 15.0 166.0 301.8 6.0 90.8 177.7 21.0 C: Cardiovascular System -9.0 1.0 95.8 164.6 20.0 90.8 162.1 21.0 D: Dermatologicals 7.7 7.4 3.0 110.6 101.6 5.0 72.0 93.6 8.0 G: Genito-Urinary Systems and Sex Hormones 52.1 99.5 13.0 52.1 99.5 13.0 H: Systemic Hormonal Preparations, Excl. Sex
Hormones And Insulins 117.7 79.3 6.0 117.7 79.3 6.0
J: Anti-Infectives For Systemic Use 42.4 50.5 23.0 27.5 86.5 38.0 33.1 74.8 61.0
K: Intravenous Solutions 154.0 1.0 154.0 1.0
L: Antineoplastic And Immunomodulating Agents 17.7 22.9 20.0 9.3 31.9 28.0 12.8 28.5 48.0 M: Musculo-Skeletal System 28.5 37.3 4.0 124.2 261.3 6.0 85.9 202.0 10.0 N: Nervous System 155.0 1.0 56.1 79.2 36.0 58.8 79.8 37.0 P: Antiparasitic Products 99.0 1.0 99.0 1.0 R: Respiratory System 11.0 1.0 142.3 179.2 11.0 131.3 175.0 12.0 S: Sensory Organs 8.0 9.9 2.0 34.5 86.4 10.0 30.1 78.9 12.0 V: Various 154.0 1.0 162.3 179.2 11.0 161.6 170.9 12.0 Grand Total 58.7 103.6 93.0 65.1 133.0 212.0 63.2 124.6 305.0
Biologic Small Molecule Total
21 Trusheim et al.: Do Biologics Differ from Small Molecules?
B. INNOVATION: NDAs, BLAs AND SUPPLEMENTAL APPROVALS
It is difficult if not impossible to quantify reliably, objectively and unambiguously the extent to which new biopharmaceuticals embody significant innovation and address unmet medical needs. With that caveat in mind, we nevertheless examine three metrics that provide some information on the significance of the biopharmaceutical innovation, and then compare new biologics and small molecules on these metrics.
In 1983 the U.S. Congress passed the Orphan Drug Act P. L. 97-414 that provides market exclusivity, protocol assistance and grant funding in connection with the development of drugs for rare diseases and conditions. The original definition of “rare disease or condition” in the Orphan Drug Act was amended in October 1984 by P.L. 98-551 to add a specific numeric prevalence threshold to the condition: “…the term rare disease or condition means any disease or condition which (a) affects less than 200,000 persons in the U.S. but for which there is no reasonable expectation that the cost of developing and making available in the U.S. a drug for such disease or condition will be recovered from sales in the U.S. of such drug.” U.S. Food and Drug Administration (2009a). A sponsor may apply for Orphan Drug designation along with its Biologics License Application (“BLA”) or its New Drug Application (“NDA”), but it can also apply for Orphan Drug designation as part of a supplementary BLA or NDA for a previously approved biopharmaceutical.
As seen in Table 5, a non-trivial portion, 17% (51 of 308) of all newly approved biologics and small molecules between 1998 and 2008 were designated as Orphan Drugs at the time of initial approval.8 Interestingly, the portion of new biologics receiving Orphan Drug designation (24%, 23 of 96) was almost twice as large as that for small molecules (13%, 28 of 212). That one of about every eight newly approved small molecules treats a rare condition is a testimony to the beneficial and powerful incentives provided by the Orphan Drug legislation. That this proportion is almost twice as large at 24% for biologics is surprising and remarkable.
A second indicator of the potential significance of the innovation embodied in a new biopharmaceutical is the review status assigned to the NDA or BLA by the FDA at the time the application is submitted by the sponsor. In 1992, under the Prescription Drug User Fee Act (“PDUFA”) legislation, Congress and the FDA agreed on a two-tier system of review times -- standard review and
8
We also observe that numerous biologics and small molecules received Orphan Drug designation on the supplementary BLA or supplementary NDA applications. We are unaware of any studies that have examined and quantified the extent to which, and timing of, Orphan Drug designation through the product life cycle of a small molecule or biologic.
22
Forum for Health Economics & Policy, Vol. 13 [2010], Iss. 1, Art. 4
http://www.bepress.com/fhep/13/1/4 DOI: 10.2202/1558-9544.1200
priority review. Standard review is applied to a drug that offers at most, only minor improvement over existing marketed therapies. The 2002 amendments to PDUFA set a goal that a standard review of an NDA/BLA application be accomplished within a ten-month time frame. A priority review designation is given to drugs that offer major advances in treatment, or provide a treatment where no adequate therapy exists. Under the 2002 amendments to PDUFA, the goal for the FDA completing a priority review is six months, U.S. Food and Drug Administration (2009b). A substantial portion, but not all Orphan Drug designations are also given priority review status.
Table 5: Orphan, Priority and Supplemental Reviews
In the middle panel of Table 5 we tabulate review status, separately for biologics and small molecules, and in total. Altogether, 40% (124/308) of new product approvals between 1998 and 2008 were granted priority review status.9 The difference between biologics and small molecules in priority review status also occurs, but is much smaller than for the Orphan Drug designation.
9
For an earlier examination of whether priority review rates drugs were approved more quickly by the FDA, see Dranove and Meltzer (1994).
Biologic Small Molecule Grand Total Orphan Number 23 28 51 Percentage 24% 13% 17% Priority Review Number 42 82 124 Percentage 44% 39% 40%
Priority Review Adjusted for Vaccines & Insulins
Number 40 82 124
Percentage 49% 39% 40%
Mean Supplementals 0.75 0.66 0.69
Total Therapeutics 96 212 308
Total Therapeutics Adjusted for Vaccines & Insulins
82 212 308
23 Trusheim et al.: Do Biologics Differ from Small Molecules?
Specifically, while 44% of biologics were given priority review status, a very respectable 39% of approved small molecule applications were assigned priority review.
Biologics include many novel therapeutics, but they also include insulin products and vaccines which rarely receive priority reviews. In the bottom of the middle panel we remove these biologic classes and recalculate the priority review percentages. Fourteen products are removed, only two of which (both vaccines) received priority review. This raises the percentage of biologics receiving priority review to nearly half (40 of 82, or 49%).
A final metric involving quantification of innovation involves the extent to which biologics and small molecules secured supplemental indication approvals. Above we noted that particularly for some of the biologic monoclonal antibodies, the range of disease/condition approvals eventually received by the sponsor has been remarkably large.
In the bottom panel of Table 5 we tabulate the mean number of supplemental approvals obtained by newly approved biopharmaceutical products between 1998 and 2008. Over all new products, the mean number of supplemental approvals is 0.69; for biologics, however, this average at 0.75 is slightly greater than that for small molecules at 0.66.10
As shown in Table 6, when examined by therapeutic area, the gap between biologics and small molecules is particularly large among the alimentary tract and metabolism agents, where the mean number of supplemental approvals over 16 biologics is 1.31, about twice the 0.62 for the 26 small molecules. Similarly, for the blood and blood forming organs class, the mean number of supplemental approvals for the 16 biologics was 0.88, more than twice the 0.33 for the six small molecules. On the other hand, among the anti-infectives for systemic use, on average the 38 small molecules had 0.61 supplementary approvals, substantially more than the 0.35 for biologics. This last disparity may be accounted for by the fact that the biologics focus on HIV treatment whereas the small molecules contain a substantial number of general antibiotics and antifungals, thereby having greater inherent ability to secure multiple indications.
In summary, on the basis of three distinct indicators of embodied innovation – Orphan Drug designation, priority review status and mean number of supplemental approvals, biologics rank higher than small molecules, although only in the case of Orphan Drug designation is this superiority ranking substantial.
10
Initially this mean number of supplemental indications appeared unreasonably small. However, a manual check of the R&D Focus data base entries for several biologics and comparison with FDA Orange Book approval data revealed no undercounting. We intend to examine supplemental approvals more deeply in subsequent research.
24
Forum for Health Economics & Policy, Vol. 13 [2010], Iss. 1, Art. 4
http://www.bepress.com/fhep/13/1/4 DOI: 10.2202/1558-9544.1200
Table 6: Supplemental NDAs by ATC Class
ATC1 Mean Std. Dev Mean Std. Dev Mean Std. Dev
A: Alimentary Tract and Metabolism 1.31 1.30 0.62 0.85 0.88 1.09
B: Blood and blood forming organs 0.88 0.81 0.33 0.52 0.73 0.77
C: Cardiovascular System 1.00 0.90 0.55 0.90 0.54
D: Dermatologicals 0.67 0.58 0.60 0.55 0.63 0.52
G: Genito-Urinary Systems and Sex Hormones 0.62 0.65 0.62 0.65
H: Systemic Hormonal Preparations, Excl. Sex
Hormones And Insulins 0.29 0.49 0.29 0.49
J: Anti-Infectives For Systemic Use 0.35 0.78 0.61 0.59 0.51 0.67
K: Intravenous Solutions 0.00 0.00
L: Antineoplastic And Immunomodulating Agents 0.86 1.24 0.79 0.69 0.82 0.95
M: Musculo-Skeletal System 0.50 0.58 0.67 0.52 0.60 0.52 N: Nervous System 1.00 0.72 1.09 0.73 1.07 P: Antiparasitic Products 1.00 1.00 R: Respiratory System 1.00 0.73 0.65 0.75 0.62 S: Sensory Organs 1.00 0.00 0.30 0.48 0.42 0.51 V: Various 0.00 0.45 0.52 0.42 0.51 Grand Total 0.75 0.99 0.66 0.73 0.69 0.82
Biologic Small Molecule Total
25 Trusheim et al.: Do Biologics Differ from Small Molecules?
C. SAFETY ASPECTS
Whether biologics or small molecules have differing safety track records is not obvious a priori. One metric commonly employed by observers is the extent to which approved products are assigned black box warnings by the FDA, the most stringent warning the FDA can give without entirely removing the product from the marketplace.
In Table 7 we tabulate rates at which newly approved biologics and small molecules have been required to place black box warnings on their product labeling by the FDA. As is seen there, over all new biopharmaceuticals, 22% (67 of 308) have placed black box warnings on their label. Moreover, at 26% (25/96) this proportion is slightly greater for biologics than for small molecules at 20% (42/212). As noted above, biologics are concentrated in fewer therapeutic areas than are small molecules. To adjust partially for therapeutic area biases, we also tabulated the black box warning rates for the top four biologic therapeutic areas. The biologics rate falls to 25% (19/76) while the small molecule rate remains relatively stable at 19% (19/98). Again, the proportion of biologics remains slightly greater than that for small molecules.
Table 7: Safety: Black Box Warning Experience
A different safety-related metric involves calculating the proportion of new biopharmaceuticals that subsequently permanently exited the market. The exit could be for safety reasons, as was the case for small molecules Bextra and Vioxx and for the biologic vaccine Rotashield, or for related commercial reasons, as was the case for GlaxoSmithKline’s lyme disease vaccine, LymeRx, On this, see Berndt, Denoncourt and Warner (2009). Since reasons for product exit may be difficult to determine in an objective and replicable manner, we simply
All Products
Biologic Small Molecule Total
Number 25 42 67
Percent 30% 20% 22%
Top Four Biologics Areas (A, B, J, L)
Biologic Small Molecule Total
Number of Warnings 19 19 38
Total Products 76 98 174
Percent 25% 19% 22%
26
Forum for Health Economics & Policy, Vol. 13 [2010], Iss. 1, Art. 4
http://www.bepress.com/fhep/13/1/4 DOI: 10.2202/1558-9544.1200
compute the proportion of newly approved products that eventually permanently exited the marketplace, where exit was determined by the IMS Health’s data reporting that product sales revenues, while non-zero earlier, were zero in the final months of 2008.
As seen in Table 8, over all newly approved biopharmaceuticals between 1998 and 2008, 8.8% (27/308) had exited the market by the end of 2008. Moreover, at 9.4% (20/212) this proportion is slightly greater for small molecules than the 7.3% (7/96) for biologics. Notably, among vaccines this attrition rate was particularly high; of the fourteen vaccines approved between 1998 and 2008, three (Certiva, LymeRx and Rotashield, or 21.4%) eventually exited the market. Excluding the 14 vaccines from all biologics leaves only 4.9% of non-vaccine biologics (4/82) exiting the market permanently.
Table 8: Product Exits
A related safety aspect involves the characteristics of the physician prescribing the new product. A plausible hypothesis is that biologics are more complex new medications, whose administration by injection or infusion is more likely to be carried out at least initially by specialist (“SPs”) rather than primary care (“PC”) physicians.11 However, since vaccines are biologics and are largely prescribed by PCs, the extent to which biologics are disproportionately prescribed by SPs is unclear.
Based on global data, IMS Health classifies physician prescriber type at a very detailed Anatomical Therapeutic Classification basis. As seen in Table 9, over all new biopharmaceuticals, 46% of newly approved products are prescribed predominantly by primary care physicians, while 54% are prescribed predominantly by specialists. There is, however, a substantial difference in PC/SP prescribing shares between small molecules and biologics. While PCs predominantly prescribe 53% of the newly approved small molecules, they are the predominant prescribers of only 32% of the newly launched biologics. We further observe in the detailed data in the lower panel of the Table 9 that among biologics, the disproportionate SP share is falling slightly, from an average of 69% 1998-2003 to 65% in 2004-2008. Interestingly, among small molecules the SP trend is reversed. Specifically, the SP share of predominantly prescribed new small molecules is increasing, from 46% 1998-2003 to 49% 2004-2008.
11
For related discussion and some recent evidence, see Aitken et al. (2008).
Biologic
Small Molecule Total
Number
7
20
27
Percent
7.3%
9.4%
8.8%
27 Trusheim et al.: Do Biologics Differ from Small Molecules?
D. PRODUCT COMMERCIAL EXPERIENCE ANALYSIS
We now shift to examine the similarities and differences among biologics and small molecules during their launch phase and subsequent commercial periods over their product life cycles. We have sales, volume and derived price (sales / volume) data from products newly launched between 1998 and 2008. Rather than take a calendar year perspective we aligned each product’s data according to its relative time from the quarter of its first observed U.S. revenues. For those products first sold in the first quarter of 1998, we have up to 44 quarters of sales revenue data, whereas for those newly approved in 2008, we have at most four quarters of sales revenue data. Note that no product first launched in the U.S. during or after 1998Q1 had lost patent protection by the end of our maximum eleven-year time period, 2008Q4, and therefore there are no generic products in this product life cycle analysis.
As Figure 8 illustrates, the time series nature of the launches displays itself as a monotonically declining number of products in each period as one moves away from the launch date. We have 299 initial product observations for sales revenue in the first quarter (Quarter 1), 185 in Quarter 20 and 38 in Quarter 40. In Quarter 33 the number of biologic products with data falls below 20. Due to this small number of products, we restrict the following analysis to the periods from Quarter 1 through Quarter 32.
E. PRICING OVER THE PRODUCT LIFE CYCLE
We now turn to consider several of the economic characteristics potentially differentiating biologics from small molecules. The conventional wisdom regarding pricing of biologics vs. small molecules typically focuses on very high launch price levels for biologics, particularly those focused on treatment for cancer, although Gleevec, a small molecule, costs over $25,000 per treatment episode, see Aitken et al. (2008). It is challenging to compare price levels between biologics and small molecules – treatment episodes differ in length, and comparison of treatment costs for episodic vs. chronic conditions is problematic. Instead of level, we focus on the price growth rate for the same molecule over time. After launching at an initial price, do prices of biologics increase less or more rapidly than prices of small molecules?
28
Forum for Health Economics & Policy, Vol. 13 [2010], Iss. 1, Art. 4
http://www.bepress.com/fhep/13/1/4 DOI: 10.2202/1558-9544.1200
Table 9: Specialist and Primary Care Predominant Prescriber
Product
Type Specialty or Primary Care 98-03 04-08 Biologic Primary Care Driven ATCs 31% 35%
Specialist Driven ATCs 69% 65%
Biologic
Total 14 7
Small
Molecule Primary Care Driven ATCs 54% 51%
Specialist Driven ATCs 46% 49%
Small Molecule Total 32 29
Grand
Total 46 36
Product
Type Specialty or Primary Care 1998 1999 2000 2001 2002 2003 2004 2005 2006 2007 2008
Grand Total
Biologic Primary Care Driven ATCs 3 2 3 6 3 2 1 3 4 4 31
Specialist Driven ATCs 11 5 3 7 5 12 5 3 6 3 5 65
Biologic
Total 14 7 6 13 8 14 6 6 10 3 9 96
Small
Molecule Primary Care Driven ATCs 18 18 7 11 13 8 8 5 9 8 7 112
Specialist Driven ATCs 14 11 18 7 7 8 7 9 8 8 3 100
Small Molecule Total 32 29 25 18 20 16 15 14 17 16 10 212
Grand
Total 46 36 31 31 28 30 21 20 27 19 19 308
Product
Type Specialty or Primary Care 1998 1999 2000 2001 2002 2003 2004 2005 2006 2007 2008
Grand Total
Biologic Primary Care Driven ATCs 21% 29% 50% 46% 38% 14% 17% 50% 40% 0% 44% 32%
Specialist Driven ATCs 79% 71% 50% 54% 63% 86% 83% 50% 60% 100% 56% 68%
Biologic
Total
Small
Molecule Primary Care Driven ATCs 56% 62% 28% 61% 65% 50% 53% 36% 53% 50% 70% 53%
Specialist Driven ATCs 44% 38% 72% 39% 35% 50% 47% 64% 47% 50% 30% 47%
Count Percentage Count Percentage Count Percentage
Primary Care Driven ATCs 31 32% 112 53% 143 46%
Specialist Driven ATCs 65 68% 100 47% 165 54%
Grand Total 96 212 308
Grand Total
Biologic Small Molecule
29 Trusheim et al.: Do Biologics Differ from Small Molecules?
Figure 8: Count of 1998-2008 NMEs by Quarter from Launch Date
30
Forum for Health Economics & Policy, Vol. 13 [2010], Iss. 1, Art. 4
http://www.bepress.com/fhep/13/1/4 DOI: 10.2202/1558-9544.1200
Our measure of relative price growth is not without some ambiguity, however, since for a given molecule the dosage strengths per standard unit can vary, and change over time. Nonetheless, bearing these caveats in mind, we compute unweighted arithmetic mean annualized (quarter over previous year’s same quarter) growth rates in real prices, over all therapeutic classes, separately for biologics and small molecules. It is worth stressing that this unweighted mean annualized growth rate calculation in real prices is quite different from price indexes computed by, for example, the U.S. Bureau of Labor Producer Price Index program.12 Results of this calculation are given in Figure 9.
The most striking, and to us surprising, finding displayed in Figure 9 is that over the product life cycle, in most quarters and especially between quarters 9 and 32 (years three through eight), mean real price increases are substantially larger for small molecules than for biologics.
We also note that small molecules experience a generally rising rate of price growth increases from Quarter 9 through Quarter 18 followed by a decline in rate of price growth from Quarter 19 through Quarter 32. While biologic price growth fluctuates from quarter to quarter, no similar trending is obvious.
This higher price growth phenomenon for small molecules is a most surprising and intriguing finding, for which we have no obvious explanation.
A. SALES REVENUES OVER THE PRODUCT LIFE CYCLE
What we are interested in is comparing inflation-adjusted (based on the Gross Domestic Product implicit deflator) sales revenue data over the up to 32-quarter product life cycle, separately for biologics and small molecules.
Bearing the funnel nature of our data set in mind, in Figure 10 we plot the mean sales from first quarter of observed revenues over all therapeutic classes, separately for biologics and small molecules. Four findings from Figure 10 are particularly noteworthy.
First, both biologics and small molecules initially reach a mean of about $100 million in GDP deflated real quarterly sales revenues around quarters 21-22, i.e., after being on the market slightly more than five years. This equal time to $100 million in mean real sales revenues is a most surprising result, given the conventional wisdom that biologics predominantly tend to be small-revenue products.
Second, although the time to $100 million in quarterly inflation adjusted sales is very similar for biologics and small molecules, the path by which they arrive there is very different.
12 For a discussion of price index calculation procedures and their interpretation in the context of biopharmaceutical products, see Berndt, Griliches and Rosett [1993].
31 Trusheim et al.: Do Biologics Differ from Small Molecules?
Figure 9: Mean Real Price Growth (Quarter over Prior Year’s Same Quarter) from First Quarter of Observed Revenues, Biologics and Small Molecules
32
Forum for Health Economics & Policy, Vol. 13 [2010], Iss. 1, Art. 4
http://www.bepress.com/fhep/13/1/4 DOI: 10.2202/1558-9544.1200