HAL Id: hal-01592142
https://hal.archives-ouvertes.fr/hal-01592142
Submitted on 3 Jul 2018HAL is a multi-disciplinary open access
archive for the deposit and dissemination of sci-entific research documents, whether they are pub-lished or not. The documents may come from teaching and research institutions in France or abroad, or from public or private research centers.
L’archive ouverte pluridisciplinaire HAL, est destinée au dépôt et à la diffusion de documents scientifiques de niveau recherche, publiés ou non, émanant des établissements d’enseignement et de recherche français ou étrangers, des laboratoires publics ou privés.
Distributed under a Creative Commons Attribution| 4.0 International License
Monitoring Biological Cell Flow within a Mimicking
Capillary Device with Impedance Measurement
Tieying Xu„ Maria Lizarralde„ Wassim El Nemer, Bruno Le Pioufle, Olivier
Français
To cite this version:
Tieying Xu„ Maria Lizarralde„ Wassim El Nemer, Bruno Le Pioufle, Olivier Français. Monitoring Biological Cell Flow within a Mimicking Capillary Device with Impedance Measurement. Eurosensors, Sep 2017, Paris, France. pp.3 - 6, �10.3390/proceedings1040517�. �hal-01592142�
Proceedings 2017, 1, 517; doi:10.3390/proceedings1040517 www.mdpi.com/journal/proceedings
Proceedings
Monitoring Biological Cell Flow within a Mimicking
Capillary Device with Impedance Measurement
†Tieying Xu 1, Maria Lizarralde 2, Wassim El Nemer 2, Bruno Le Pioufle 1 and Olivier Français 1,3,*
1 SATIE, UMR CNRS 8029, ENS Paris Saclay, Cachan, France; txu@satie.ens-cachan.fr (X.T.); bruno.lepioufle@satie.ens-cachan.fr (B.L.P.)
2 BIGR, UMR_S 1134, INTS, Paris, France; maria.a.lizarralde.i@gmail.com (M.L.); wassim.el-nemer@inserm.fr (W.E.N.)
3 ESIEE-Paris, ESYCOM EA 2552, Noisy-Le-Grand, France * Correspondence: olivier.francais@esiee.fr; Tel.: +33-145-926-694
† Presented at the Eurosensors 2017 Conference, Paris, France, 3–6 September 2017. Published: 17 August 2017
Abstract: This paper presents a microfluidic system, characterizing the red blood cell (RBC)
deformability through its transit time in a microchannel, which dimensions reproducing blood microcirculation capillary. Electrodes are integrated within the microchannel for electrical measurements. The transit time is measured with the electrical blockade produced when the RBC squeezes in the microchannel (d = 5 μm diameter, while the cell diameter is 8 μm). In order to determine most suitable electrical frequency range for the voltage applied to excitation electrodes, FEM numerical simulation of the bioimpedance is achieved and presented in this paper. We investigated the frequency response of the bioimpedance taking into account the electrode polarization, the dielectric properties of the medium, a single shell model for RBC and finally the RBC position within the microchannel.
Keywords: microfluidic; bioimpedance; sickle cell disease; mimetic chip
1. Introduction
Sickle-cell disease (SCD), which is characterized by the presence of abnormal hemoglobin (HbS) due to genetic disorder, touches millions people and resulted in about 114,800 deaths in 2015 [1]. When the sixth Glutamic acid (Glu) of HBS is replaced by Valine (Val), RBCs change their shape from oval biconcave disk to sickle, losing their deformability, leading to vaso-occlusive crisis [2]. We propose to diagnose the presence of sickle RBCs, by the analysis of RBC transit time in microfluidic channels, which dimensions mimicking the blood capillaries. The transit of RBC in the channel can be detected though the monitoring with time of the bioimpedance variation.
Thanks to the simultaneously excitation with several electrical angular frequencies the dielectric properties of the RBC can also be estimated, which might be a fingerprint of the Sickle Cell Disease stage.
2. Dielectric Behavior of Biological Material
The complex permittivity ε* of any material is defined by its electrical conductivity (σ) and
permittivity (ε) and depends on the angular frequency (ω) of the electrical field.
∗= − (1)
For a biological cell, it is dependent on its components (membrane, cytoplasm) and the cell dimensions (radius, membrane thickness), as seen in its expression (case of the single shell model [3]):
Proceedings 2017, 1, 517 2 of 4 ∗ = ∗ − + 2 ∗ − ∗ ∗ + 2 ∗ − − ∗ − ∗ ∗ + 2 ∗ (2)
In the case of red blood cell flowing within cellular medium, the parameter values become (Table 1): Table 1. The dielectric properties of RBC.
Extracellular Medium Intracellular Medium Cellular Membrane
Relative Permittivity 78.5 50 11
Conductivity (S·m−1) 1.44 0.9 10−5
For low frequency electric field (below 1 kHz), the cellular membrane is preponderant and the RBC is seen as an insulator, blocking the electric current. While at high frequencies (above 1 MHz), the membrane is short-circuited and the intracellular medium is in interaction with the electric field, given an appearance of conductive material. In the proper frequency range (between 10 kHz and 100 kHz) the elevation of the electric impedance of the capillary reveals the presence of RBC.
3. Microfluidic Chip Design and Fabrication
To reproduce the blood microcirculation capillary, PDMS microfluidic technology is an easy way to fabricate a mimicking device (Figure 1A). The blood flow and the mechanical constraints imposed on RBC as they crossed microcapillaries with hydraulic diameter down to 5 μm can be obtained (Figure 1B).
Figure 1. (A) Microfluidic chip; (B) RBC flowing within a capillary channel; (C) Electrodes integration for impedance measurements.
A SU8 mold is used with PDMS molding step to obtain the microfluidic chip [4]. This mold has two different thicknesses corresponding to two steps of mold fabrication: the first step use a spin coating of is a thin 5 μm SU8 layer for the restriction channel associated to a UV photolithography process. The second step is a spin coating of thick 25 μm SU8 layer for the fluidic access. A second UV photolithography is done with specific alignment to get good connection between the restriction channel and the fluidic access.
For the bioimpedance measurement, we integrate a pair of electrodes, which are located at the bottom of 2 large capillaries, beside the restriction (Figure 1C). The electrodes are obtained from wet etching of Cr/Au covered glass substrate. A protective layer is done using S-1805 photoresist before the chromium and gold etching. Bonding between the PDMS chip and the glass substrate is done
with O2 Plasma activation with a manual alignment.
4. Numerical Analysis of the Chip
With size reduction, bioimpedance measurements can be limited in low frequencies by the
numerical model using Finite Element Modeling, based on Comsol©, to estimate the bioimpedance
of our design, taking into account its influence. We considered a CDL = 1 μF/cm2.
The RBC has the shape of a donut (diameter = 8 μm with a thickness = 2.5 μm) outside the restriction channel and elongates once entering the mimicking capillary, keeping its initial volume (Figure 2).
Figure 2. Simulated bioimpedance evolution with frequency in relation with RBC position.
Simulated impedance values are presented in Figure 2 for a frequency range from 100 Hz to 10 MHz and different RBC positions in the microchannel. We retrieved the polarization effect, which is predominant for low frequencies. The electrode surface used was (40 μm × 20 μm), corresponding to the surface in contact within the microchannel. Around 300 kHz, the Maxwell Wagner effect, due to the RBC membrane charging time appears, as in this configuration the RBC fills the channel and provokes a current blockade. If we choose the frequency below the Maxwell Wagner effect and above the dominant effect of the electrode polarization (in our case this corresponds to the range [10 kHz, 100 kHz], the impedance measurement is a convenient method to detect the RBC position and travel within the capillary. Associated to a lock-in amplifier at this particular frequency for impedance value measurement, the transit time can be extracted and analyses in order to make correlation with RBC deformability.
5. Measurement of Microfluidic First Device
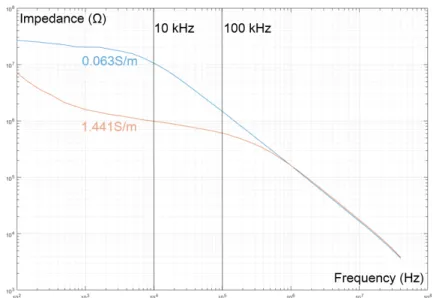
We did some experiments using an impedance analyzer HP 4194A (1 kHz~40 MHz) connected to a fabricated device. We measured the impedance of our chip with homemade conductive medium using KCl solutions. We used one KCl conductivity of 1.441 S/m equivalent to the blood flow. A second KCl conductivity of 0.063 S/m had been considered for the case of a RBC squeezed within the restriction channel.
As predicted (Figure 3), at low frequencies (<103 Hz), there is a slope of the impedance modulus
in the Bode plot and an impedance phase shift. This behavior reflects the influence of the double layer capacitance CDL. In contrast, at the high frequencies (>105 Hz), we can see a decrease of the impedance
value, which is due to the parasitic capacitance of the full device (Figure 3). This effect limits the performance of the device in impedance measurement as its presence shields the medium behavior and thus the restriction conductivity variation.
Proceedings 2017, 1, 517 4 of 4
Figure 3. Experimental results of 4 different KCl concentrations in a restriction. 6. Discussion
From the measurements (Figure 3), the KCl solutions (similar to blood plasma) have an impedance behavior with a range of measurement limited by both the electrode polarization and the parasite capacitance of the chip. An optimal range of frequency (here 10 kHz) can be extract for the transit time analysis, as predicted in numerical simulation (Figure 2).
A correlation between the impedance modulus variations and the RBC transit time can be used to monitor the RBC deformability behavior. Deeper analysis based on impedance phase recording and multi-frequency measurements can also be done to get more precise data concerning cell state. Acknowledgments: The authors acknowledge the Labex LaSIPS (ANR-10-LABX-0040-Lasips), the “Ecole Doctorale EOBE” of Université Paris-Saclay, the “Institut d’Alembert” and the “CNRS” for project foundings. Conflicts of Interest: The authors declare no conflict of interest.
References
1. GBD 2015 Mortality and Causes of Death, Collaborators. Global, regional, and national life expectancy, all-cause mortality, and all-cause-specific mortality for 249 all-causes of death, 1980–2015: A systematic analysis for the Global Burden of Disease Study 2015. Lancet 2016, 388, 1459–1544.
2. Higgins, J.M.; Eddington, D.T.; Bhatia, S.N.; Mahadevan, L. Sickle cell vasoocclusion and rescue in a microfluidic device. Proc. Natl. Acad. Sci. USA 2007, 104, 20496–20500.
3. Français, O.; Le Pioufle, B. Handbook of Electroporation; Miklavcic, D., Ed.; Springer: Cham, Switzerland, 2016; pp. 1–18.
4. Picot, J.; Ndour, P.A.; Lefevre, S.D.; El Nemer, W.; Tawfik, H.; Galimand, J.; Da Costa, L.; Ribeil, J.A.; De Montalembert, M.; Brousse, V.; et al. A biomimetic microfluidic chip to study the circulation and mechanical retention of red blood cells in the spleen. Am. J. Hematol. 2015, 90, 339–345
© 2017 by the authors. Licensee MDPI, Basel, Switzerland. This article is an open access article distributed under the terms and conditions of the Creative Commons Attribution (CC BY) license (http://creativecommons.org/licenses/by/4.0/).