HAL Id: hal-03137463
https://hal.uca.fr/hal-03137463
Preprint submitted on 10 Feb 2021
HAL is a multi-disciplinary open access archive for the deposit and dissemination of sci-entific research documents, whether they are pub-lished or not. The documents may come from teaching and research institutions in France or abroad, or from public or private research centers.
L’archive ouverte pluridisciplinaire HAL, est destinée au dépôt et à la diffusion de documents scientifiques de niveau recherche, publiés ou non, émanant des établissements d’enseignement et de recherche français ou étrangers, des laboratoires publics ou privés.
Jules Gazeaud, Claire Ricard
To cite this version:
Jules Gazeaud, Claire Ricard. Conditional Cash Transfers and the Learning Crisis : Evidence from Tayssir Scale-up in Morocco. 2021. �hal-03137463�
SÉRIE ÉTUDES ET DOCUMENTS
Conditional Cash Transfers and the Learning Crisis: Evidence from
Tayssir Scale‐up in Morocco
Jules Gazeaud
Claire Ricard
Études et Documents n°8
February 2021 To cite this document: Gazeaud J., Ricard C. (2021) “Conditional Cash Transfers and the Learning Crisis: Evidence from Tayssir Scale‐up in Morocco”, Études et Documents, n°8, CERDI. CERDI POLE TERTIAIRE 26 AVENUE LÉON BLUM F‐ 63000 CLERMONT FERRAND TEL. + 33 4 73 17 74 00 FAX + 33 4 73 17 74 28 http://cerdi.uca.fr/2 Jules Gazeaud Postdoctoral researcher, NOVAFRICA, Nova School of Business and Economics, Universidade NOVA de Lisboa Email address: jules.gazeaud@novasbe.pt Claire Ricard PhD student, Université Clermont Auvergne, CNRS, CERDI, F‐63000 Clermont‐Ferrand, France and FSJES‐Aïn Chock, Université Hassan II Email address: claire.ricard@etu.uca.fr This work was supported by the LABEX IDGM+ (ANR‐10‐LABX‐14‐01) within the program “Investissements d’Avenir” operated by the French National Research Agency (ANR). Études et Documents are available online at: https://cerdi.uca.fr/etudes‐et‐documents/ Director of Publication: Grégoire Rota‐Graziosi Editor: Catherine Araujo‐Bonjean Publisher: Aurélie Goumy ISSN: 2114 ‐ 7957 Disclaimer: Études et Documents is a working papers series. Working Papers are not refereed, they constitute research in progress. Responsibility for the contents and opinions expressed in the working papers rests solely with the authors. Comments and suggestions are welcome and should be addressed to the authors.
3
We use a regression discontinuity design in rural Morocco to study whether the enrollment gains from conditional cash transfer programs translate into learning benefits. Unlike most previous studies, we estimate the effects of a sustained exposure during whole primary school. We find small and seemingly negative effects on test scores at the end‐of‐primary school exam. Concomitant increases in class size suggest that the program constrained learning by putting additional pressure on existing resources in beneficiary areas. These results are particularly relevant for settings where transfers are geographically targeted with no measures to absorb the extra influx of students. Keywords Conditional cash transfers, Learning outcomes, Program scale‐up, Morocco, Tayssir JEL Codes I21, I38, J24, O12, O15 Acknowledgments Thanks to Abdelilah Abbaia, Martine Audibert, Cátia Batista, Hamidou Diallo, Lydie Drouard, Eric Edmonds, João Firmino, Abdelhaq El Hayani, Elhabib Kinani, Francesca Marchetta, Sandrine Mesplé‐Somps, Teresa Molina‐Millán, Fouzi Mourji, Olivier Santoni, Olivier Sterck and seminar participants at Observatoire National du Développement Humain in Rabat, Journées Doctorales du Développement, Agence Française du Développement, Moroccan Ministry of Education, and Nova School of Business and Economics for helpful comments. We are very grateful to the Moroccan Ministry of Education (in particular Elhabib Kinani) for providing access to the MASSAR dataset, and to Nourddine Bouhemaid, Mohamed Elarrassi, Abdeljaouad Ezzrari, and Younes Nail for helping us with extracting and understanding the data.
Jules Gazeaud acknowledges the support received from Fundação para a Ciência e a Tecnologia (UID/ECO/00124/2013 and Social Sciences DataLab, Project 22209), POR Lisboa (LISBOA‐01‐ 0145‐FEDER‐007722) and POR Norte.
Claire Ricard acknowledges the support received from the Agence Nationale de la Recherche of the French government through the program “Investissements d’avenir” (ANR‐10‐LABX‐14‐01).
1
Introduction
The last decades have witnessed impressive progress in access to education in devel-oping countries. The share of primary school-aged children out of school in low- and middle-income countries has considerably declined between 1998 and 2018, from 19 percent to 9 percent.1 As part of the global efforts to raise basic education, targeted conditional cash transfer (CCT) programs have been proven particularly effective (see e.g.Fiszbein and Schady,2009;Baird et al.,2011,2014;Garcia and Saavedra,2017). CCT programs provide regular cash transfers to poor families contingent on specific behav-iors such as school enrollment and regular attendance. These programs started in the late 1990s in Mexico and quickly became the public policy of choice to fight poverty and low enrollment in the developing world. Today, at least 63 countries operate CCT programs, often at a national scale (Bastagli et al.,2016).
Despite robust evidence of positive effects on enrollment, less is known about their impacts in terms of learning achievement. This gap in the literature is problematic be-cause the decision to implement CCT programs is generally motivated by the ultimate objective of enhancing human capital and breaking the inter-generational transmission of poverty. Positive effects on enrollment point to the potential for such longer-term benefits, but recent studies suggest that “schooling is not learning” (Pritchett, 2013), and that education systems in developing countries can produce alarmingly low test scores in international assessments (Kremer et al., 2013; Bold et al., 2017).2 Although most children in the developing world are now enrolled in school, less than half are able to read and understand a simple text at the age of 10 (World Bank, 2019). Docu-menting whether enrollment gains from CCT programs translate into sustained learn-ing benefits therefore seems of crucial importance. However, credibly estimatlearn-ing such effects is challenging, as successful interventions often expand to the control group after the evaluation period.
This paper aims to provide new evidence on the effects of CCT programs on
learn-1Source: World Bank’s World Development Indicators.
2This situation has been characterized as a “learning crisis” by the international community (World
ing in primary school. We study this question in the context of Morocco where the av-erage performances of students are very low compared to international standards: the country ranked 73 over 78 countries in the latest PISA assessment. Morocco’s condi-tional cash transfer program, known as Tayssir, began operating in 2008 and quickly be-came the flagship education policy of a government strongly committed to fight school dropout. A randomized evaluation of the pilot found large gains in school participa-tion (Benhassine et al., 2015). Following this evaluation, the program was scaled-up and targeted all municipalities with poverty rate above 30% (and all households with children aged 6-15 within these municipalities). Between 2010 and 2018, up to 800,000 children in 434 municipalities received regular cash transfers that were conditional on school enrollment and attendance. Annual transfers were equivalent to between 6% (in grades 1 and 2) and 10% (in grades 5 and 6) of the average annual spending per capita. Because transfer allocation has remained remarkably stable between 2010 and 2018, this program offers an ideal setup to study the effects of conditional cash transfers on outcomes such as learning which require cumulative investments.
We exploit the fact that eligibility was determined on the basis of the poverty rate of each municipality to conduct a fuzzy regression discontinuity analysis. Municipalities were eligible to receive Tayssir if they had a poverty rate above 30% according to the poverty map of 2004. We find that this 30% cut-off is highly predictive of Tayssir allo-cation. We use novel administrative data from the information system of the Ministry of Education of Morocco to explore the effects of the program on enrollment, achieve-ment, and learning. This system was launched in 2013. It provides unique identifica-tion for all students in Morocco and is cited byAbdul-Hamid(2017) as an example of successful education management information system – although to our knowledge it has never been used by academics. To conduct this research, Morocco’s Ministry of Ed-ucation granted access to anonymized information for all primary school students in municipalities with poverty rates between 20% and 40% in 2004. Overall, our sample contains over 8,700 schools and 900,000 students in each year of the 2013-2018 period.
with Benhassine et al. (2015) estimates on the pilot. This exercise is important be-cause impacts may differ as programs are taken to scale (Banerjee et al.,2017). We find that the program reduced dropout in all grades of primary school: the grade-specific dropout rate decreased by 1.3 percentage points on average (which corresponds to more than one third of the sample mean). We find larger effects for girls. These esti-mates are fully consistent with those ofBenhassine et al.(2015) on the pilot.
We then study the impacts of the program on test scores at the graduation exam at the end of primary school. We correct for selection issues arising from differential dropout rates by imputing test scores corresponding to different degrees of selection into dropout. These estimates provide lower and upper bounds to the true effect of the program on test scores. The results indicate that continued exposure to the program during whole primary school did not lead to significant improvements in test scores and in fact reduced the scores of boys by between 0.10 and 0.18 SD.
We discuss different mechanisms that could be driving these results and we test whether the program constrained learning by putting additional pressure on existing educational resources in beneficiary areas. We identify a sizable and positive impact of the program on class size which in turn had negative effects on graduation scores. Class size in beneficiary areas increased by as much as 3.6 students in grade 6, which corresponds to 12% of the average class size in the sample (30.7 students). We use an IV strategy to examine whether this increase in class size had negative effects on test scores. More specifically, we instrument class size by the eligibility cutoff and find that the increase in class size induced by the program had negative effects on test scores within the sample of boys: increasing class size by one student led to test scores 0.03 to 0.05 SD lower for boys in beneficiary municipalities.
More reassuringly, we find that the program increased the probability of enrollment in secondary school by 4.5 percentage points (equivalent to a 7% increase relative to the sample mean of 63.8%), with stronger effects for girls (7 percentage points or 11% relative to the sample mean of 64.4%).
insights on the longer-term effects of conditional cash transfer programs. In a recent review, Molina Millán et al. (2019) document positive effects on grades completion and school attainment,3 but mixed evidence on learning. Evaluations in Nicaragua (Barham et al., 2017) and Colombia (Duque et al., 2019) find positive impacts on test scores, contrasting with non-significant effects reported for programs in Mexico (Behrman et al.,2005;Dustan,2020), Colombia (Baez and Camacho,2011), Cambodia (Filmer and Schady,2014), Nicaragua (Barham et al.,2018) and Malawi (Baird et al.,2019).4 Our pa-per adds to this literature by estimating the effects of a flagship program implemented by the government of Morocco. Unlike most previous studies, which evaluated rela-tively limited exposures to cash transfers, in this paper we focus on effects correspond-ing to an exposure durcorrespond-ing whole primary school. We find that the program did not lead to learning gains in primary school and actually had negative effects on boys test scores. In addition, we emphasize a new channel through which the program might have constrained learning: by increasing class size in municipalities targeted by the program. This channel of impact may be particularly relevant in settings where trans-fers are geographically targeted with no particular measures to absorb the extra influx of students.
Second, this paper contributes to our understanding of the effect of class size on stu-dents performances. Stustu-dents assigned to smaller classes typically exhibit higher test scores (Krueger,1999;De Giorgi et al.,2012) and benefit from welfare gains in the long-term (Chetty et al.,2011;Fredriksson et al.,2013). However, results vary across contexts and have been more modest in the case of rule-induced class size reductions (Urquiola,
2006; Angrist et al., 2019). They also often depend on peer characteristics (Hoxby,
2000; Dobbelsteen et al., 2002; Firmino et al., 2018). For example, in Kenya, children randomly assigned to classes with more high-performing peers achieved higher tests (Duflo et al.,2011). To the best of our knowledge, we provide the first estimate of the
3For example,Cahyadi et al.(2020) find a positive effect of CCT programs on high school completion rates in Indonesia – found also in Mexico (Parker and Vogl,2018), Colombia (Barrera-Osorio et al.,2019), and Honduras for non-indigenous populations (Molina Millán et al.,2020).
4Evidence on unconditional transfers points to either null or negative effects on test scores (Ponce
effects of variations in class size induced in the context of a CCT program. Our results suggest that these variations can have a negative effect on children test scores.
Finally, we contribute to the emerging literature on the scale-up of development programs by analyzing whether Tayssir intervention in Morocco – whose pilot has been proven particularly successful to increase enrollment (Benhassine et al., 2015) – achieves similar effects once implemented at a national scale. While recent studies suggest that effects could be smaller (Banerjee et al.,2017;Muralidharan and Niehaus,
2017; Bold et al., 2018; Vivalt, 2020), we find that in this setting the effects of the pro-gram remained very stable despite the ten-fold increase in the number of beneficiaries and the expansion to numerous new locations. If anything, this evidence is reassur-ing regardreassur-ing the ability of pilot evaluations to produce insightful estimates of at-scale impacts.
The rest of the paper structures as follows: section 2 presents the background of our study, section 3 describes the data and the main variables of interest, section 4 presents the empirical strategy, section 5 shows the results. The last section concludes.
2
Background
2.1
Education in Morocco
Public education in Morocco is completely governed by the Ministry of Education (MENFPESRS or Ministère de l’Education Nationale, de la Formation Professionnelle, de l’Enseignement Supérieur et de la Recherche Scientifique). Private education remains low despite a sizable expansion during the past decade (especially in urban areas).5 In rural areas, schools are typically organized into clusters consisting of a central, rela-tively well-resourced school and several smaller satellites. The latter are often one-room schools with one teacher. According toSoumaya et al. (2018), the quality of
ed-5The share of students enrolled in private schools has doubled between 2007 and 2017, from 8.4% to 16.7% for primary education, and from 4% to 9.3% for lower secondary education (source: Atlas territorial de l’enseignement privé 2018). In 2018, 61.4% of the students enrolled in private primary education were living in the most urbanized regions of Casablanca-Settat, Rabat-Salé-Kénitra and Fès-Meknès (Ministry of Education,2018).
ucation in these schools is particularly low. Primary schools include grades 1 through 6 (generally attended by children aged 6 to 12) and lower secondary schools include grades 7 through 9 (generally attended by children aged 13 to 15). Each cycle ends by a final graduation exam. Our article focuses on the exam at the end of primary school, which covers Arabic, Islamic education, French and Math. To access secondary edu-cation, students are required to get at least 5/10 at this exam. Half of the grade relies on continuous assessment, a quarter on a school exam at the end of the first semester, and the last quarter on a provincial exam at the end of the year. In 2014, 84% of the students who took this exam passed it (Soumaya et al.,2018).
The average performances of Moroccan students are very low compared to inter-national standards. For example, Morocco ranked 73 over 78 countries in the latest PISA assessment. According toSoumaya et al.(2018), there are several factors that ex-plain the low performances of Morocco in terms of learning. First, teachers often lack formal education and pedagogical skills: 40% of fourth-grade teachers have no formal post-secondary education (international average: 3%),6and 66% have not participated in any training during the past two years (international average: 16%) (CSEFRS,2019). Second, learning is still largely based on memory even if a new curriculum prioritiz-ing skills-based learnprioritiz-ing was adopted in 2002. Third, instruction is provided in unified modern Arabic whereas the mother tongue of most students is Darija (Moroccan Ara-bic) or Amazigh (Moroccan Berber).7 Finally, enrollment in early childhood education remains relatively low. During school year 2015-2016, only 43% of children aged 4 to 5 were enrolled in early childhood education, of which 39.5% were enrolled in religious schools.8
6Until 2007, only a higher secondary school level was required to be a teacher. Since 2007, at least three years of post-secondary education in a Regional Center for Education and Training Professions are required.
7People typically communicate using Darija (90.9%) or Amazigh (26.8%) but not Modern Arabic (Ministry of Education,2018). By 2030, Amazigh should become an instruction language (Soumaya et al.,2018).
2.2
The Tayssir conditional cash transfer program
Tayssir began operating in 2008 and quickly became the flagship education program of a government strongly committed to fight school dropout. Tayssir provides bi-monthly cash transfers to the parents of children aged 6-15 conditional on school enrollment and regular attendance. The monthly transfer per child is increasing with grade: from US$8 in grades 1 and 2, to US$10 in grades 3 and 4, to US$13 in grades 5 and 6, and to US$18 in grades 7 to 9.9 Transfers are perceived for all school months (10 months) in which an eligible child attend school regularly (i.e. at most 4 absences in primary school, and 6 absences in lower secondary school). Annual transfers for children complying with this condition correspond to between 6% (in grades 1 and 2) and 13% (in grades 7 to 9) of the average annual spending per capita in rural areas.10 Transfers are restricted to a maximum of three children per household. Parents can withdraw the cash transfers at the local post office, or, in remote areas, upon the visit of mobile cashiers. During school years 2015/16 and 2016/17, the program was plagued by liquidity issues, caus-ing important delays in payments (L’Economiste,2017).
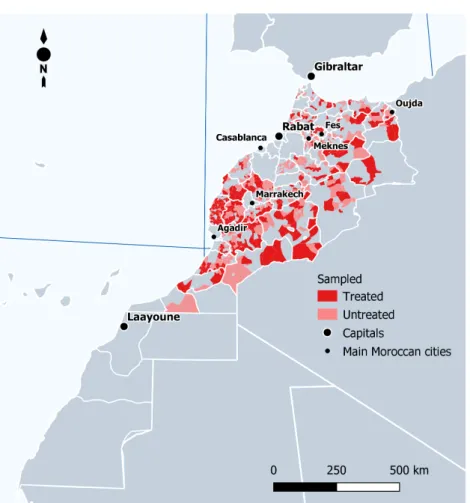
Started as a pilot in 2008, Tayssir was then rolled-out to 434 poor, rural municipal-ities in 2010. By the end of 2010, it had already expanded to cover 609,000 children. Municipalities were eligible to receive Tayssir if they had a poverty rate above 30 per-cent according to the poverty map of Morocco’s Haut Commissariat au Plan.11 The treat-ment status of Morocco’s 1,687 municipalities is shown in Figure1. Initially all primary school children within treated municipalities were eligible for the transfers. In subse-quent years, in order to follow the various cohorts of beneficiaries, the program was gradually expanded to lower secondary school (i.e. grades 7 to 9), ultimately reaching around 800,000 children annually. Most recently, during the 2018/19 school year, an important reform enacted a fourfold increase in budget and the expansion to
benefi-9We use the 2008 exchange rate of 7.75 Moroccan dirhams for one US dollar (but this rate has re-mained relatively stable over time).
10Authors’ calculations using data from the Enquête Nationale sur la Consommation et les Dépenses des Ménages 2013/14. Because the program was targeted towards the poorest municipalities, these estimates should be interpreted as lower bounds.
11Eligible municipalities were also supposed to have school dropout rates above 8 percent, but in practice this condition was never enforced (according to our discussions with program officials).
ciaries in new municipalities using proxy means testing (Médias24,2018). The present paper focuses on the period prior to this reform.
Figure 1: Municipalities receiving Tayssir
Notes: This map depicts the treatment status of the different municipalities. Plain white lines correspond to provinces’ administrative boarders. Dotted white lines correspond to munici-palities’ administrative boarders.
Source: Authors’ elaboration using treatment data from the Haut-Commissariat au Plan.
Benhassine et al.(2015) evaluate the impacts of Tayssir pilot with a special focus on the importance of conditions and recipient gender. The authors compare households assigned to four variants of Tayssir and to a control group: (i) “labeled” cash transfers (LCT) to mothers, (ii) “labeled” cash transfers to fathers, (iii) conditional cash trans-fers to mothers, and (iv) conditional cash transtrans-fers to fathers. “Labeled” cash transtrans-fers were not conditional on school attendance but explicitly labeled as assistance for edu-cation costs.12 Outcomes were measured two years after the start of the program. The
12In what follows, we discuss only the effects of CCT to fathers but results are very similar for LCTs and CCT to mothers. The version that was ultimately rolled-out consists in a CCT given to one of the parents.
authors find large and similar impacts on school participation under all versions of the program. The dropout rate decreased by 62 percent over the 2-year period for chil-dren in households receiving CCT to fathers. The reduction in dropout was somewhat larger for girls (8.3 p.p. from a base of 12 percent) than for boys (4.8 p.p. from a base of 8.3 percent). Interestingly, the authors document that the program increased parents’ beliefs about the returns to education, suggesting that the decrease in dropout may op-erate through an information effect whereby transfers are interpreted by parents as a signal of the value of education. The authors also administered an ASER arithmetic test to a random subset of children at endline (i.e. after two years of transfers).13 They find small, non-significant effects on standardized test scores (0.04 SD for CCT to fathers), and no evidence of heterogeneous effects by gender. Because the test was adminis-tered at home, these estimates do not suffer from selection issues due to differential dropout rates across experimental groups. However, measuring effects within the first two years of the program may be insufficient to capture effects on outcomes such as learning which typically require cumulative investments over an extended period. The main objective of this paper is to analyze whether program effects on learning emerge for children exposed to six years of cash transfers (i.e. during all their primary educa-tion). In addition, we assess whether positive effects on enrollment persist at scale.
3
Data
This study collates data from three primary sources. First, we rely on the poverty rate in the 2004 poverty map built by the Morocco’s Haut-Commissariat au Plan (this rate was used to determine eligibility to the program). Second, we rely on Aiddata geoquery tool to compile pre-program data on nighttime lights, population density, land occupation, and distances. These data are used to conduct balance checks. Third, we use data from MASSAR, the information system of Morocco’s Ministry of Education, to construct the outcomes of interest. The rest of this section gives more details on MASSAR and on
13ASER is a mathematics test measuring the ability of children to perform basic arithmetic such as recognizing a one-digit or two-digit number, performing a subtraction, and performing a division.
the outcomes of interest.
3.1
The MASSAR database
MASSAR was officially launched in 2013 with the aim of providing unique identifi-cation for all students in Morocco. It is cited by Abdul-Hamid (2017) as an example of successful education management information system. In MASSAR, teachers and school directors enter information on students (age, gender, performances) using a dedicated website or mobile application. Every student receives a unique ID number for the entire duration of her education which allows to track them throughout their schooling experience even if they migrate or move to a different school. MASSAR also includes information at the school level, such as the municipality of the school, the number of classes per level, the number of teachers per class, and the number of rooms.
To conduct this research, Morocco’s Ministry of Education granted access to a sub-set of MASSAR. In particular, we obtained anonymized information for all primary school students in municipalities with poverty rates in the range [20%, 40%] in 2004.14 ID numbers were used to follow students even if they had migrated or moved to schools outside the 20-40% interval within the 2013-2018 period (this is crucial to avoid considering as dropouts the students who moved to schools outside the sample). Map
A1shows that the set of municipalities with poverty rates inside the 20-40% interval is relatively well scattered across Morocco. The only provinces with no sampled munici-palities are those in Western Sahara and in the greater Casablanca-Rabat area.
According toAbdul-Hamid(2017) and to our own discussions with Moroccan offi-cials, MASSAR covers the universe of students. Table1further shows that the number of students and schools in our sample has remained remarkably stable over time. This is consistent with the fact that MASSAR was immediately operational at scale.
Over-14We took into account both practical and methodological considerations. On the practical side, it would have been particularly challenging for our partners at the Ministry of Education to extract data for more students. On the methodological side, given our regression discontinuity design, it seemed preferable to sample within a relatively narrow range around the targeting cut-off in order to maximize statistical power (Cattaneo et al.,2019b).
Table 1: Coverage of MASSAR
(1) (2) (3) (4) (5) (6) (7)
Grade 1 Grade 2 Grade 3 Grade 4 Grade 5 Grade 6 ALL Number of schools 2013/14 8,482 8,456 8,303 8,248 8,111 8,040 8,742 2014/15 8,476 8,464 8,445 8,285 8,234 8,159 8,765 2015/16 8,449 8,492 8,460 8,445 8,276 8,261 8,654 2016/17 8,479 8,508 8,534 8,492 8,462 8,374 8,721 Number of children 2013/14 159,980 148,544 152,138 149,999 144,752 139,617 895,030 2014/15 157,756 150,538 150,134 146,220 145,950 152,451 903,049 2015/16 162,794 150,647 151,999 146,252 143,268 156,686 911,646 2016/17 170,431 155,083 152,359 147,736 143,009 154,135 922,753 Share of missing test scores
(excluding dropouts)
2013/14 . . . .401 .
2014/15 . . . .311 .
2015/16 . . . .010 .
2016/17 . . . .010 . Notes: Authors’ elaboration using data from MASSAR. Sample restricted to primary education in municipalities with poverty rates between 20% and 40%.
all, our sample contains about 8,700 schools and 900,000 students each year. Looking at test scores at the graduation exam, we see many missing values in the first two years of MASSAR (40.1% in 2013/14; 31.1% in 2014/15). More reassuringly, the share of miss-ing test scores in the followmiss-ing years was much lower: one percent in both 2015/16 and 2016/17. There are several reasons why scores are missing, including absence on the day of the exam, or teachers/directors not entering information in MASSAR.15 To limit the issue of missing scores, we restrict the sample to years 2015/16 and 2016/17.
3.2
Outcome variables
Using data from MASSAR, we construct outcome variables related to three main do-mains: dropout, learning, and attainment. This subsection describes in details the construction of these variables. Table A1 and Maps A2a toA2d provide descriptive statistics.
15The higher prevalence of missing scores in 2013/14 and 2014/15 may reflect potential issues in the first years of MASSAR, including teachers and school directors struggling to get acquainted with the new system, or initial protests from students and teachers (Médias24,2014). Qualitative research by
Ennaji(2018) highlights that many students protested against MASSAR because they believed it would change the grading system and might therefore increase school failure.
Dropout We consider a student as a dropout in schooling year t if he or she was en-rolled in year t-1 but not in year t. This means that a student who stopped attending school during a given year counts as a dropout only if he or she is not re-enrolled in the following year. TableA1reports the dropout rates by schooling year and grade. Con-sidering all years and grades, we estimate an average annual dropout rate of 3.3%.16 The dropout rate has remained very stable over the period, consistent with the fact that Morocco did not experience major shocks during any of these years. Looking at grade-specific dropout rates, we see that higher grades are associated with more dropout, and that this relationship holds for all years. Taken together, these patterns provide some reassurance about the consistency of MASSAR over time. If anything, data from 2014/15 produce larger dropout rates, especially in the first grades. Because dropouts in 2014/15 are derived using enrollment data from 2013/14 (the first year of service of MASSAR), this could be a symptom of an imperfect roll-out of MASSAR. As men-tioned in Section3.1, in order to limit data quality concerns, we do not use data from 2014/15 to investigate the effects of Tayssir. Analysis are restricted to the years 2015/16 and 2016/17, for which data produce patterns of dropout rates that are hardly distin-guishable. Overall, we are confident that this data capture an accurate account of the reality.
Learning We measure learning using the score obtained at a high-stake exam (called Certificat d’études primaires) administered to all children in grade 6. This exam assesses student knowledge in four areas: Arabic, Islamic education, French, and Mathematics. We focus on the part of the exam administered at the end of the year because it is the only part that is common at the provincial level and therefore allows for comparisons between students from different schools and municipalities.17 In each province,
ques-16This corresponds to the annual dropout rate in primary school. In order to approximate the overall dropout rate in primary school, one should multiply this rate by the average number of years spent in primary school before graduation (a quantity that depends on the prevalence of grade repetition and grade skipping).
17Note, however, that the bulk of the exam (i.e. three quarters) is composed of the grades obtained during the school year through continuous assessment. This part of the exam is poorly suited to esti-mate the effect of Tayssir because of the absence of standardization. Different teachers are likely to use different tests (and to grade differently). Moreover, there is no variation in treatment condition within the group of students assigned to a teacher.
tions to assess students’ learning are determined by a local committee composed of school inspectors and teachers designated by the regional authorities. Tests are graded anonymously and centrally by provincial teachers. We define our outcome as the av-erage test score standardized relative to the control group within each province. In theory, students should get an overall score of at least 5 (over 10) to access secondary school. To explore the extent to which this rule is enforced in practice, we relate the overall score to enrollment in secondary school the following year (Figures 2a to2c). While the figures indicate a clear discontinuity in access to secondary schools for scores just above or below 5, it appears that a non-negligible share of students with scores be-low 5 access secondary school. In addition, despite scores above 5, some students (girls in particular) do not access secondary school – a likely consequence of the high dropout rates observed in grade 6 for girls (TableA2).
Educational attainment We measure educational attainment using two dummies in-dicating (i) graduation from primary school, and (ii) enrollment in secondary school. MASSAR includes no explicit data on graduation, however, as shown in Figure2, the score obtained at the exam in grade 6 provides a relatively good proxy. We define graduation in a theoretical sense, that is students with test scores above 5. Enrollment in secondary school is derived from the changes in MASSAR over time, by observing whether students in grade 6 are enrolled in secondary school the following year.
Figure 2: Selectivity of grade 6 examination
(a) All children (b) Boys (c) Girls
Notes: Each figure represents the probability of enrolling in secondary school in year t+1 depending on the score obtained at grade 6 final exam in year t. Authors’ elaboration using data from MAS-SAR. Sample restricted to primary education in municipalities with poverty rates between 20% and 40%.
4
Empirical strategy
As mentioned in Section2.2, only children in municipalities with poverty rates above 30 percent in 2004 were eligible to Tayssir. We use a regression discontinuity (RD) de-sign to compare students in municipalities above and below this eligibility threshold. A key assumption is that students in municipalities that just qualify for Tayssir (i.e. municipalities whose poverty rate is just above 30%) are sufficiently similar to those in municipalities that just miss out Tayssir (i.e. municipalities whose poverty rate is just below 30%). We test for the presence of discontinuities around the 30% poverty rate threshold using predetermined variables that are measured at the municipality level.18 Coefficients are small and non-significant at conventional levels, providing some reas-surance on the validity of our design (TableA3).
Figure3a illustrates the discontinuity in treatment allocation in the neighborhood of the cut-off using treatment data and poverty rates at the municipality level. The 30 percent cut-off is highly predictive of Tayssir allocation, although the discontinuity is not perfect: some municipalities with scores below the cut-off receive Tayssir and some municipalities with scores above the cut-off do not receive Tayssir. This means that our RD design is fuzzy. Map A3 distinguishes ‘complying’ municipalities from the ‘never takers’ (i.e. eligible municipalities not receiving Tayssir) and the ‘always takers’ (i.e. non-eligible municipalities receiving Tayssir). Compliance is somewhat lower in the North of the country (in the Rif region) where the share of always takers is particularly high.
We use the following simple linear model to estimate treatment effects:
Yit=λ0+λ1Tayssiri+λ2Zi+λ3Tayssiri×Zi+εit (1)
where Yitis the outcome of children i in school year t, Tayssiriis an indicator variable for whether student i is in a treated municipality, Zi is the continuous poverty rate of the student’s municipality, and εit is the error term. Because the cut-off is fuzzy, we instrument Tayssiriwith Abovei, that is an indicator for being above the eligibility
off of 30%. The parameter of interest, λ1, corresponds to the local average treatment effect (LATE) of Tayssir. It can be interpreted as the causal effect of receiving Tayssir in complying municipalities near the cut-off.19
Our baseline strategy for estimating equation (1) makes use of the full sample of stu-dents in primary school described in Section3.1. We do not rely onImbens and Kalya-naraman(2012)’s orCalonico et al.(2014)’s data-driven bandwidth selection methods because our sample is already restricted to students in municipalities close to the cut-off, and because such methods have poor behaviors when the underlying bias is close to zero (Cattaneo et al., 2019a).20 In line withCattaneo and Vazquez-Bare(2016) and
Gelman and Imbens(2019), we chose a simple linear model because higher order poly-nomials can lead to erratic behavior of the estimator at the cut-off. Finally, following
Cattaneo et al.(2019a), we weight observations using a triangular kernel function, and account for within-cluster data dependence by clustering standard errors at the mu-nicipality year level using the nearest-neighbor estimator. We show that results are largely robust to (i) weighting observations using a uniform kernel function, (ii) adding municipality controls accounting for baseline characteristics (nighttime lights, popula-tion density, share of cropland, distance to road, land occupapopula-tion, and travel time to the closest city), (iii) using a quadratic polynomial approximation, (iv) narrowing the bandwidth to 7.5 p.p. on either side of the cut-off, and (v) narrowing the bandwidth to 5 p.p. on either side of the cut-off (see TablesA4,A5,A6andA7).
A key assumption for RD designs to provide unbiased causal estimates is that of no sorting around the eligibility threshold. In our setting, precise manipulation around the threshold is unlikely because poverty rates were determined prior to Tayssir im-plementation (and prior to the announce of the elegibility threshold). To confirm this,
19To the best of our knowledge, there were no other programs or government interventions in which eligibility was determined using the municipal poverty rate. Eligibility to RAMed – Morocco’s na-tionwide medical assistance program – has been targeted at the household level through proxy means testing (Cottin,2019). Other demand side education programs do not depend on the municipal poverty rate. In particular, the initiative Un million de cartables – which provides school bags and other school supplies – is universal. Boarding schools and school feeding programs depend on students’ character-istics (remoteness, number of siblings, academic performances, etc.).
20As mentioned in Section3.1, our sample is restricted to students in municipalities with poverty rates in the range [20%, 40%].
we check the density of municipalities across poverty rates (Figure3b) and test for the presence of a discontinuity at the cut-off usingMcCrary(2008)’s test (Figure3c). Over-all, we see no jump in the density at the cut-off and McCrary test does not reject the null of no discontinuity (p-value=0.33).
Figure 3: First stage and distribution of the running variable
(a) First stage (b) Histogram (c) McCrary test
Notes: Figure 3a shows a linear prediction of Tayssir receipt on municipality poverty scores, run separately on each side of the normalized eligibility cut-off. Municipalities are sorted into bins of width of 2 percentage points. Figure 3bdisplays the density of the running variable across municipalities. Figure 3c features a graphical representation of the McCrary (2008) test of no discontinuity in the running variable at the cut-off (p-value=0.33). The vertical lines indicate the normalized eligibility cut-off.
Source: Authors’ calculation using poverty data from Morocco’s Haut-Commissariat au Plan and treatment data from MASSAR.
5
Results
We start by presenting program effects on school dropout. Then, we present program effects on test scores, discussing potential issues arising from differential dropout rates and our proposed solution. Finally, we report effects on educational attainment. We are interested in the effect of receiving Tayssir and therefore focus the discussion on LATE estimates (λ1 in Eq. 1). However, following Cattaneo et al. (2019a), we also report graphical presentations of reduced-form estimates to provide more transparency on our RD design.
5.1
Impacts on school dropout
Table2shows the results from fuzzy RD regressions. Columns 1 to 6 report the results for each grade. Column 7 displays the results for all grades. Panel A shows estimates for all children, while panels B and C show estimates for boys and girls respectively. Figures4a-4cshow reduced-form estimates.
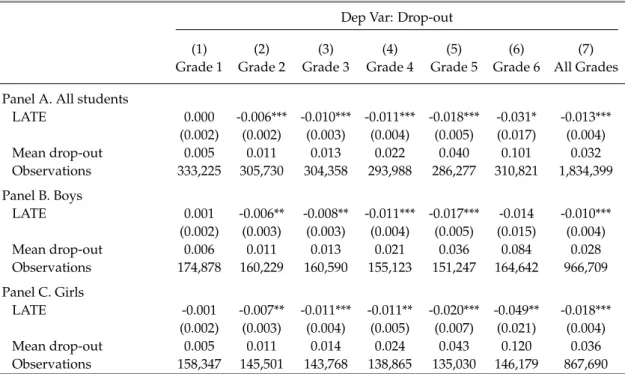
Table 2: Fuzzy RD analysis of dropout effects around Tayssir eligibity threshold Dep Var: Drop-out
(1) (2) (3) (4) (5) (6) (7)
Grade 1 Grade 2 Grade 3 Grade 4 Grade 5 Grade 6 All Grades Panel A. All students
LATE 0.000 -0.006*** -0.010*** -0.011*** -0.018*** -0.031* -0.013*** (0.002) (0.002) (0.003) (0.004) (0.005) (0.017) (0.004) Mean drop-out 0.005 0.011 0.013 0.022 0.040 0.101 0.032 Observations 333,225 305,730 304,358 293,988 286,277 310,821 1,834,399 Panel B. Boys LATE 0.001 -0.006** -0.008** -0.011*** -0.017*** -0.014 -0.010*** (0.002) (0.003) (0.003) (0.004) (0.005) (0.015) (0.004) Mean drop-out 0.006 0.011 0.013 0.021 0.036 0.084 0.028 Observations 174,878 160,229 160,590 155,123 151,247 164,642 966,709 Panel C. Girls LATE -0.001 -0.007** -0.011*** -0.011** -0.020*** -0.049** -0.018*** (0.002) (0.003) (0.004) (0.005) (0.007) (0.021) (0.004) Mean drop-out 0.005 0.011 0.014 0.024 0.043 0.120 0.036 Observations 158,347 145,501 143,768 138,865 135,030 146,179 867,690 Notes: This table reports local average treatment effects of Tayssir cash transfers (Eq. 1in the text). The dependent variable is a dummy equals one if a student dropout from school. Columns 1 to 6 report results for grade 1 to 6 respectively. Column 7 reports results for all grades. The unit of observation is a student-year for the schooling years 2015/16 and 2016/17. Sample restricted to students in primary schools in municipalities with 2004 poverty rates in the range [20%, 40%]. Observations are weighted using a triangular kernel function. Robust standard errors in parenthesis are clustered at the municipality year level. *** p<0.01, ** p<0.05, * p<0.1.
Source: Authors’ calculation using data from MASSAR and Haut-Commissariat au Plan.
The estimates reveal that the program led to a significant reduction in dropout rates. Point estimates imply that the average grade-specific dropout rate in primary school decreased by 1.3 p.p. (a 41% reduction relative to the average dropout rate in the sample). As expected, we see a positive correlation between school drop out and the poverty rate on each side of the eligibility cut-off (Figure 4a). Looking at effects by grade, we find small and non-significant effects in grade 1, but negative and statis-tically significant effects in higher grades. Higher grades are consistently associated with larger absolute reductions in dropout rates: from 0.6 p.p. in grade 2, to roughly 1
p.p. in grades 3 and 4, to 1.8 p.p. in grade 5, and to 3.1 p.p. in grade 6. Regressions by gender outline that negative effects on dropout are stronger for girls. Girls benefiting from Tayssir are on average 1.8 p.p. less likely to drop out from schools (a 50% reduc-tion compared to the sample mean). Boys benefiting from Tayssir are on average 1 p.p (or 36%) less likely to drop out from schools. The largest absolute reductions are found for boys and girls in the highest grades.
These results appear very consistent with those ofBenhassine et al.(2015) on Tayssir pilot. Two years after the start of the program, they found a 62% reduction in dropout rate (equivalent to an annual reduction of about 31%).21 We should be cautious in com-paring their results with those presented in this paper because of the different empirical strategies.Benhassine et al.(2015) use a randomized controlled trial while in this paper we rely on a regression discontinuity design. This means that estimates inBenhassine et al.(2015) correspond to average treatment effects whereas our estimates correspond to local average treatment effects (i.e. effects that apply for children in municipalities near the eligibility cut-off but not necessarily in municipalities further away). That said, the 41% reduction we estimate is of a similar sign and magnitude, and the het-erogeneous patterns with respect to gender are fully consistent across studies. These similar results are remarkable given the expansion of the program to numerous new locations and the ten-fold increase in the number of beneficiaries. If anything, they pro-vide some reassurance regarding the ability of pilot evaluations to produce insightful estimates of at-scale impacts.
5.2
Impacts on test scores
The selection problem. Because the scores of children who drop out from school before the exam are not observed, the reduction in dropout rate documented in the previous section is likely to induce selection issues for estimates of program effects on exam scores. If dropouts are negatively selected, estimates would be biased
down-21Some children may have dropped out of school temporarily so 31% should be interpreted as a lower bound.
Figure 4: Reduced form effect on school dropout
(a) All students (b) Boys (c) Girls
Notes: Figures show a linear prediction plot of dropout rate on municipality poverty rate, run separately on each side of the normalized eligibility cut-off. The unit of observation is a student year for the schooling years 2015/16 and 2016/17. Sample restricted to students in primary school in municipalities with 2004 poverty rates in the range [20%, 40%]. Observations are sorted into bins of width of one percentage point and weighted using a triangular kernel function. The vertical lines indicate the normalized eligibility cut-off.
Source: Authors’ calculation using poverty rate from Morocco’s Haut-Commissariat au Plan and dropout data from MASSAR.
ward (more children with low test scores would take the exam in beneficiary munic-ipalities). In Table 3, we compare the characteristics of children who drop out with those of children who do not drop out. Columns 1 and 2 present the mean and stan-dard deviation (in parentheses) of dropouts and non-dropouts. Column 3 reports the standardized difference between the two groups for the whole sample, while columns 5 to 10 show the differences for each grade. The two groups are very different and negatively selected. Children who drop out from schools have, on average, a lower GPA than children who stay in school (standardized differences of -0.42 and -0.87 in t-1 and t-2 respectively),22 especially in grades where the effect of Tayssir on dropout is the largest. Dropouts are also older and more likely to have repeated grades. For example, 54.5% of the students who drop out in t repeated a grade in t-1 against only 14% for students who do not drop out. This negative selection into dropout entails that an analysis of the effects of Tayssir on exam scores using the sample of test-takers is likely to introduce a downward bias in the estimates.
To correct for this bias, we impute exam scores corresponding to different degrees of selection into dropout, which in turn can be used to provide lower and upper bounds
22Estimates in t-2 are somewhat cleaner than in t-1 because most students drop out from school during t-1 (as opposed to between the end of t-1 and the beginning t) and as a result have no GPA. Among those that drop out in t, only 14% have a GPA in t-1 against 98% in t-2.
Table 3: Descriptive statistics: selective dropout
All grades Std. diff. by grade
(1) (2) (3) (4) (5) (6) (7) (8) (9) (10)
Drop-out=1 Drop-out=0 Std. diff Observations Grade 1 Grade 2 Grade 3 Grade 4 Grade 5 Grade 6
Age 11.833 8.605 1.081 1,849,552 0.295 0.664 0.739 1.272 0.881 0.651 (2.948) (3.022) Boy 0.474 0.529 -0.111 1,849,553 0.021 -0.012 -0.003 -0.068 -0.088 -0.198 (0.499) (0.499) GPA (t−1) 5.128 5.835 -0.417 1,783,261 -0.129 -0.140 -0.157 -0.384 -0.749 -0.624 (2.074) (1.205) GPA (t−2) 4.529 5.730 -0.869 1,547,325 -0.797 -0.522 -0.678 -0.845 -0.906 -0.962 (1.553) (1.187) Repeat grade (t−1) 0.545 0.141 0.938 1,833,840 0.299 0.453 0.751 0.921 0.956 1.137 (0.498) (0.348) Repeat grade (t−2) 0.273 0.127 0.373 1,536,446 0.427 0.156 0.462 0.481 0.449 0.444 (0.446) (0.333)
Notes: The unit of observation is a student-year for the schooling years 2015/16 and 2016/17. Sample restricted to students in primary schools in municipalities with 2004 poverty rates in the range [20%, 40%]. Standard deviations are in parenthesis.
Source: Authors’ calculation using data from MASSAR.
to the true effect of Tayssir on exam scores.23 Because the overall pattern of selection documented in Table 3 is negative, we conjecture that children who drop out from school would have obtained scores on the lower end of the distribution (that is any-where below the median score), and estimate the effect of Tayssir on exam scores con-sidering two extreme scenarios. First, we assume that dropouts would have obtained a score of zero. Second, we assume that dropouts would have obtained the median score.24 Since dropouts are negatively selected, their (unobserved) exam scores should stand somewhere between these two values, and, as a consequence, estimates using these imputed values should provide lower and upper bounds to the true effect of Tayssir on exam scores.25 More specifically, because Tayssir decreased the number of dropouts, and because dropouts are negatively selected, imputing the median score bounds the effect of the program from below while imputing the score of zero bounds the effect of the program from above. In addition, to provide more transparency on our method, and to illustrate the effects associated with more intermediate patterns
23Due to data availability, we do not observe students in grade 6 during their whole primary ed-ucation and therefore do not know for each cohort the exact number of students who drop out prior to grade 6. We proxy this quantity by relying on cross-sectional dropouts, that is the total number of dropouts observed in a given year in grade 1 to 6. Because grade-specific dropout rates have been very stable over time (see TableA1), we are confident that this quantity provides a good proxy of the number of students who dropped out prior to grade 6.
24Given that girls tend to have higher scores (TableA2), we compute median scores separately for boys and girls.
25Although we believe that positive selection is unlikely, note that our results are qualitatively un-changed (and in fact reinforced) for scores imputed from the higher end of the distribution.
of selection, we estimate effects imputing scores corresponding to the 10th and 25th percentiles of the score distribution.
Results. The results on test scores with and without corrections for selective dropout are shown in Table 4. We focus here on the score obtained at the graduation exam administered to all students at the end of grade 6. This exam is managed at the provin-cial level and therefore allows to compare children from different schools and different municipalities (see Section3.2for more details).
Estimates with no correction for differential dropout rates suggest that receiving cash transfers is associated with a decrease in exam scores of 0.16 SD (column 1, panel A).26However, because of the downward bias documented above, it is not clear whether this estimate is due to a selection bias or to a genuine effect of cash transfers. Looking at impacts by gender, we find that negative effects are concentrated within the sample of boys (column 1, panels B and C). This result is interesting because boys are less af-fected by the reduction in dropout rate induced by Tayssir (see Section5.1) and should therefore be less affected by the selection bias highlighted above.27 If anything, this suggests that negative estimates in column 1 are not entirely driven by selection issues and must in part reflect a genuine negative effect of cash transfers.
Estimates using the imputation method described above are presented in columns 2 to 5 of Table4. Among the full sample of children, we estimate an effect somewhere between -0.03 SD and -0.14 SD (only significant at the lower end of the interval).28 The results also suggest interesting gender dynamics. For boys, we estimate negative ef-fects between 0.10 SD and 0.18 SD (panel B). These efef-fects are generally significant at conventional levels, except for the most severe correction which imputes the score of zero to all dropouts. For girls, we estimate bounds that are well distributed around zero: we find a lower bound of -0.09 SD, an upper bound of 0.07 SD, and coefficients
26The reduced-form estimate is shown in FigureA4a.
27In Table A8, we show that the patterns of negative selection into dropout are consistent across gender. Standardized differences between dropouts and non-dropouts are similar for boys and girls (column 3). In particular, children who eventually drop out have lower GPA and are more likely to have repeated a grade prior to dropout.
Table 4: Effect of Tayssir on test scores
Dep. Var. standardized graduation score
(1) (2) (3) (4) (5)
diff. drop-out: No correction Correction
imputed score: 0 p10 p25 p50
Panel A. All children
LATE -0.163** -0.025 -0.059 -0.106 -0.141** (0.078) (0.073) (0.069) (0.066) (0.064) Mean -0.000 -0.353 -0.235 -0.097 0.016 Observations 279,880 335,419 335,419 335,419 335,419 Panel B. Boys LATE -0.210*** -0.100 -0.132* -0.155** -0.180*** (0.079) (0.073) (0.070) (0.068) (0.067) Mean -0.069 -0.368 -0.247 -0.155 -0.062 Observations 151,024 176,734 176,734 176,734 176,734 Panel C. Girls LATE -0.097 0.066 0.027 -0.039 -0.086 (0.085) (0.079) (0.075) (0.070) (0.070) Mean 0.080 -0.335 -0.223 -0.032 0.102 Observations 128,856 158,685 158,685 158,685 158,685 Notes: This table reports local average treatment effects of Tayssir cash transfers (Eq. 1in the text). Sample restricted to grade 6 students. The dependent variable is the standardized graduation score obtained at the end of grade 6. Column 1: results with no correction for differential dropout rates. Columns 2 to 5: results imputing scores corresponding to different degrees of selection into dropout (column 2: upper bound of the true effect; column 5: lower bound of the true effect). See notes to Table2for other details. *** p<0.01, ** p<0.05, * p<0.1.
Source: Authors’ calculation using data from MASSAR and Haut-Commissariat au Plan.
that are never statistically different from zero (panel C). Overall, the estimates in Table
4 suggest that Tayssir cash transfers did not lead to learning gains in primary school and actually had negative effects on the test scores of boys. The next paragraphs dis-cuss why these disappointing effects may have emerged.
Discussion. Few studies of conditional cash transfers have measured effects on learn-ing, but when they did, they typically found effects that are not statistically different from zero (Behrman et al., 2005; Baez and Camacho, 2011; Filmer and Schady, 2014;
Barham et al., 2018; Baird et al., 2019; Dustan, 2020).29 However, given the
method-29There are two notable exceptions.Barham et al.(2017) in Nicaragua compare groups that randomly received transfers for a 3-year period at different points in time and find that males in the early treatment group experienced learning gains of about 0.20 SD on mathematic and Spanish tests.Duque et al.(2019) in Colombia find that children eligible to the national CCT program Familias en Acción scored 0.13 SD higher at the secondary school graduation test.
ological challenges to analyze cumulative processes such as learning outcomes, it is not obvious whether these non-significant estimates should be interpreted as a lack of effect of CCT programs. In these studies, the estimates correspond to the effects of relatively limited exposure to transfers since the programs were rapidly expanded to the control group or were discontinued after the evaluation period (for example, the differential exposure in Mexico’s PROGRESA randomized evaluation was 18 months). Our results add to the literature by showing that continued exposure during whole primary school in Morocco did not lead to significant improvements in test scores at the primary school graduation exam and in fact reduced the scores of boys by between 0.10 and 0.18 SD.
Different mechanisms could be driving these results.30 First, the higher number of children attending school may increase class size and put additional pressure on existing educational resources. This channel may be particularly relevant in our set-ting because Tayssir was targeted towards poor rural municipalities. Such targeset-ting strategy entails that the extra influx of students was confined to limited geographical areas where school quality and resources to absorb the additional students were likely modest. Second, transfers could also have affected class composition, retaining lower ability students. This could have had negative effects on learning through peer effects and less effective teaching practices. In particular, higher heterogeneity in class com-position may have led to instruction that was less tailored to the needs of students.31 Third, there is growing evidence from the broader literature on the evaluation of social programs that transfers are very often used to make productive investments and can thereby increase economic activities in beneficiary households (for a review, seeBaird et al., 2018). While this could reduce child labor through an income effect, in prac-tice, several recent studies document sizable increases in child labor (Avitabile et al.,
30We focus here on the mechanisms that could drive negative effects. Nonetheless, there may be other effects running in the opposite direction. For example, transfers could improve learning through increased investments in complementary inputs such as food, school supplies, and parental time. These effects could emerge either directly using the transfers (Fiszbein and Schady,2009) or indirectly through an information effect signaling the value of education (Benhassine et al.,2015). The conditionality on attendance could also lead to more learning for children who do not attend school regularly.
31A related literature has shown that tracking students into separate classes by prior achievement typically benefit to children at all levels of the distribution (see e.g.Duflo et al.,2011).
2019; de Hoop et al., 2020; Edmonds and Theoharides, 2020). Because of the strong norms against the use of girls labor in rural Morocco, this channel may help to explain why negative effects were concentrated within the sample of boys. However, we find this explanation somewhat unlikely as transfers remained relatively small compared to household spending: transfers in primary school were equivalent to between 6 and 10% of the average spending per capita. In addition, there is evidence that cash trans-fers that are conditional on schooling typically decrease child labor (De Janvry et al.,
2006;Attanasio et al.,2010;De Hoop and Rosati,2014).
One channel of impact that we can test using our data is whether the transfers affected learning through an increase in class size in beneficiary areas. To the best of our knowledge, this channel has never been studied in the context of cash transfer programs. We first look at the effect of the program on class size and then use an IV strategy to estimate the effect of the variation in class size induced by the program on test scores. Table 5 shows that the program had a positive impact on class size (panel A).32 In particular, Tayssir increased class size by as much as 3.6 students in grade 6 (column 6), which corresponds to 12 percent of the average class size in the sample (30.7 students). Looking at effects by grade, we find that higher grades were associated with larger increases, with the exception of grade 1. Large effects in grade 1 could reflect the fact that children in targeted municipalities started school earlier (possibly to benefit from the transfers) and repeated grade 1 more often.33 In TableA9, we use an IV strategy to examine whether this increase in class size had negative effects on test scores. More specifically, we estimate a fuzzy RD where we instrument class size by the eligibility cutoff.34 Importantly, we apply the same strategy as above to correct for differential dropout rates (columns 2 to 5). We find that the increase in class
32In contrast, the program had small and non-significant effects on the probability to repeat grades and to change school, suggesting that these other intermediary outcomes are unlikely to explain effects on test scores. See figuresA5for reduced-form estimates.
33There is some evidence in Table5that Tayssir increased the probability of repeating grade 1 (panel B, column 1).
34We replace Tayssir by the variable class_size in Eq. 1. We derive this variable using data at the school level and dividing for each grade the number of students by the number of classes. We do not have information on class size for the 15,243 students (or less than 0.83 percent of the sample) who moved to municipalities outside the sample.
size induced by Tayssir had negative effects on test scores, especially within the sample of boys: increasing class size by one student led to test scores 0.03 to 0.05 SD lower in beneficiary municipalities. Given the estimated first-stage increase of 3.6 students (in grade 6, i.e. when students take the exam), this result suggests that the increase in class size induced by the program led to a total reduction in test scores comprised between 0.11 and 0.18 SD for boys.
Table 5: Effect of Tayssir on class size, grade repetition, and school change
(1) (2) (3) (4) (5) (6) (7)
Grade 1 Grade 2 Grade 3 Grade 4 Grade 5 Grade 6 All Grades Panel A. Effects on class size
LATE 2.805*** 1.056 1.679** 1.744** 1.803** 3.599*** 2.132***
(0.846) (0.706) (0.713) (0.703) (0.857) (0.887) (0.526) Mean class size 30.076 29.136 29.689 29.440 29.319 30.682 29.738 Observations 330,981 303,193 301,795 291,416 283,863 307,908 1,819,156 Panel B. Effects on grade repetition
LATE 0.013* 0.000 -0.005 -0.011 -0.011 0.010 0.001
(0.007) (0.008) (0.010) (0.010) (0.010) (0.021) (0.006)
Mean grade repetition 0.188 0.143 0.152 0.133 0.128 0.206 0.159
Observations 333,225 305,730 304,358 293,988 286,277 310,821 1,834,399 Panel C. Effects on school changes
LATE 0.000 0.003 0.003 0.010 0.005 0.023 0.002
(0.004) (0.006) (0.006) (0.009) (0.006) (0.020) (0.006)
Mean change school 0.030 0.040 0.037 0.045 0.032 0.695 0.148
Observations 333,225 305,730 304,358 293,988 286,277 310,821 1,834,399 Notes: This table reports local average treatment effects of Tayssir cash transfers (Eq. 1in the text). Each row in this table represents a separate outcome variable. Class size corresponds the average number of students by class. Grade repetition (resp. school change) is a dummy variable coded one if a student repeats a grade (resp. moved to a different school). See notes to Table2for more details. *** p<0.01, ** p<0.05, * p<0.1.
Source: Authors’ calculation using data from MASSAR and Haut-Commissariat au Plan.
In summary, the results presented in this section help to explain why the program had limited effects on test scores and why negative effects were observed within the sample of boys. They provide evidence that Tayssir constrained learning by putting additional pressure on existing educational resources in beneficiary municipalities. These findings are consistent with evidence that school resources have an important role to play in shaping educational attainment (see e.g.Holmlund et al.,2010;Gibbons et al.,2018), but contrast with those ofLucas and Mbiti(2012),Blimpo et al.(2019) and
Valente (2019) who showed that increased enrollment following policies eliminating school fees in sub-Saharan Africa did not generate negative effects on test scores. This latter result may be explained by the expansion of private education which followed
the removal of public school fees and by the increased socio-economic sorting of stu-dents into schools (Bold et al.,2015) – a mechanism that is less likely to operate in our setting because private education is generally absent in rural Morocco.
5.3
Impacts on educational attainment
In Table6, we explore program effects on educational attainment by focusing on two dummy variables indicating whether a child (i) graduates from primary school, and (ii) enrolls in secondary school (see Section 3.2 for more details on the definition of these variables). We take into account the issue of selection into dropouts by imputing the value of zero to both of these variables for dropouts (who by definition do not graduate from primary school or enroll in secondary school). We present effects with and without corrections for more transparency. Figures A6 and A7 show reduced-form estimates. Without corrections, we find small and non-significant effects on both graduation and enrollment (columns 1 and 3). Correcting for differential dropout, the overall effect on graduation remains non-significant in the full sample (column 2, panel A), but looking at effects by gender we find a 5.7 p.p. increase for girls (significant at 5%). This corresponds to an increase of 9% relative to the sample mean of 65.3%. In contrast, we see no significant improvements for boys, which likely reflect the negative effects on test scores highlighted above. Regarding enrollment in secondary school, we find that the program led to a significant increase once we correct for differential dropout (column 4). Overall, we estimate that the program increased enrollment by 4.5 p.p. (panel A), which is equivalent to a 7% increase relative to the sample mean of 63.8%. We estimate non-significant for boys (panel B) but sizable effects for girls (7 p.p. or 11% relative to the sample mean of 64.4%, panel C).
Table 6: Effect of Tayssir on educational attainment
dep. var.: Graduation Enrollment
from primary school in secondary school
(1) (2) (3) (4)
diff. drop-out: No correction Correction No correction Correction Panel A. All children
LATE -0.023 0.020 0.007 0.045** (0.029) (0.026) (0.021) (0.021) Mean 0.765 0.638 0.765 0.638 Observations 278,739 334,299 278,739 334,299 Panel B. Boys LATE -0.044 -0.009 -0.005 0.024 (0.035) (0.031) (0.026) (0.024) Mean 0.732 0.625 0.742 0.633 Observations 150,390 176,112 150,390 176,112 Panel C. Girls LATE 0.007 0.057** 0.024 0.070*** (0.025) (0.024) (0.019) (0.020) Mean 0.805 0.653 0.793 0.644 Observations 128,349 158,187 128,349 158,187
Notes: The table reports local average treatment effects of Tayssir cash transfers (Eq. 1in the text). Sample restricted to grade 6 students. Graduation from primary school: dummy variable coded one if a student in grade 6 graduates from primary school. Enrollment in secondary school: dummy variable coded one if a student in grade 6 is enrolled in secondary school the following year. See notes to Table2
for other details. *** p<0.01, ** p<0.05, * p<0.1.
Source: Authors’ calculation using data from MASSAR and Haut-Commissariat au Plan.
6
Conclusion
The invention and spread of conditional cash transfer programs in the past few decades have been described as “perhaps the most remarkable innovation in welfare programs in de-veloping countries” (Cahyadi et al., 2020). Despite robust evidence on the static gains of these programs, only a few studies have analyzed their impacts on cumulative pro-cesses such as learning. In this paper, we showed that CCT in Morocco did not lead to learning gains in primary school and actually had negative effects on boys’ test scores. Unlike most previous studies, which evaluated relatively limited exposures to cash transfers and found non-significant results, in this paper we focused on effects corre-sponding to an exposure during whole primary school. This allows us to provide new evidence on whether the enrollment gains from CCT programs are likely to eventually translate into sustained learning gains. Overall, we find that the program constrained learning by putting additional pressure on existing educational resources. We identify
a sizable and positive impact of the program on class size which in turn had nega-tive effects on graduation scores. In particular, we estimate that the test scores of boys decreased by 0.03 to 0.05 SD for each extra student in the classroom.
Naturally, these findings should in no way be interpreted as evidence that policy makers should not pursue CCT programs. Such programs, including the one studied in this paper, have been particularly effective at increasing access to basic education (a necessary first step to increase learning). However, our results, together with evidence showing that students in developing countries have alarmingly low literacy and nu-meracy levels (Bold et al.,2017;World Bank,2018), suggest that the gains in attendance from CCT programs are unlikely on their own to equip students with the foundational skills they need. In fact, our results show that CCT programs can have adverse effects on learning when schools are not provided with the necessary resources to absorb the extra influx of students.
The past two decades have seen a surge in evalutions focusing on the learning ef-fects of various interventions in developing countries (for recent reviews seeMcEwan,
2015; Ganimian and Murnane, 2016; Glewwe and Muralidharan, 2016; Masino and Niño-Zarazúa, 2016;Conn, 2017;Evans and Mendez Acosta,2020). Although the evi-dence base does not allow to identify programs that are effective in all contexts (World Bank,2018), some lessons have emerged over the years, andEvans and Popova(2016) in particular identified two classes of interventions that have been very consistent at improving learning: (i) pedagogical interventions that tailor teaching to student learn-ing; (ii) individualized and sustained efforts to improve teacher’s ability and practice. An interesting question for future research – and a promising avenue for policy makers aiming to address the learning crisis – would be to explore the possible complementar-ities between these interventions and CCT programs. Indeed, recent evidence suggests that combining different education interventions may produce effects that are greater than the sum of their individual effects (Mbiti et al.,2019).