Publisher’s version / Version de l'éditeur:
Questions? Contact the NRC Publications Archive team at
[email protected]. If you wish to email the authors directly, please see the first page of the publication for their contact information.
https://publications-cnrc.canada.ca/fra/droits
L’accès à ce site Web et l’utilisation de son contenu sont assujettis aux conditions présentées dans le site LISEZ CES CONDITIONS ATTENTIVEMENT AVANT D’UTILISER CE SITE WEB.
Research Report (National Research Council of Canada. Institute for Research in
Construction), 2002-12-01
READ THESE TERMS AND CONDITIONS CAREFULLY BEFORE USING THIS WEBSITE. https://nrc-publications.canada.ca/eng/copyright
NRC Publications Archive Record / Notice des Archives des publications du CNRC :
https://nrc-publications.canada.ca/eng/view/object/?id=72dfe238-7b4a-40e3-9c17-5563bf1f7ee5 https://publications-cnrc.canada.ca/fra/voir/objet/?id=72dfe238-7b4a-40e3-9c17-5563bf1f7ee5
NRC Publications Archive
Archives des publications du CNRC
For the publisher’s version, please access the DOI link below./ Pour consulter la version de l’éditeur, utilisez le lien DOI ci-dessous.
https://doi.org/10.4224/20378684
Access and use of this website and the material on it are subject to the Terms and Conditions set forth at
Benchmarking of IRC's Advanced Hygrothermal Model - hygIRC Using
Mid- and Large-Scale Experiments
Benchmarking of IRC’s Advanced Hygrothermal Model – hygIRC
Using Mid- and Large-Scale Experiments
Maref, W.; Lacasse, M.A.; Booth, D.G.
IRC-RR-126
December 2002
IMPORTANT NOTICE TO READERS
The main emphasis of the MEWS project was to predict the hygrothermal responses of several wall assemblies that are exposed to North American climate loads, and a range of water leakage loads. Researchers used a method based on both laboratory experimentation and 2-D modeling with IRC’s benchmarked model, hygIRC. This method introduced built-in detailing deficiencies that allowed water leakage into the stud cavity - both in the laboratory test specimens and in the virtual (modeling) “specimens”- for the purpose of investigating water entry rates into the stud cavity and the drying potential of the wall assemblies under different climate loads. Since the project was a first step in investigating a range of wall hygrothermal responses in a parametric analysis, no field study of building characteristics was performed to confirm inputs such as water entry rates and outputs such as wall response in a given climate. Rather, ranges from ‘no water entry and no response’ to ‘too much water entry and too wet for too long’ were investigated.
Also, for the sake of convenience, the project used the generic cladding systems (e.g., stucco, masonry, EIFS, and wood and vinyl siding) for labeling and reporting the results on all wall assemblies examined in the study. However, when reading the MEWS publications, the reader must bear in mind that the reported results are more closely related to the nature of the deliberately introduced deficiencies (allowing wetting of the stud cavity) and the construction details of the wall systems investigated (allowing wetting/drying of the assembly) than to the generic cladding systems themselves. As a general rule, the reader must assume, unless told otherwise, that the nature of the deficiencies and the water entry rates into the stud cavity were different for each of the seventeen wall specimens tested as well as for each of the four types of wall assemblies investigated in the modeling study. For this reason, simply comparing the order of magnitude of results between different cladding systems would take the results out of context and likely lead to erroneous conclusions.
Report from Task 6A-2 and Task 7 of MEWS Project
Task 7 - Benchmarking of IRC’s Advanced Hygrothermal
Model-hygIRC – T7-09
Dr. Wahid Maref, Dr. Michael Lacasse and Daniel Booth December 2002
TABLE OF CONTENTS
1 INTRODUCTION... 1
2 HYGIRC - HYGROTHERMAL SIMULATION MODEL... 2
3 PREVIOUS WORK ON B ENCHMARKING SIMULATION MODELS ... 4
4 EXPERIMENTAL DESIGN ... 5
4.1 APPROACH...5
4.2 EQUIPMENT, MATERIALS AND ASSEMBLIES...7
4.2.1 Materials ... 7
4.2.2 Specimen assemblies ... 7
4.3 SPECIMEN PRE-CONDITIONING...11
4.3.1 Mid-Scale Specimens ...11
4.3.2 Full-scale specimens...11
5 RESULTS AND DISCUS SIONS ...12
5.1 MID-SCALE RESULTS...12
5.1.1 Mid-scale results: Set 1 ...12
5.1.2 Mid-scale results: Set 2 ...14
5.1.3 Mid-scale results: Set 3 ...19
FULL-SCALE EXPERIMENT RESULTS AND VERIFICATIONS...22
5.2.1 Full-scale results: Set 1 ...22
5.2.2 Full-scale results: Set 2 ...22
5.2.3 Full-scale results: Set 3 ...23
5.2.4 Full-scale results: Set 4 ...24
6 CONCLUDING REMARKS ...25
7 ACKNOWLEDGEMENTS ...25
LIST OF TABLES
Table 1 – Description of test materials and relevant properties... 8 Table 2 –Mid-scale experimental sets and related material combinations and test conditions... 8 Table 3 – Full-scale experimental sets, related test materials combinations conditions ... 9
LIST OF FIGURES
Figure 1 – Step-wise approach for experimental stages to evaluate the AHM ... 6
Figure 2 – Configuration of full-scale wall assembly specimens: Sets 1 to 4. ... 10
Figure 3 – Comparison of simulated and measured drying results assembly... 13
Figure 4 – Simulated drying results for each layer [Dry/Wet/Dry] OSB... 13
Figure 5 – Comparison of simulated and measured drying results of OSB layer... 16
Figure 6 – Comparison of simulated and measured drying results of OSB layer (The OSB was wrapped on both sides with membrane III)... 16
Figure 7– Comparison of simulated and measured drying results of OSB layer (The OSB was wrapped on both sides with membrane II) ... 17
Figure 8 – Comparison of simulated and measured drying results of OSB layer (The OSB was wrapped on both sides with membrane X) ... 17
Figure 9 – Comparison of simulated and measured drying results of OSB layer (The OSB was wrapped on both sides with membrane VII)... 18
Figure 10 – Comparison of simulated and measured drying results of OSB layer (The OSB was wrapped on both sides with membrane V)... 18
Figure 11 – Comparison of simulated and measured drying results [OSB only- Specimen 4] .... 20
Figure 12 – Comparison of the simulated and measured drying results [OSB only - specimen 5] ... 20
Figure 13 – Comparison of the simulated and measured drying results of OSB layer (The OSB was wrapped on the both sides with membrane III) ... 21
Figure 14 – Comparison of the simulated and measured drying results of OSB layer (The OSB was wrapped on the both sides with membrane VII)... 22
Figure 15 – Set 1: Comparison of the simulated and measured drying results of OSB layer... 23
Figure 16 – Set 2: Comparison of the simulated and measured drying results of OSB layer... 23
Figure 17 – Set 3:Comparison of the simulated and measured drying results of OSB layer... 24
MEWS PROJECT REPORT T7- 09: December 2002
TASK 7 - BENCHMARKING EXERCISE OF hygIRC- T7- 09
IRC Research Team
Peter Beaulieu
Mostafa Nofal
Mark Bomberg
Nicole Normandin
Steve Cornick
Mike Nicholls
Alan Dalgliesh
Tim O’Connor
Guylaine Desmarais
David Quirt
Reda Djebbar
Madeleine Rousseau
Kumar Kumaran
Nady Said
Michael Lacasse
Mike Swinton
John Lackey
Fitsum Tariku
Wahid Maref
David van Reenen
Phalguni Mukhopadhyaya
MEWS Steering Committee
David Ritter, Louisiana Pacific Corporation Eric Jones, Canadian Wood Council Fred Baker, Fortifiber Corporation Gary Sturgeon, Masonry Canada Michael Bryner, EI DuPont de Nemours & Co Sylvio Plescia, CMHC
Gilles Landry, Fiberboard Manufacturers Association of Canada
Fadi Nabhan, IRC, NRC Canada
Stephane Baffier, CPIA David Quirt, IRC, NRC Canada Paul Morris, Forintek Canada Corporation Kumar Kumaran, IRC NRC Canada Greg McManus, Marriott International Inc. Michael Lacasse, IRC NRC Canada Stephan Klamke, EIMA
B
ENCHMARKI NG OFI RC'
SA
DVANCEDH
YGROTHERMALM
ODEL–
HYGI RC U
SI NGM
I D-
ANDL
ARGE-
SCALEE
XPERI MENTSREPORT OVERVIEW
Recent research in the field of assessment of hygrothermal response has focused on either laboratory experimentation or modelling, but less work has been reported in which both aspects are combined. Such type of studies can potentially offer useful information regarding the benchmarking of models and related methods to assess hygrothermal performance of wall assemblies. An advanced hygrothermal computer model called hygIRC was used to assess the hygrothermal response of wood sheathing board, a key component of wood-frame wall assemblies. hygIRC uses hygrothermal properties of materials derived from tests on small-scale specimens undertaken in the laboratory. The intent of this work was to obtain experimental results on the hygrothermal the response of the wood sheathing, included in both mid- and full-scale wall assemblies, when subjected to nominally steady-state environmental conditions. The drying rates of wall assemblies featuring several different membranes in contact with the wood sheathing were determined from experiments undertaken in a controlled laboratory setting. These results were subsequently compared to those obtained using hygIRC as a means of helping benchmark the simulation model. Conclusions from these studies are definite: in both mid and full-scale test, results from simulation compare very favourably with those obtained from the experiment. This realistically suggests that the model adequately emulates the hygrothermal response of specific wood-frame assembly components, such as wood sheathing, over a wide range of scales for the environmental conditions to which it was subjected in the experiments. These results further enhance confidence towards the implementation of hygIRC in broader based parametric studies.
Benchmarking of I RC's Advanced Hygrothermal Model
Introduction
Assessing the performance of new building materials, components or systems typically requires extensive laboratory testing or, in some instances, elaborate and time-consuming field trials. Thorough analyses of the hygrothermal behaviour of, for example, wall systems in response to different climatic loads is not usually part of the assessment process. Whereas laboratory and field experiments are often too selective and time consuming, a practical means of assessing the response of wall systems to changing environmental loads is accessible through the use of hygrothermal simulation models. Simulation models can accommodate a variety of changing boundary conditions and as well, result in much faster analysis, given the recent advances in computer technology that have permitted ready access to enhanced computing performance. This in turn has brought about an increased emphasis on the use of numerical methods to solve the fundamental hygrothermal equations that form the basis for many of the mathematical models developed over the past decade. Depending upon the complexity of the problem under consideration, such models can be based on very simple, one-dimensional, steady state methods or on more complex, two and three-dimensional, transient methods. However, acceptance of results derived from simulation models is contingent upon acquiring evidence of a response comparable to that obtained from experimental work when the simulation is carried out under the same nominal environmental loads. Studies that incorporate both laboratory experimentation and simulation thus offer possibilities to compare results and hence ‘benchmark’ the response of the model to known conditions.
Researchers at the Institute for Research in Construction (IRC), jointly with those from the Technical Research Centre of Finland (VTT Finland), have been developing advanced hygrothermal models for the past fifteen years. Some of the joint activities were reported earlier [Ojanen et. al., 1994, Ojanen and Kumaran, 1995 & 1996, Karagiozis et. al. 1995, Salonvaara and Karagiozis 1998].
The current version of the hygrothermal model that is used at IRC is called hygIRC [Kumaran, 2002]. hygIRC is built around well-known heat, air and moisture transport equations (Fourier’s law of heat conduction, Fick’s law of diffusion of matter and Darcy’s law of fluid flow as well as Navier-Stokes equations) and corresponding equations that define the conservation of energy, mass and momentum. A two-dimensional cross-section of the envelope components is represented by a matrix of several hundreds of closely packed rectangular elements, the sum of which constitutes the computational domain of the ensemble.
on the temperature and relative humidity distributions within the wall assembly and the changes in these with time. The data can be sampled at any desired time interval and visualised using post-processing graphic software. Reviewing the output in this manner readily permits identifying locations within the assembly that may be subjected to high moisture conditions over prolonged periods of time. As well, it permits a rapid assessment of the extent to which the simulation may emulate experimental results.
The governing equations listed below will show that the approach adopted in hygIRC in deriving the balance equations from the phenomenological equations is evolved from the approaches used earlier by Kohonen in TRATMO I [Kohonen 1984] or by Ojanen in TCCC2D [Ojanen and Kumaran 1992, 1996]. The report of the International Energy Agency annex 24 [Hens, 1996] is also a useful source of information in which the equations used in hygIRC are explained.
Several applications of the hygrothermal model during its development have been reported earlier [Salonvaara and Karagiozis, 1994, Karagiozis & al., 1995, Karagiozis and Kumaran, 1997]. hygIRC is extensively used at IRC as the primary analytical tool to conduct parametric studies to assess the hygrothermal performance of various wall assemblies exposed to different climatic conditions in North America.
This report presents the governing equations implemented in hygIRC and a series of drying experiments on oriented strand board (OSB) alone or in combination with different sheathing membranes designed to benchmark the model. It also presents preliminary results from a series of simulations in which the shape of the drying curve and the time taken to establish the equilibrium moisture content are determined and compared with the experimental results.
hygIRC - Hygrothermal Simulation Model
The governing equations implemented in hygIRC are given below. The moisture transport potentials used in the model are moisture content (MC) and vapour pressure (VP); for energy transfer, temperature is the driving force.
Moisture balance
( )
= −∇{
• + •}
∂ ∂ v m l m t u o ?( )
3 2 1 4 43 4 42 1 airflow Vapor diffusion Vapor a V v ? v P T u p d mv -, ∇ + − = •( )
43
42
1
4
4 3
4
4 2
1
flow gravity Liquid diffusion Liquidw
(u)?
w
k
u
T
u
w
D
o
?
m
l•=
−
,
∇
+
g
With(
)
u S T u D ? w k w o ∂ ∂ = , Energy balance( )
( )
(
)
4 4 3 4 4 2 1 4 4 4 4 3 4 4 4 4 2 1 4 43 4 42 1 4 4 4 4 3 4 4 4 4 2 1 r heat / heat on condensati n / Evaporatio . . thaw Freeze conduction Heat heat convected Airflow t f u o ? ice L v P T) (u, p o ? v L T T) (u, T a V (T) a p C T a t T T) (u, p C T u, T ? l ∂ ∂ − ∇ ∇ + ∇ ∇ + ∇ − = ∂ ∂ δ λ ρu
Moisture content kg (moisture)/kg (dry material) -(%)•
l
m
Liquid moisture mass flow rate (kg/s)/m2•
v
m
Vapor moisture mass flow rate (kg/s)/m2 wk Liquid moisture permeability (kg/m s Pa)
S
Capillary suction pressure (Pa)v
P Vapor moisture pressure (Pa)
T Temperature (K)
t
Time (s)a
Vr Air velocity vector (m/s)
o
?
Density of the dry porous material (kg/m3)v
?
Vapor moisture partial density (kg/m3)w
?
Liquid moisture partial density (kg/m3)w
D Liquid moisture diffusivity (m2/s)
p
d Vapor water permeability (kg/ m s Pa)
gr Gravitational vector (m/s2)
p
C Effective specific heat capacity (J/kg K) a
p
C Dry-air specific heat capacity (J/kg K)
l
f
Liquid fraction having a value from 0 to 1λ
Effective thermal conductivity (W/m K) vL Enthalpy of evaporation/condensation (J/kg) ice
L Enthalpy of freeze/thaw (J/kg)
T
?
Actual total density of the material including moisture contribution (kg/m3)Previous Work on Benchmarking Simulation Models
There are some known attempts at providing validation of simulation models, notably from the combined efforts of the IEA Annex 24 (Hens 1996) and more recently, from work carried out in Norway at the Norwegian University of Science and Technology (Geving and Uvsløkk 2000).
The work carried out during the IEA Annex 24 focused on using inter-model comparison as one of three possible means identified to provide validation of simulation models; the other two being analytical and empirical verifications, respectively. Analytical verification, recognised as being useful for testing algorithms, but was not attempted and empirical verification was only tried for limited applications. Because of the difficulties in obtaining detailed results from experiments, verifications were restricted to summing up mass quantities such as total moisture content and amounts of condensed moisture, and thermal values such as fluxes and total energy flow. Although these comparisons provided insight into the applicability of the different models, no straightforward validation through experimentation was completed. It was however suggested that more rigorous validation through well-controlled experimentation should form the basis for future work in this area.
Geving and Thue (1996) took actual measurements and performed computer simulations of lightweight roofs from which a comparison was made between experimental results and simulations undertaken on a number of different models. Comparison was made between the moisture content at a specific location in a given wood component derived from the experiment and that obtained from the simulation. In none of the cases was there complete agreement between results for moisture content of the components obtained from either method and no explanations were provided as to why the discrepancies occurred.
Geving and Karagiozis (1996) reported on field measurements and computer simulations of the hygrothermal performance of wood frame walls in which temperature and moisture content were measured at various locations in the wall assembly. It was conjectured that the ‘overall trend’ was in good agreement between measurements and model predictions of moisture contents in wooden components although the most significant lack of agreement was the higher values obtained from simulation in the early winter period. It was noted, however, that there existed many difficulties related to simulating field experiments in particular, modelling an adequate representation of the imperfections inherent in the real structure as well as uncertainties in the input data.
The task of validating simulation models is both difficult and time-consuming without appropriate tools from which, at least, an overall assessment of the degree to which the model reproduces the experimental results can rapidly be ascertained. It was to this end
that a weighing system was conceived that would measure changes in the total weight of any given specimen over a test period. This unique system allowed us to continuously monitor the drying of the various samples (Maref & al, 2002).
This report describes the design of, and experimental results derived from, a precision weighing system for full-scale wall assemblies. The system is capable of weighing 2.5-m x 2.5-m walls having nominal weights of up to 250 kg roughly to the nearest gram continuously over a test period. The weight data has been used to determine weight loss over time in wood sheathing affixed to a wood-frame wall assembly when exposed to controlled laboratory conditions. The data was used as a basis to benchmark hygIRC. Details regarding the design and operation of the device are provided, as well as result derived from drying experiments.
Experimental design
A series of experiments have been conducted to gather data on the drying rate of full-scale wood-frame wall assemblies as well as wall components subjected to controlled steady and transient state conditions. The experimental work was designed to achieve two main objectives;
1. Measure the overall hygrothermal behaviour of wood-based components in wood-frame construction when subjected to steady and transient state hygrothermal conditions in a controlled laboratory environment; and
2. Validate the model prediction of the drying rate of wood-based components.
1.1 Approach
To achieve the objectives, the experimental work consisted of testing both mid-scale and full-mid-scale experiments. As well, in order to verify experimental results and develop a basis for validation of the hygIRC, extensive use of the model was made. The hygIRC model was used to develop the experimental details by simulating conditions to which materials components and assemblies were subjected prior to testing, and thereafter, provided information as to measured response of the various proposed test assemblies.
An overview of the different stages being proposed in the evaluation program is provided in Figure 1. In the first step the drying of mid-scale test specimens (0.8-m x 1.0-m) were monitored. The advantage of testing these specimens was to establish data acquisition protocols and determine the wetting procedure for wood components.
The mid-scale series included not only OSB sheathing but also combinations of OSB in contact with different water resistive barrier (WRB) materials or other materials for which an understanding of the hygrothermal response is essential for proper assessment of the overall response of walls.
Figure 1 – Step-wise approach for experimental stages to evaluate the AHM
The full-scale series were made of wall assemblies having dimensions of 2.43 x 2.43-m. The test was carried out in controlled laboratory conditions over a period of time sufficiently long as to permit quantifying gravimetrically, the change, and rate of change, in the total moisture content (drying) of critical wall assembly components. The experimental results were compared to those predicted by hygIRC model and were reported by Maref & al (2002 & 2003) and in MEWS Technical reports: T7-04, T7-07 and T708.
The full-scale tests were preceded in a series of steps, each step comprised of evaluating the hygrothermal response of a full-scale specimen to specified laboratory controlled conditions. The initial step consisted of determining the response of a single sheet of OSB to specified conditions whereas each subsequent step had an increased level of complexity in regard to the number of assembly components being modelled and for which data was to be reconciled with the experiment.
This step-wise approach permitted gaining a better understanding of the relative contribution of each component to key hygrothermal effects. In this way, complex assemblies of components were analysed and their hygrothermal response to steady or transient state climatic conditions characterised in relation to that simulated using hygIRC.
1.2 Equipment, materials and assemblies
A brief description of the test equipment used in these tests is provided in Appendix A. A more complete overview on this is provided in MEWS Technical Reports T6-01-R1 to T6-01-R4 (Maref and al).
1.2.1 Materials
The relevant physical properties of the materials used in both mid- and full-scale experimental sets are provided in Table 1. The first set of mid-scale experiments included an OSB having 9.5-mm thickness whereas all subsequent experimental sets, either mid- or full-scale, used an OSB of greater thickness (11.5-mm). The thinner board in the initial set was used such that drying times could be minimised and the subsequent set started as soon as possible. The relevant hygrothermal characteristics of both of these materials are provided in MEWS Technical reports T3-01 to T3-18 (for specific details refer to list of reports included in references).
1.2.2 Specimen assemblies
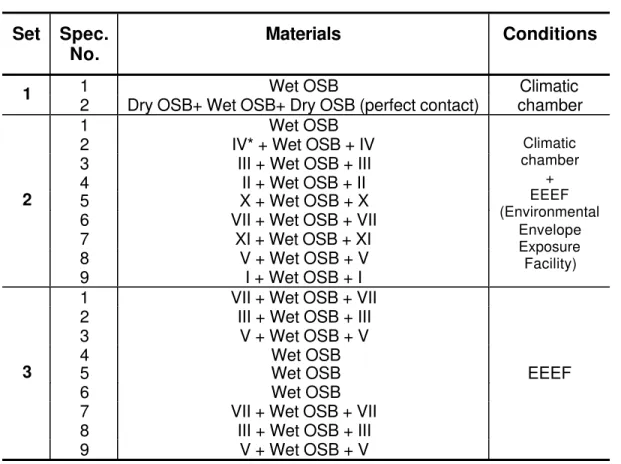
The material components and initial exposure conditions of the different test specimens for both mid- and full-scale tests are provided in Tables 2 and 3, respectively. Three sets of specimens were assessed in the mid-scale tests (Table 2) whereas four sets of full-scale specimens were evaluated in this latter test series (Table 3).
Step 1 Outdoo Indoo Single Panel -OSB Sheathing Step 6 Indoo Outdoo Step 2 Step 3 Step 4
Single Panel - OSB Sheathing De-Coupled + Membrane
OSB - Coupled + Membrane
Table 1 – Description of test materials and relevant properties
Item
No.
Component
Description
Characteristic Properties
Density (kg/m
3)
Thickness (mm)
1 Sheathing OSB-1 650 9.5 2 Sheathing OSB-2 650 11.5 3 Membrane IV 800 0.35 4 Membrane III 870 0.23 5 Membrane II 810 0.21 6 Membrane X 670 0.10 7 Membrane VII 464 0.14 8 Membrane V 715 0.72 9 Membrane I 288 0.30Table 2 –Mid-scale experimental sets and related material combinations and test conditions
Set
Spec.
No.
Materials
Conditions
1 Wet OSB
1
2 Dry OSB+ Wet OSB+ Dry OSB (perfect contact)
Climatic chamber
1 Wet OSB
2 IV* + Wet OSB + IV
3 III + Wet OSB + III
4 II + Wet OSB + II
5 X + Wet OSB + X
6 VII + Wet OSB + VII
7 XI + Wet OSB + XI 8 V + Wet OSB + V 2 9 I + Wet OSB + I Climatic chamber + EEEF (Environmental Envelope Exposure Facility) 1 VII + Wet OSB + VII
2 III + Wet OSB + III
3 V + Wet OSB + V
4 Wet OSB
5 Wet OSB
6 Wet OSB
7 VII + Wet OSB + VII 8 III + Wet OSB + III
3
9 V + Wet OSB + V
EEEF
1.2.2.1 Full scale w all specim ens
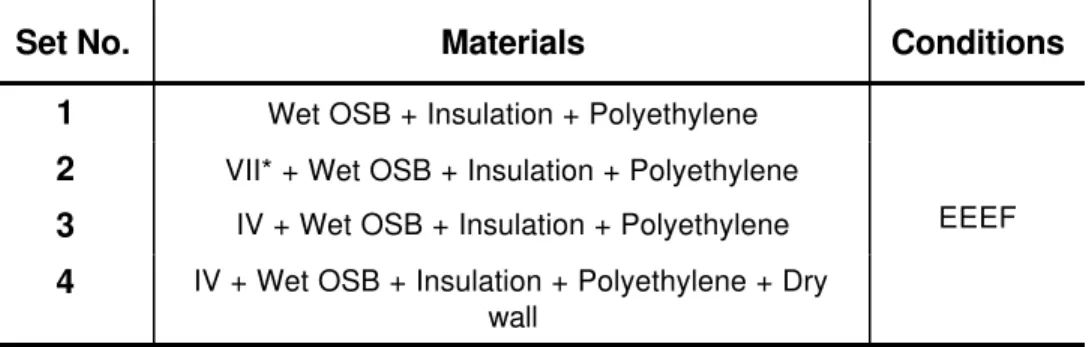
A schematic is provided in Figure 2 that depicts the various components of each of the 4 experimental sets evaluated in full-scale tests. A brief description of each is provided below a summary of which is given in Table 3.
EXPERI MENT SET 1
Experimental Set 1 consisted of evaluating the hygrothermal properties of a single sheet of OSB that was de-coupled from the wood frame assembly, this being achieved by coating the wood frame with a lacquer. Fiberglass insulation was added in the cavities between the studs of the assembly. A single sheet of polyethylene was installed on the exterior side of the assembly (laboratory conditions) (see Figure 2 (a)).
EXPERI MENT SET 2
Experimental Set 2 consisted of evaluating the hygrothermal properties of a single sheet of OSB that, again, was de-coupled from the wood frame assembly, this being achieved by coating the wood frame with a lacquer. A sheathing membrane (no. VII; Table 2) was installed on the OSB sheathing board, fiberglass insulation was added in the cavities between the studs of the assembly and, as in Set 1, a single sheet of polyethylene was installed on the opposite side of the assembly (laboratory conditions) (see Figure 2 (b)).
EXPERI MENT SET 3
Experimental Set 3 consisted of evaluating the hygrothermal properties of a single sheet of OSB that is de-coupled from the wood frame assembly. A sheathing membrane (no. IV; Table 2) was installed on the OSB sheathing board, fiberglass Insulation was added in the cavities between the studs of the assembly and, as in Set 1, a single sheet of polyethylene was installed on the opposite side of the assembly (laboratory conditions) (Figure 2 ©).
EXPERI MENT SET 4
Experimental Set 4 consisted of evaluating the hygrothermal properties of a single sheet of OSB that is de-coupled from the wood frame assembly. A sheathing membrane (no. IV; table 2) was installed on the OSB sheathing board Insulation was added in the cavities between the studs of the assembly, a single sheet of polyethylene was installed on the opposite side of the assembly and, a dry wall (see Figure 2 (d)).
Table 3 – Full-scale experimental sets, related test materials combinations conditions
Set No. Materials Conditions 1 Wet OSB + Insulation + Polyethylene
2 VII* + Wet OSB + Insulation + Polyethylene
3 IV + Wet OSB + Insulation + Polyethylene
4 IV + Wet OSB + Insulation + Polyethylene + Dry wall
EEEF
** Refers to the type of water resistive barrier (WRB) – sheathing membrane
Experiment Set 1 (a) Set 1 Experiment Set 2 (b) Set 2 Experiment Set 3 (c) Set 3 Experiment Set 4 (d) Set 4
Figure 2 – Configuration of full-scale wall assembly specimens: Sets 1 to 4. 6 mil polyethylene
38 mm x 89 mm mm wood stud frame
11.5 mm OSB sheathing Glass fibre insulation (not shown) 6 mil polyethylene Glass fibre 11.5 mm OSB sheathing 6 mil polyethylene 38 mm x 89 mm mm wood stud frame
11.5 mm OSB sheathing Glass fibre insulation (not shown) Sheathing membrane 6 mil polyethylene Glass fibre 11.5 mm OSB sheathing Sheathing membrane 6 mil polyethylene 38 mm x 89 mm mm wood stud frame
11.5 mm OSB sheathing Glass fibre insulation (not shown) Sheathing membrane 6 mil polyethylene Glass fibre 11.5 mm OSB sheathing Sheathing membrane 6 mil polyethylene 38 mm x 89 mm mm wood stud frame 11.5 mm OSB sheathing
Glass fibre insulation (not shown) Sheathing membrane Gypsum board 6 mil polyethylene Glass fibre 11.5 mm OSB sheathing Sheathing membrane Gypsum board
1.3 Specimen Pre- conditioning 1.3.1 Mid-Scale Specimens
Specimens of 0.8 x 1.0-m size were immersed in a water bath for a period of 5 days in order to saturate partially the specimens. Details regarding this water bath and the immersion and soaking process are provided in MEWS Technical report T6-01-R1 (Maref and Lacasse 1999). Specimens are stacked one upon the other separated by aluminium angles of 1-m length. This was done to insure that water is in contact with all surfaces of the OSB specimens such that the process of wetting the samples can be accelerated. To counter the bouncy of specimens, bricks were placed on the top sample.
After five days, water in the bath was drained and the specimens then remained in the bath for another two days to allow moisture to re-distribute itself evenly within the OSB. Care was taken to prevent the boards from drying out by sealing the bath lid with adhesive tape.
1.3.2 Full-scale specimens
Full-scale Specimens were also pre-conditioned to insure that the sheathing boards (OSB) were brought to elevated moisture contents. The pre-conditioning consisted of two phases, immersion and stabilisation. The immersion phase permitted the OSB to quickly reach an elevated level of moisture content. The stabilisation phase insured that the moisture content throughout the component reached equilibrium. The moisture content of the components was monitored on a continuous basis during the stabilisation phase such that the specimen reached the desired moisture content prior to initiating the test program.
The immersion phase took place in a large water tank that permitted the complete immersion of the face of the specimen. Details regarding this immersion tank are provided in MEWS Technical report T6-01-R1 (Maref and Lacasse 1999). The stabilisation phase took place following three days of immersion. Water in the tank was drained and the specimens then remained for another two days to allow moisture to re-distribute itself evenly within the OSB. Care was taken to prevent the boards from drying out by sealing the tank lid with adhesive tape.
Results and Discussions
Simulations were performed using the Advanced Hygrothermal Model hygIRC to estimate the drying potential of the various mid-scale and full-scale specimens in several sets of experiments, results of which are provided below. The following assumptions were made in carrying out the simulations.
• Liquid transport through the building paper was not modelled; it was modelled as a vapour diffusion control element.
• The contact between the membranes and the OSB sheathing was assumed to be perfect.
• The initial moisture content (MC) of the membrane was set to 0%.
The simulations were undertaken using the environmental conditions that existed within the test chamber in which the specimens were placed. The relevant environmental data (i.e. T and RH) for each of the test series (mid and full-scale experimental Sets) is provided in Appendix B.
1.4 Mid- scale results
1.4.1 Mid-scale results: Set 1
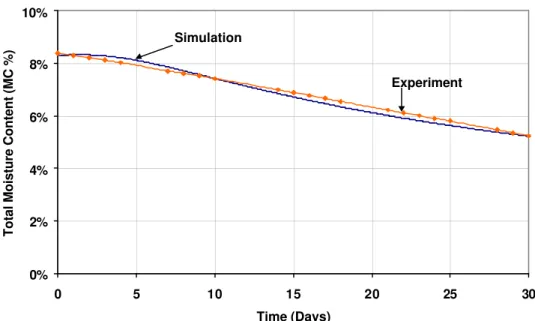
Figure 3 shows the change in MC in the OSB as simulated and measured in experimental Set 1. This figure shows the total MC distributions per 0.8 meter of wall width as a function of time. The initial total MC in the system was 8.4 % and after 30 days it diminished to a value of 5.2 %. Excellent agreement between results of simulation and those of the experimental are evident from this Figure.
On the assumption that there exists good agreement between simulation and experimental one can then proceed to analyse the change in total MC in each layer (dry OSB, wet OSB and dry OSB) of the specimen over time, using the results from simulation. Of course this type of information can only be derived through simulation.
A plot of the total MC for each layer derived from simulation is provided in Figure 4. The MC for each layer of OSB is shown in this figure (not assembly). The wet OSB is saturated to 22% MC, and after 30 days diminishes to 7.1% MC. The dry OSB is initially at 4% MC, thereafter takes up moisture by liquid diffusion in the first 6 days where it is seen that this layer then reaches approximately 8% MC. The layers then dry over the remaining portion of the experiment, where a 6% MC is finally attained. As noted earlier, the contact between the OSB sheathing was, for modelling purposes, considered “perfect”.
Benchmarking of I RC's Advanced Hygrothermal Model
Figure 3 – Comparison of simulated and measured drying results assembly
Figure 4 – Simulated drying results for each layer [Dry/Wet/Dry] OSB Total moisture content in the assembly
0% 2% 4% 6% 8% 10% 0 5 10 15 20 25 30 Time (Days)
Total Moisture Content (MC %)
Simulation
Experiment Simulation results from Dry-Wet-Dry OSB in perfect contact
0% 5% 10% 15% 20% 25% 0 5 10 15 20 25 30 Time (Days)
Total Moisture Content (MC %)
Wet layer OSB
Dry layer OSB(1)
Dry layer OSB(2)
Total moisture content in the assembly
0% 2% 4% 6% 8% 10% 0 5 10 15 20 25 30 Time (Days)
Total Moisture Content (MC %)
Simulation
1.4.2 Mid-scale results: Set 2
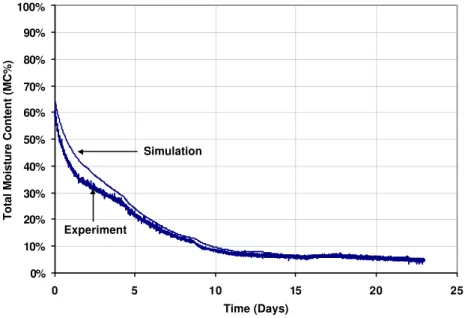
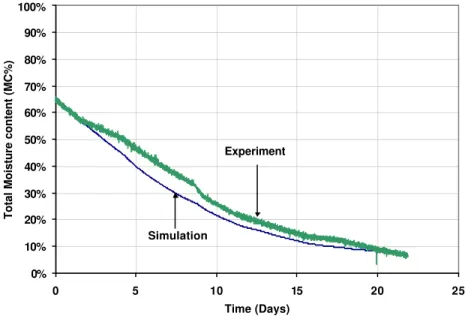
Figure 5 depicts the drying results of the OSB layer exposed to the surrounding environmental conditions within the climatic chamber. In this experiment, the weights of the specimens were monitored continuously using load cells whose signals were captured through a data-logging system (the slight instability in the readings is attributed to small random errors). The initial MC of the OSB is 61%. As can be observed in Figure 5, the equilibrium MC (EMC: 5%) is achieved after 21 days; the simulation is in good agreement with the experimental data. The only differences between the two drying curves manifest themselves in the first 4 days of drying, at high moisture contents; the largest difference is 5% MC, which is negligible for actual conditions.
After a number of simulations undertaken to help benchmark the model representation, it was determined that the grid size had an important effect on the drying curve derived from simulation, especially grid sizes near the “free surface” of specimens. Using a higher density grid near the “free surface” of the OSB enhances the modelling of mass transfer from the free surface to the surrounding air. The largest discrepancy between model and experiment was reduced from 22% to 12.5% by using an irregular instead of a regular mesh. This adjustment in model representation did not worsen the already good correspondence at the lower MC ranges, where the drying rate is lower.
The grid size is not the only parameter to influence the accuracy of the simulation. It must also be considered that the current simulation does not provide for an air gap to be present between the OSB sheathing. In reality, given that perfect contact between membrane and specimen does not exist, it must be assumed that an air gap does indeed exist. Consequently, it can be expected that some condensation could occur on that side of the membrane nearest the free surface of the OSB under certain environmental conditions. These conditions, and the possibility of condensation occurring, needs to be further explored to determine the extent to which they are factors in providing more accurate simulation results. For more details see Appendix C.
A number of different scenarios could be considered in the process of helping ensure the hygrothermal performance of the assemblies is adequately represented. However, it must be acknowledged that the overall agreement between the experimental and simulated drying curves is excellent in terms of the drying times as well as the shape of the drying curve derived from these experimental sets.
Figures 6 and 7 show the simulated and measured drying results for the OSB layer for different membranes. The OSB sheets were wrapped on both sides by two different membranes labelled II and III. In general, the simulation curves follow the shape of the experimental data, but there are some differences in agreement. The initial MC for
Benchmarking of I RC's Advanced Hygrothermal Model
these two OSB boards (wrapped with membranes II and III) was, respectively, 66% and 65%. Nonetheless, the overall simulation results provided in Figures 6 and 7 show good agreement with the experimental data. The biggest difference in MC derived from these comparisons is around 6% MC. It can also be stated that, in general, all simulations provided reasonably accurate drying time for the OSB to reach their respective EMC.
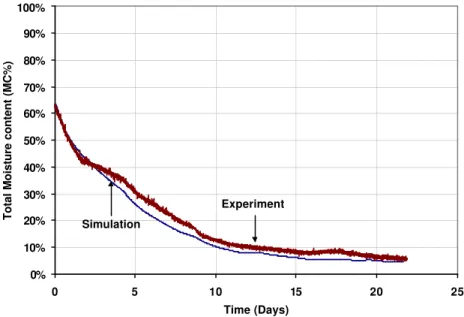
A comparison between simulated and experimental results for OSB wrapped with membrane X is presented in Figure 8; the initial MC of the OSB is 63% and the EMC (5%) is reached after 21 days.
Figure 9 offers a comparison of results obtained from simulation to those from experiment for OSB wrapped in membrane VII. The simulation predicts the drying within an acceptable error (10%).
Finally, comparative results for OSB wrapped in membrane V are provided in Figure 10; these show excellent agreement between the simulated drying curve and the experimental results.
Figure 5 – Comparison of simulated and measured drying results of OSB layer
Figure 6 – Comparison of simulated and measured drying results of OSB layer (The OSB was wrapped on both sides with membrane III)
0% 10% 20% 30% 40% 50% 60% 70% 80% 90% 100% 0 5 10 15 20 25 Time (Days)
Total Moisture Content (MC%)
Experiment Simulation 0% 10% 20% 30% 40% 50% 60% 70% 80% 90% 100% 0 5 10 15 20 25 Time (Days)
Total Moisture Content (MC%)
Simulation
Benchmarking of I RC's Advanced Hygrothermal Model
Figure 7– Comparison of simulated and measured drying results of OSB layer (The OSB was wrapped on both sides with membrane II)
Figure 8 – Comparison of simulated and measured drying results of OSB layer (The OSB was wrapped on both sides with membrane X)
0% 10% 20% 30% 40% 50% 60% 70% 80% 90% 100% 0 5 10 15 20 25 Time (Days)
Total Moisture content (MC%)
Experiment Simulation 0% 10% 20% 30% 40% 50% 60% 70% 80% 90% 100% 0 5 10 15 20 25 Time (Days)
Total Moisture content (MC%)
Experiment
Figure 9 – Comparison of simulated and measured drying results of OSB layer (The OSB was wrapped on both sides with membrane VII)
Figure 10 – Comparison of simulated and measured drying results of OSB layer (The OSB was wrapped on both sides with membrane V)
0% 10% 20% 30% 40% 50% 60% 70% 80% 90% 100% 0 5 10 15 20 25 Time (Days)
Total Moisture content (MC%)
Experiment Simulation 0% 10% 20% 30% 40% 50% 60% 70% 80% 90% 100% 0 5 10 15 20 25 Time (Days)
Total Moisture Content (MC%)
Experiment Simulation
Benchmarking of I RC's Advanced Hygrothermal Model
1.4.3 Mid-scale results: Set 3
Since the specimens for this set were immersed in water for 5 days and then allowed to stabilise in the sealed tank, it was assumed that for all specimens the initial MC at the start of the experiment was uniform through the thickness of the material.
Figures 11 and 12 show the change in MC in the OSB (specimens 4 and 5) as simulated and measured, in experimental Set No. 3. The total MC distribution per 0.8 meter of wall width as a function of time is provided for experimental series OSB.
Figures 11 and 12 show that for OSB surfaces directly exposed to the surrounding air (i.e. “free surface”); the simulated drying rate is in excellent agreement with the results obtained in the experiments. In a simulation, the most critical node in the calculation is the initial one (i.e. node closest to the “free surface”) in particular if the surface is saturated and in contact with air. In this instance, the mass transfer at the boundary layer is very sensitive because the very thin layer of air at the surface offering a certain thermal resistance that permits a higher rate of moisture transfers to occur.
The closer the calculation node is to the surface being simulated, the more accurate the result. In Figure 12, the first 5 days of drying show the highest difference between the results obtained from experiment and the simulation; i.e. 3% less MC. It can also be observed from this Figure that an Equilibrium Moisture Content (EMC) of 5% is reached after 30 days.
Figure 12 shows a comparison between simulated and measured total MC of OSB (specimen-5). The total MC in the system initially is ca. 58 % and after 30 days it reaches a value of 5%. These results indicate a very good agreement between results of simulation and those derived from experiment
.
Figure 11 – Comparison of simulated and measured drying results
[OSB only- Specimen 4]
Figure 12 – Comparison of the simulated and measured drying results
[OSB only - specimen 5]
0% 10% 20% 30% 40% 50% 60% 70% 0 5 10 1 5 20 25 30 Time (Days)
Total Moisture Content (kgw / kgd)
0% 10% 20% 30% 40% 50% 60% 70% 80% 0 5 10 1 5 20 25 30 Time (Days)
Total Moisture Content (kgw/kgd)
Simulation
Benchmarking of I RC's Advanced Hygrothermal Model
Comparative results between simulation and experimental drying of an OSB layer wrapped with sheathing membranes and exposed to the surrounding environmental conditions within the climatic chamber are plotted in Figures 13, and 14. In this experiment, the weights of the specimens were monitored continuously using load cells whose signals were captured through a data-logging system.
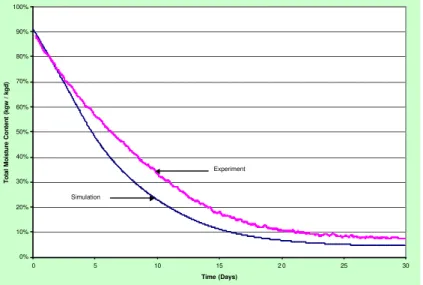
Figure 13 – Comparison of the simulated and measured drying results of OSB layer
(The OSB was wrapped on the both sides with membrane III)
Figure 13 shows the simulated and experimental drying results for OSB board wrapped on both sides with membrane III. The initial MC of the OSB is 90%. As can be observed in Figure 13, the EMC is achieved after 30 days (5%); the simulation is nominally in good agreement with the experimental data. The only differences between the two drying curves manifest themselves in the 4 first days of drying, at high moisture contents; the largest difference is ca. 10% MC representing about 30% error.
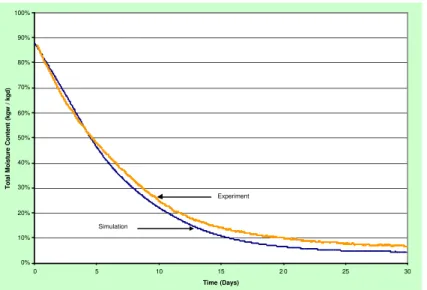
Figures 14, provides the simulated and experimental drying results for OSB boards wrapped on both sides in membranes VII. The simulation curve in Figure 14 follows the shape of the experimental data. The initial MC for the OSB (wrapped with membranes VII) was 88%. The AHM predicts the same period of time to reach the EMC (6% MC). The simulation results given in Figure 14 show good agreement with the experimental data. 0% 10% 20% 30% 40% 50% 60% 70% 80% 90% 100% 0 5 10 15 2 0 25 30 Time (Days)
Total Moisture Content (kgw / kgd)
Simulation
Figure 14 – Comparison of the simulated and measured drying results of OSB layer
(The OSB was wrapped on the both sides with membrane VII)
1.5 Full- scale Experiment Results and Verifications 1.5.1 Full-scale results: Set 1
Since the specimens were immersed in water for 2 days and then allowed to stabilise in a sealed tank, it was assumed that for all specimens the initial MC at the start of the experiment was uniform through the thickness of the material.
Figure 15 shows the change in MC in the OSB derived from simulations and those from experimental results of Set 1. All results are presented as the total MC distribution over a 2.43-m width of wall as a function of time.
In Figure 15, the greatest difference between the results obtained from experiment and the simulation is 4% MC. It can also be observed from this Figure that an Equilibrium Moisture Content (EMC) is not reached after 16 days. To reach the EMC and complete the experiment, the test would need to be at least 40 days.
1.5.2 Full-scale results: Set 2
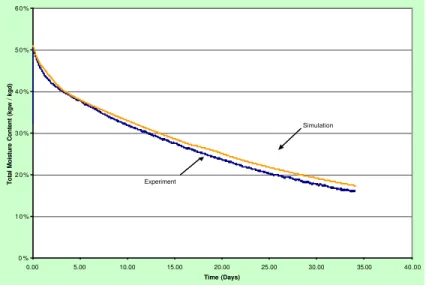
Similarly for Set 2, Figure 16 shows the comparison between simulated and total measured MC of OSB. The total MC in the OSB sheathing board is initially 51 % and after 33 days it reaches a value of 16%. These results indicate very good agreement between the results obtained from simulation and those derived from experiment. In fact, the greatest difference between the simulated and the experimental results is only 1.4%, which is negligible for all practical purposes.
0% 10% 20% 30% 40% 50% 60% 70% 80% 90% 100% 0 5 10 15 2 0 25 30 Time (Days)
Total Moisture Content (kgw / kgd)
Simulation
Benchmarking of I RC's Advanced Hygrothermal Model
Figure 15 – Set 1: Comparison of the simulated and measured drying results of OSB layer
Figure 16 – Set 2: Comparison of the simulated and measured drying results of OSB layer
1.5.3 Full-scale results: Set 3
Figure 17 shows results from experimental Set 3 in which is provided a comparison of total MC of OSB as obtained from simulated results and that from the experimental work. The total MC in the system is initially ca. 70 %; after 28 days it reaches a value of 24%. The test was stopped after 4 weeks because of practical considerations. Again, these results indicate an excellent agreement between results of simulation and those derived from experiment given that the difference between results is no greater than 5 %.
0 % 1 0 % 2 0 % 3 0 % 4 0 % 5 0 % 6 0 % 0.00 5.00 10.00 15.00 20.00 25.00 30.00 35.00 40.00 Time (Days) Total Moisture Content (kgw / kgd) Experiment
Simulation 0 % 1 0 % 2 0 % 3 0 % 4 0 % 5 0 % 6 0 % 0.00 2.00 4.00 6.00 8.00 10.00 12.00 14.00 16.00 Time (Days)
Total Moisture Content (kgw / kgd)
Experiment
Figure 17 – Set 3:Comparison of the simulated and measured drying results of OSB layer
1.5.4 Full-scale results: Set 4
Figure 18 shows results from experimental Set 4 in which is provided a comparison of total MC of OSB as obtained from simulated results and that from the experimental work. The total MC in the system is initially ca. 36 %; after 25 days it reaches a value of 28%. Again, these results indicate an excellent agreement between results of simulation and those derived from experiment given that the difference between results is no greater than 3 %.
Figure 18 – Set 4: Comparison of the simulated and measured drying results of OSB layer
0% 10% 20% 30% 40% 50% 60% 0 5 10 15 20 25 30 Time (Days)
Total Moisture Content (kgw / kgd)
Experiment Simulation 0 % 1 0 % 2 0 % 3 0 % 4 0 % 5 0 % 6 0 % 7 0 % 8 0 % 0.00 5.00 10.00 15.00 20.00 25.00 30.00 35.00 Time (Days)
Total Moisture Content (kgw / kgd)
Experiment
Benchmarking of I RC's Advanced Hygrothermal Model
In general, all simulations were able to adequately predict the time required for the OSB sheathing to reach EMC; essentially, hygIRC is clearly able to predict the drying process in these wall assemblies. In each of the experimental steps so far reported, simulation results have shown very good agreement with those derived from experiment. Indeed, the greatest difference evident when comparing the results derived from simulation and those obtained from experiment are 5%, which is negligible for practical purposes.
Concluding remarks
hygIRC has been used in the MEWS project as the primarily analytical tool to conduct a parametric study to assess the hygrothermal performance of various wall assembly types subjected to different North American climatic conditions.
The overall agreement between experimental and simulated results is very good in terms of the shape of the drying curve and the time taken to reach equilibrium moisture content. A mean set of material properties alone is used in this preliminary investigation. Other material property data on hand at the Institute suggests that the properties can vary within a range. This will be investigated further and reported at a later date.
This will further enhance confidence towards the implementation of hygIRC to undertake broader parametric studies.
Acknowledgements
The authors would like to thank Mr. M.C. Swinton for having provided many useful suggestions regarding both the experimental work and the simulation studies. Our gratitude is also extended to Dr. M.K. Kumaran for his numerous contributions towards completing this task. Thanks is also accorded to Mr. D. Richard of DOCO Microsystems and Dr. N. Kourglicof for having persevered with completing the installation, trouble shooting and commissioning of the precision weighing system. Finally, a word of acknowledgement to the many technical staff who helped in this endeavour and to which we owe sincere thanks for their combined efforts.
References
Geving, S. 1997, Moisture Design of Building Constructions, Hygrothermal Analysis Using Simulation Models, Part II: Collection of papers and reports, NTNU Trondheim, Norway, Ph.D. Thesis, June 1997. Faculty of Civil and Environmental Engineering, Department of Building and Construction Engineering, NTNU, Norway.
Geving, S. and A. Karagiozis 1996, Field Measurements and Computer Simulations of the Hygrothermal Performance of Wood Frame Walls. In: Geving, S. 1997. Moisture Design of
and Environmental Engineering, Department of Building and Construction Engineering, NTNU, Norway.
Geving, S. and J.V. Thue 1996, Measurements and Computer Simulations of Hygrothermal Performance of Lightweight Roofs, in: Proceedings of the 4th Symposium of Building Physics in Nordic Countries, September 9-10, Espoo, Finland, pp. 541-548.
Geving, S. and S. Uvsløkk 2000. Moisture Conditions in Timber Frame Roof and Wall Structures, Test house measurements for verification of heat-, air and moisture transfer models. Project Report 273-2000, BYGGFORSK, and Norwegian Building Research Institute, Oslo, Norway, 50p.
Hens, H. 1996, Finals report Task 1. Modeling Common Exercises. Summary reports. International Energy Agency, Energy Conservation in Buildings and Community Systems, Annex 24 Heat, Air and Moisture Transport in New and Retrofitted Building Envelope Parts (HAMTIE).
Karagiozis, A. and M.K. Kumaran 1997, Applications of Hygrothermal Models to Building Envelope Design Guidelines. 4th Canada/Japan Housing R&D workshop. Pp. III-25-III-36, 1998. Sapporo, Japan, Nov. 16-21, 1997.
Karagiozis, A., M.H. Salonvaara and M.K. Kumaran 1995. The Effect of Waterproof Coating on Hygrothermal Performance of high-rise Wall Structure. Thermal Performance of the Exterior Envelopes of Buildings VI, Clearwater, FL- USA, 1995.
Kohonen, R. 1984, A Method to Analyse the Transient Hygrothermal Behaviour of Building Materials and Components. Technical Research Centre of Finland Publication 21, pp. 33-35
Kumaran, M.K. 1996, Heat, Air and Moisture Transfer in Insulated Envelope Parts, International Energy Agency, IEA Annex 24, Final Report, Vol. 3, Task 3: Material Properties.
Kumaran, M.K., 1998., Water Vapour Transmission Characteristics of Several Building Membranes, Technical report T3-01, August 10, 1998.
Kumaran, M.K., 1998, Water Vapour Transmission and Water Absorption Characteristics of Three Stucco Samples, Technical report T3-02, August 17, 1998.
Kumaran, M.K., 1998, An up-date on the Water Vapour permeance of Building Membranes I to VIII, Technical report T3-04, December 20, 1998.
Kumaran, M.K., 1998. The Ranges of Water Vapour permeabilities for Plywood and OSB: Interim Report after Completing measurements on Four samples Each out of the Planned Six Each, Technical report T3-05, December 20, 1998.
Kumaran, M.K., 1998., Water Absorption Coefficients for Plywood and OSB: The Range, Technical report T3-06, December 20, 1998.
Kumaran, M.K., 1999, Air permeance of Membranes at 75 Pa Pressure Difference: Preliminary Results, Technical report T3-07, January 04, 1999.
Kumaran, M.K., 1999, Water Vapour Permeability of a Spray Polyurethane Foam Insulation Product, Technical report T3-18, August 06, 1999.
Kumaran, M.K., Lackey, J. and van Reenan, D., 1999, Air permeance and Water Vapour permeance of Nine Types of Building Membranes, Technical report T3-09, February 19, 1999.
Kumaran, M.K. and J. Wang 1999. How Well Should One Know the Hygrothermal Properties of Building Materials? Proceeding of CIB W40 meeting (Prague, Czech Republic, 8/30/99), pp. 47-52, August 30, 1999.
Kumaran, M. K., "Protecting the long-term performance of building envelope components", Construction Canada, V. 39 (March) 2002, pp. 24-30.
Lackey, J. and Kumaran, M.K., 1999, Water Vapour Transmission Characteristics of Eight Fibreboard Products, Technical report T3-13, July 23, 1999.
Maref, W., Kumaran, M.K., Lacasse, M.A., Swinton, M.C. and van Reenen, D., "Laboratory Measurements and Benchmarking of an Advanced Hygrothermal Model", proceeding of the 12th International Heat Transfer Conference, August 2002a - Grenoble (France).
Maref, W., Lacasse, M.A., Kumaran, M.K. and Swinton, M.C., "Benchmarking of the advanced hygrothermal model-hygIRC with mid-scale experiments", proceeding of the eSim 2002b-IBPSA-Canada Conference, Montreal (Canada) Sept 12-13, 2002.
Benchmarking of I RC's Advanced Hygrothermal Model
Maref, W., Lacasse, M.A., Kumaran, M.K. and Swinton, M.C., "Large scale laboratory measurement and benchmarking of an advanced hygrothermal model", submitted to the 2nd International Building Physics Conference - Leuven (Belgium), September 14-18, 2003.
Maref, W., Lacasse, M.A., Experimental Assessment of Hygrothermal Properties of Wood-Frame Wall Assemblies - Results of Simulation: Mid-Scale Experiments Sets 1 and 2, MEWS Consortium : Technical Report, T7-04, (T7-04)
Maref, W., Lacasse, M.A., Experimental Assessment of Hygrothermal Properties of Wood-Frame Wall Assemblies - Results of Simulation: Mid-Scale Experiments Sets 3 and 4 - full-scale Experiment Set 1, MEWS Consortium: Technical Report, T7-07, (T7-07)
Maref, W., Experimental Assessment of Hygrothermal Properties of Wood-Frame Wall Assemblies - Results of Simulation: full-scale Experiments Sets 2, 3 and 4, MEWS Consortium: Technical Report, T7-08, (T7-08)
Maref, W., Lacasse M.A., Experimental Assessment of Hygrothermal Properties of Wood-Frame Wall Assemblies - Experimental Procedures, MEWS Consortium: Technical Report, T6-01-R1, (T6-01-R1 (Draft))
Maref, W., Booth, D.G., Lacasse, M.A., Experimental Assessment of Hygrothermal Properties of Wood-Frame Wall Assemblies - Update on Experimental Procedures, MEWS Consortium: Technical Report, T6-01-R1S, (T6-01-R1S)
Maref, W., Booth, D.G., Lacasse, M.A., Calibration of Moisture Content in Oriented Strand Board Specimens from Resistive Measurements Using Moisture Pin Sensors: MEWS Consortium: Technical Report, T6-01-R3, (T6-01-R3)
Maref, W., Lacasse, M.A., Experimental Assessment of Hygrothermal Properties of Wood-Frame Wall Assemblies - Results from Mid-Scale and full-scale Drying Tests Using Moisture Pins, MEWS Consortium: Technical Report, T6-01-R4, (T6-01-R4).
Normandin, N. and Kumaran, M.K., 1999, Thermal Conductivity of Eight Fibreboard Sheathing Products, Technical report T3-11, July 22, 1999.Moisture Control in Buildings, Philadelphia, PA. American Society for Testing and Materials, 1994. Pp. 18-34 (ASTM Manual Series MNL-18).
Normandin, N. and Kumaran, M.K., 1999, Thermal Conductivity of Five Siding Products, Technical report T3-12, July 22, 1999.
Normandin, N. and Kumaran, M.K., 1999, Water Absorption Coefficients of Eight Fibreboard Sheathing Products, Technical report T3-14, July 23, 1999.
Normandin, N. and Kumaran, M.K., 1999, Thermal Conductivity of Plywood and OSB at Two Mean Temperatures, Technical report T3-08, January 13, 1999.
Normandin, N. and Kumaran, M.K., 1999, Water Absorption Coefficients of Five Siding Products, Technical report T3-15, July 23, 1999.
Ojanen, T., R. Kohonen and M.K. Kumaran 1994, Modelling Heat, Air, and Moisture Transport Through Building Materials and Components. In: Moisture Control in Buildings, Philadelphia, PA. American Society for Testing and Materials, 1994. pp. 18-34 (ASTM Manual Series MNL-18) (NRCC-37831) (IRC-P-3677).
Ojanen, T. and M.K. Kumaran 1992, Air Exfiltration and Moisture Accumulation in Residential Wall Cavities. Thermal Performance of the Exterior Envelopes of Buildings V, Proceedings of the ASHRAE/DOE/BTECC Conference (Clearwater Beach, FL., USA, 1992) pp. 491-500, 1992. (NRCC-33974) (IRC-P-1758)
Ojanen, T. and M.K. Kumaran 1995, Effect of Exfiltration on the Hygrothermal Behaviour of a Residential Wall Assembly: Results from Calculations and Computer Simulations. International Symposium on Moisture Problems in Building Walls (Porto, Portugal, 1995) pp. 157-167, 1995. (NRCC-38783)
Ojanen, T. and M.K. Kumaran 1996, Effect of Exfiltration on the Hygrothermal Behaviour of a Residential Wall Assembly" Journal of Thermal Insulation and Building Envelopes Vol. 19, pp. 215-227. (NRCC-39860).
Salonvaara, M. and A.N. Karagiozis 1994, Moisture Transport in Building Envelopes using an Approximate Factorization Solution Method. CFD Society of Canada, Toronto, June 1-3,
Salonvaara, M.H. and A.N. Karagiozis 1996, Influence of Waterproof Coating on the Hygrothermal Performance of a Brick Facade Wall System. ASTM Symposium on Water Leakage Through Building Facades (Orlando, Florida, U.S.A., 1996) pp. 295-311, 1998 (ASTM Special Technical Publication vol. 1314) ASTM-STP-1314.
Van Reenan, D. and Kumaran, M.K., 1999, Air Permeability of Five Siding Products, Technical report T3-16, July 26, 1999.
Van Reenan, D. and Kumaran, M.K., 1999, Air Permeability of Eight Fibreboard Products, Technical report T3-17, July 29, 1999.
Benchmarking of I RC's Advanced Hygrothermal Model
APPENDIX A
A Equipment
A.1 Climatic Chamber (EEEF)
IRC's Building Envelope and Structure Program has a unique test facility that includes (1) computer automated environmental chamber (2) weighing system for full-scale wall assemblies (3) climate sensors (4) data acquisition systems and (5) post-processing tools. The Envelope Environmental Exposure Facility (EEEF) (see Figure A.1) has been used to gather key information regarding the rate of drying of specific wood-frame wall components when subjected to simulated rain events. This facility has proven to be an essential component in determining the limits to which the results from simulation of moisture transport through wall assemblies can be used to help address these issues. The climatic chamber is capable of simulating environmental conditions over extended periods of time. Conditions within the chamber can be varied from temperature of -47 to 48 °C, with humidity levels ranging from 10 to 100% RH. Given the range of climatic conditions and the level of automation, the chamber can, for example, readily model the temperature and relative humidity profiles for a given location in real time. As well, steady-state climates within the chamber can be achieved or be maintained according to predetermined set points. The built-in flexibility of the climate control system permits establishing the response of a wall to the effects of many different climate variations, from which elements critical to the performance of the assembly can be identified.
The system can determine the weight of a full-scale wall assembly (2.43 m x 2.43 m) to the nearest gram over the test period. This permits observing, for example, the “drying out” of a wall component. The weighing system also features several other innovations, including:
1. gasket to insure an airtight seal between the wall specimens and to system frame without interfering with the weighing process;
2. complete control and data acquisition package to monitor experiments; and 3. comprehensive post-processing and data analysis techniques for interpreting
results.
A.2 Weighing systems
For the purpose of this project two weighing systems were developed. The first system (Figure A.2) measures the weight of individual mid-scale specimens as a function of time. It allows the simultaneously monitoring of weight changes of a total of nine different mid-scale specimens. Specimens affixed to these weighing systems were placed in the EEEF and were subjected to environmental conditions to which the chamber was regulated. The need for intermittent weighing of specimens was due to the expected "zero drift" in the load cells when these are subjected to continuous measurement exceeding 3-4 days. Given that these drying tests could extend over several weeks, and to reduce the effect of ‘zero drift’ of the load cells, a system was devised that permitted weighing specimens on an intermittent basis. This was achieved by having the specimens engage and disengage from the load cells at predetermined time intervals through the action of servo-controlled, time actuated, pneumatic pistons. The pistons, placed either end of a support beam, regulate the movement of the beam to which the load cells are attached (see Figure A.3). Each support beam is equipped with three resistance load cells having a capacity of 50 ± 0.02 kg. Changes in weight were recorded from load cell measurement on a data acquisition system.
Benchmarking of I RC's Advanced Hygrothermal Model
A.3 Full-scale tests
The weighting system for the full-scale tests is shown in Figure A.4. Tension load cells were used to support the wall assemblies and measure their total weight during the experiments. Specimen weights could vary up to approximately 250 kg and the system is capable of determining differences in weight as little as 2.5-g.
Figure A.4 – Schematic of the full-scale weighing system
The weights of specimens were recorded using the developed load cells. These cells were initially unloaded. The pneumatic cylinders were extended so as to carry the weight of the test panel as shown in Figure 6. At the beginning of the measurement cycle, the load cells were automatically zeroed by the micro-controller. The load is gradually applied to the load cells by slowly retracting the pneumatic cylinders. An air over oil system is used to provide smooth operation. In an air over oil system, the medium is oil; however, the pressure is supplied by a conventional 100-psi shop air supply. Once the load has been applied to the load cells, a series of measurements is taken from both load cells. Digital filtering is then applied (i.e. averaging over 100 acquisitions). Once the measurement cycle is complete, the cylinders are extended to be unloaded. A relatively simple user Windows-based interface was designed to allow
TENSION LOAD CELLS PNEUMATIC CYLINDERS TEST PANEL TO BE WEIGHED SERIAL LINK RS232 HIGH RESOLUTION ACQUISITION MODULE HIGH SPEED SERIAL LINK DOCO MICROCONTROLLER HOST INPUT LC #υ ⊕ INPUT LC #ϖ ⊕ SUPPORTING FRAME υ ϖ
CONTROL & D/A SYSTEM
100 PSI - SHOP AIR
PNEUMATICS CONTROL MODULE
SIGNAL FILTERING
24 BIT A/D CONVERTER
AIR ACTUATED DIGITAL CONTROLLED SOLENOID VALVE
AIR OVER
the operator to modify the system parameters (acquisition rate, length of test, etc.) and visualise the data.
The load cells used in the experiments were calibrated by mounting them in the Instron UTM (Model 4502; 1kN load cell) as shown in Figure A.5. The load cells were subjected to loads up to the rated capacity of the load cell (100 lbs.). The strain rate is maintained at 0.5mm/min. over the test period. Voltage measurements (mV) are obtained directly from the load cell using a Keithly digital multimeter (Model 196).
Figure A.5 - Load cell calibration
A.4 Measurements
The boundary conditions were recorded using ACR Systems (Model SmartReader Plus Type 2-128k) data loggers. This system acquires the temperature and relative humidity profile of the chamber. The data is acquired every 1 hour and is held in the local memory unit until retrieved by downloading to another computer via an RS-232 serial port located on the logger. The data can then be used as input to the hygIRC model as environmental data, thus establishing the boundary conditions to which the wall assemblies were subjected in each of the experimental sets.
![Figure 11 – Comparison of simulated and measured drying results [OSB only- Specimen 4]](https://thumb-eu.123doks.com/thumbv2/123doknet/14196987.479255/28.918.255.681.133.418/figure-comparison-simulated-measured-drying-results-osb-specimen.webp)
![[PDF] Cours d’introduction à Calc : Modes Opératoires | Cours informatique](data:image/gif;base64,R0lGODlhAQABAIAAAP///wAAACH5BAEAAAAALAAAAAABAAEAAAICRAEAOw==)