S
uccess in reducing anesthesia-related mortal-ity has been exemplary, with current esti-mates of death rates as low as 1 death per200,000 to 300,000 cases.1Despite this
com-mendable record, questions remain about surgical patient safety related to types of anesthesia providers.
On January 18, 2001, the Health Care Financing Administration (now the Centers for Medicare &
Medicaid Services) published a rule2 allowing states
and individual hospitals to decide whether physicians must supervise anesthesia administration by Certified Registered Nurse Anesthetists (CRNAs) in order for hospitals to receive Medicare reimbursement. Before this rule could take effect, a new administration invoked “safety issues” as a rationale for replacing it with a rule that mandates physician supervision unless a state governor obtains a waiver, after consul-tation with the state’s boards of medicine and
nurs-ing.3 Currently, 6 states have obtained such waivers.
In states considering these waivers, state governors have become immersed in sometimes fierce and expensive political controversies as anesthesiologists pressed for mandatory supervision and CRNAs stoutly defended their professional competence. Without recent valid scientific data, governors must contend with contradictory interpretations of
out-dated or seriously flawed research studies.4-7
Further-more, in states that grant waivers, hospitals and sur-geons must decide how the composition of an operative team will affect surgical outcomes.
We studied the effect of type of anesthesia provider Although estimates of anesthesia-related deaths today are as low as 1 in 200,000 to 300,000 cases, questions remain about surgical patients’ safety related to types of anesthesia providers. We studied the effect of type of anesthesia provider on mortality rates of Medicare patients undergoing 8 different surgical procedures.
Risk-adjusted mortality rates were analyzed for 404,194 inpatients undergoing surgery and having com-plete, unambiguous Medicare bills for anesthesia. Mortal-ity was compared for anesthesiologists working alone, Certified Registered Nurse Anesthetists (CRNAs) working alone, and anesthesia care teams. Procedure-specific
risk-adjustment models were derived using stepwise logistic regression. Predictions were adjusted for institutional and geographic factors.
Mortality rates for conditions studied ranged from 0.11% to 1.20%. Observed and predicted values by type of provider were not statistically significantly different. Hospi-tals without anesthesiologists had results similar to hospi-tals where anesthesiologists provided or directed anesthe-sia care.
Key words: Anesthesia mortality, anesthesia providers,
nurse anesthetist, quality of care, surgical mortality.
Surgical mortality and type of anesthesia provider
Michael Pine, MD, MBAKathleen D. Holt, PhD You-Bei Lou, PhD
Chicago, Illinois
on surgical mortality associated with selected surgical procedures performed on Medicare beneficiaries.
Methods
Part A (ie, hospital claims) and Part B (ie, professional claims) Medicare data were analyzed for patients hospi-talized in 1995, 1996, or 1997 in 1 of 22 states if they underwent 1 of the following operations: (1) carotid endarterectomy, (2) cholecystectomy, (3) herniorrhaphy, (4) hysterectomy, (5) knee replacement, (6) laminec-tomy, (7) masteclaminec-tomy, or (8) prostatectomy. Patients also had to (1) reside in the state where the operation was performed, (2) undergo the procedure within 2 days after admission, and (3) have a principal diagnosis that could be treated appropriately by the procedure per-formed. Table 1 lists qualifying International Classifica-tion of Diseases, Ninth Revision, Clinical ModificaClassifica-tion (ICD-9-CM) procedure codes and associated ICD-9-CM principal diagnostic codes. States were selected to yield a reasonable representation of CRNAs practicing in urban and rural facilities across the United States. A total of 586,422 cases met initial inclusion criteria.
The type of anesthesia provider (ie, an gist alone, a CRNA alone, or a team of an anesthesiolo-gist and a CRNA) was obtained from part B Medicare billing data. Cases were eliminated from development of risk-adjustment models if they lacked part B data, had invalid provider codes, were coded as emergencies, or came from any hospital that performed fewer than 15 similar operations on Medicare beneficiaries during the 3-year study period. Table 2 shows the number of cases eliminated by each criterion.
Equations were derived to compute the probability of dying before discharge for each patient undergoing a procedure included in this study. Risk factors con-sidered for each procedure were patients’ age, sex, principal and secondary diagnoses, and selected infor-mation about procedures (eg, laparoscopic vs abdomi-nal surgery). To identify potential risk factors, stepwise
logistic regression8 was applied to New York’s
Statewide Planning and Research Cooperative System (SPARCS) data for 1996 and 1997. This state database was used exclusively to screen potential risk factors because, unlike the Medicare database, it distinguishes valid risk factors (ie, secondary diagnoses present on admission) from complications that occurred during hospitalization. Only comorbid conditions found to be statistically significant predictors of inpatient mortality (ie, P < .05) were selected as candidates for inclusion in final risk-adjustment equations. Finally, secondary diagnoses coded more frequently as complications than as comorbid conditions were eliminated from consideration, even if they were significant predictors of inpatient mortality. Final clinical risk-adjustment models were derived on the Medicare database by applying stepwise logistic regression to select
statisti-cally significant risk factors (P < .05).8 Bootstrapping
techniques9were used to ensure that the final variables
Surgical procedure ICD-9-CM codes*
Carotid endarterectomy Procedure code: 38.12
Principal diagnosis codes: 433.10, 433.30, 435.8x, 435.9x
Cholecystectomy Procedure code: 51.2x
Principal diagnosis codes: 574.xx, 575.0x, 575.1x, 575.2x Herniorrhaphy (uncomplicated) Procedure code: 53.xx
Principal diagnosis codes: 550.9x, 553.xx
Hysterectomy for benign disease Procedure codes: 68.3x, 68.4x, 68.5x, 68.6x, 68.7x, 68.8x, 68.9x
Principal diagnosis codes: 218.xx, 219.xx, 220.xx, 233.1x, 233.2x, 256.xx, 614.xx, 615.xx, 617.xx, 618.xx, 619.xx, 616.0x, 620.xx, 621.xx, 622.xx, 626.xx, 627.xx, 625.2x, 625.3x, 625.4x, 625.5x, 625.6x
Knee replacement Procedure codes: 81.54, 81.55
Principal diagnosis codes: 696.0x, 714.xx, 717.xx, 715.x6, 716.x6, 718.x6, 719.x6
Laminectomy Procedure code: 80.5x
Principal diagnosis codes: 721.xx, 722.xx, 723.0x, 724.0x
Mastectomy Procedure codes: 85.22, 85.23, 85.3x, 85.4x
Principal diagnosis codes: 174.xx, 217.xx, 233.0x, 239.3x, 610.xx, 611.xx Prostatectomy Procedure codes: 60.2x, 60.3x, 60.4x, 60.5x, 60.6x
Principal diagnosis codes: 185.xx, 600.xx
Table 1. Qualifying International Classification of Diseases, Ninth Revision, Clinical Modification (ICD-9-CM) procedure codes and associated ICD-9-CM principal diagnosis codes
* The symbol “x” in a code indicates a blank or any number between 0 and 9.
Total eligible cases 586,422
Cases with invalid provider codes 2,961 Remaining eligible cases 583,461
Cases coded as emergency 964
Remaining eligible cases 582,497 Cases in hospitals having <15 such 24,292
operations in 3 y
Remaining eligible cases 558,205 Cases with no Medicare Part B data 28,627 Total cases used to create models 529,578 Cases with no anesthesia bill 48,316 Remaining eligible cases 481,262 Cases with ambiguous provider codes 27,981 Remaining eligible cases 453,281 Cases with incomplete billing or 49,087
probably team care
Total cases included in analysis of 404,194 mortality rates
Table 2. Number of cases eliminated from model creation and mortality analysis
were applicable to the entire range of observed data. Institutional and geographic variables that might affect predicted mortality also were evaluated using stepwise logistic regression. Hospitals’ number of beds, average daily census, total number of inpatient operations, percentage of registered nurses, and teach-ing status (ie, member of Council of Teachteach-ing Hospi-tals, residency program, or nonteaching hospital) were obtained from the 1997 American Hospital Asso-ciation (AHA) Annual Survey Database. Hospitals’ locations were characterized by state and rural-urban continuum codes (from the AHA database). Each hos-pital’s relative volume of each operation was ranked in quartiles. The degree of a hospital’s technological sophistication was ranked according to the following set of mutually exclusive categories: very high (ie, has burn or transplant unit), high (ie, has at least 2 of the following: trauma unit, cardiac catheterization labora-tory, lithotripter, radiation therapy), moderate (ie, has at least 1 of the 4 services listed for the high category), low (ie, has magnetic resonance imaging, positron emission tomography, or single photon emission tomography scanning), or absent (ie, has none of the services mentioned).
The final risk-adjustment model contained each patient’s predicted mortality rate from the appropriate clinical model and coefficients for the hospital charac-teristics that added significant predictive power, ie, rel-ative volume of each operation, number of inpatient operations, average daily census, and the hospital’s
position on the rural-urban continuum. C statistics10
(ie, areas under receiver-operating characteristic curves) were calculated to assess each model’s predic-tive power (ie, 1.0 equals perfect prediction, 0.5 equals no predictive power).
After development of risk-adjustment models, the database was refined further by excluding cases that had no bill for anesthesia services, had ambiguous anesthesia provider codes, or had bills that suggested team care but lacked corresponding bills for both an anesthesiologist’s and a CRNA’s services. Table 2 shows numbers excluded for these reasons.
Initial patient-specific mortality predictions were computed using procedure-specific risk-adjustment equations; predicted values then were adjusted using hospital-specific variables. The resulting predicted values were used to compare inpatient mortality rates among the 3 types of providers (anesthesiologists alone, CRNAs alone, anesthesia care teams).
The organization of anesthesia practice in a hospi-tal may contribute to surgical outcomes regardless of which type of anesthesia provider cares for an indi-vidual patient. To assess whether differences in the
organization of anesthesia practice affected inpatient mortality rates, hospitals were categorized as having only 1 type of anesthesia provider (A1, A2, A3), hav-ing only solo practitioners (B), havhav-ing a shav-ingle type of solo practitioner and team anesthesia care (C1, C2), or having both types of solo practitioners and team anesthesia care (D).
We computed c 2statistics to evaluate differences in
distributions of cases among types of anesthesia providers and to examine the relation between types of
providers and risk-adjusted inpatient mortality rates.11
Results
For the 404,194 cases analyzed, Table 3 shows the dis-tribution of patients among the 8 operations and the unadjusted mortality rate for each operation. Mortality rates ranged from 0.11% for mastectomies and for hys-terectomies to 1.20% for cholecystectomies. The aver-age for all patients was 0.38%. Anesthesia care was pro-vided by anesthesiologists alone in 33.2% of cases, by CRNAs alone in 8.2%, and by anesthesia care teams in 58.6% (Table 4).
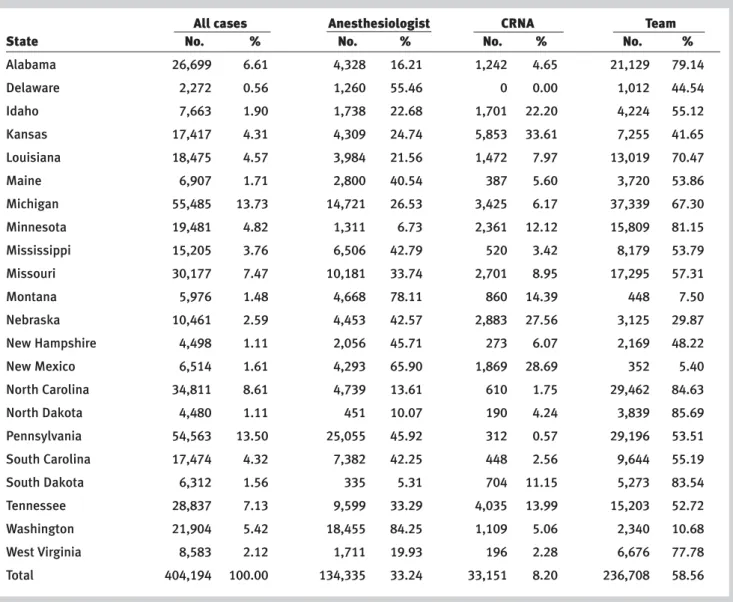
Table 5 presents the distribution of operations among the 22 states, from 0.6% in Delaware to 13.7% in Michigan. The percentage of cases in which anes-thesiologists worked alone ranged from 5.3% in South Dakota to 84.3% in Washington. The percentage in which CRNAs worked alone ranged from 0% in Delaware to 33.6% in Kansas. The percentage of cases receiving care from teams ranged from 5.4% in New Mexico to 85.7% in North Dakota. Almost half the operations were performed within metropolitan areas of 100,000 to 1,000,000 residents (Table 6). Approxi-mately one fourth were performed in metropolitan areas exceeding 1,000,000 residents. Almost 80% of operations in which CRNAs alone provided anesthe-sia were performed at rural hospitals or in metropoli-tan areas of fewer than 100,000 residents.
Table 7 lists C statistics for the 8 clinical risk-adjustment models and for the final model incorpo-rating clinical risk and hospital characteristics. Patient factors were most predictive of mortality for patients undergoing cholecystectomy or herniorrhaphy and least predictive for patients undergoing mastectomy or knee replacement.
Table 8 presents risk-adjusted mortality rates by type of anesthesia provider and by hospitals’ types of anesthesia practice. There were no significant differ-ences in risk-adjusted mortality rates by type of anes-thesia provider or by type of anesanes-thesia practice within the hospital. These findings were not altered when risk-adjustment was performed using equations without hospital or geographic variables.
All cases Anesthesiologist CRNA Team
Procedure No. %* No. % No. % No. %
Carotid endarterectomy 56,957 14.09 22,164 38.91 1,495 2.62 33,298 58.46 Cholecystectomy 54,673 13.53 20,211 36.97 7,147 13.07 27,315 49.96 Herniorrhaphy 15,779 3.90 5,010 31.75 1,041 6.60 9,728 61.65 Hysterectomy 30,567 7.56 9,234 30.21 2,676 8.75 18,657 61.04 Knee replacement 111,124 27.49 33,341 30.00 9,617 8.65 68,166 61.34 Laminectomy 28,999 7.17 9,248 31.89 841 2.90 18,910 65.21 Mastectomy 27,418 6.78 8,342 30.43 2,435 8.88 16,641 60.69 Prostatectomy 78,677 19.47 26,785 34.04 7,899 10.04 43,993 55.92 Total 404,194 99.99 134,335 33.24 33,151 8.20 236,708 58.56
Table 4. Number and percentage of cases receiving anesthesia from each type of provider, by procedure
* The column total does not equal 100.00% because of rounding.
Procedure No. % of Total* Dead % of Total* % Dead
Carotid endarterectomy 56,957 14.09 282 18.18 0.50 Cholecystectomy 54,673 13.53 655 42.23 1.20 Herniorrhaphy 15,779 3.90 65 4.19 0.41 Hysterectomy 30,567 7.56 35 2.26 0.11 Knee replacement 111,124 27.49 256 16.51 0.23 Laminectomy 28,999 7.17 67 4.32 0.23 Mastectomy 27,418 6.78 31 2.00 0.11 Prostatectomy 78,677 19.47 160 10.32 0.20 Total 404,194 99.99 1,551 100.01 0.38
Table 3. Distribution of cases and unadjusted mortality rates, by procedure
* Column totals do not equal 100.00% because of rounding.
Discussion
Although there is a large body of literature delineating patient and hospital factors related to risk-adjusted
sur-gical mortality,12-16few studies have addressed the effect
of the type of anesthesia provider on these outcomes. A classic study of anesthesia-related mortality by
Beecher and Todd4more than 50 years ago found
sub-stantially higher mortality rates when anesthesia was administered by anesthesiologists than when it was administered by CRNAs. Because the physical status of patients treated by both types of providers was sim-ilar (according to American Society of Anesthesiolo-gists’ classifications), the researchers attributed the difference in outcomes to greater but unmeasured complexity of anesthesiologists’ cases.
Two decades later, a North Carolina study5 found
“the incidence [of death] among the three major groups (the CRNA, the anesthesiologist, and the com-bination of CRNA and anesthesiologist) to be rather similar….” However, provider-specific mortality rates in this study could not be risk adjusted because clini-cal data on surviving patients were unavailable.
Another study published in 19806 compared
risk-adjusted mortality (both surgical and anesthesia-related) at 9 hospitals “in which anesthesiologists pri-marily were the providers” with that at 7 hospitals “in which nurse anesthetists were primarily the providers.” These authors concluded that “using con-servative statistical methods, … there were no signifi-cant differences in outcomes between the two groups
of hospitals defined by type of anesthesia provider.” In an article that its authors confessed “lacks the scientific credibility of a review or original article and
is related to policy making more than science,”17
Abenstein and Warner18reinterpreted the findings of
previous researchers. They concluded: “When the data are critically examined, the evidence is very sup-portive that the anesthesiologist-led anesthesia care team is the safest and most cost-effective method of delivering anesthesia care.” However, they presented no original data to support this conclusion.
In a more recent risk-adjusted study of 217,440
surgical cases in Pennsylvania, Silber et al7 observed
an increase of 2.5 deaths per 1,000 patients when an anesthesiologist was not involved in the case. This statistic is alarming in light of the Institute of Medi-cine’s review, which concluded: “today, anesthesia mortality rates are about one death per
200,000-300,000 anesthetics administered…”1 However,
approximately two thirds of cases classified by Silber
et al7 as lacking an anesthesiologist either had no bill
at all for anesthesia care or had an anesthesiologist involved in some but not all of a patient’s procedures. Cases in which an anesthesiologist worked alone were not distinguished from those in which anesthesia was provided by a team. And only cases in Pennsylvania were studied.
The present study endeavored to avoid these limi-tations by drawing cases from 22 states, including Pennsylvania. Only cases with clear documentation of type of anesthesia provider were included. Team care was distinguished from anesthesiologists or CRNAs practicing alone. Because patient and surgical risk far outweigh anesthesia risk in hospitalized patients
undergoing surgical procedures14,19 and because risk
adjustment using administrative data sets always is
All cases Anesthesiologist CRNA Team
State No. % No. % No. % No. %
Alabama 26,699 6.61 4,328 16.21 1,242 4.65 21,129 79.14 Delaware 2,272 0.56 1,260 55.46 0 0.00 1,012 44.54 Idaho 7,663 1.90 1,738 22.68 1,701 22.20 4,224 55.12 Kansas 17,417 4.31 4,309 24.74 5,853 33.61 7,255 41.65 Louisiana 18,475 4.57 3,984 21.56 1,472 7.97 13,019 70.47 Maine 6,907 1.71 2,800 40.54 387 5.60 3,720 53.86 Michigan 55,485 13.73 14,721 26.53 3,425 6.17 37,339 67.30 Minnesota 19,481 4.82 1,311 6.73 2,361 12.12 15,809 81.15 Mississippi 15,205 3.76 6,506 42.79 520 3.42 8,179 53.79 Missouri 30,177 7.47 10,181 33.74 2,701 8.95 17,295 57.31 Montana 5,976 1.48 4,668 78.11 860 14.39 448 7.50 Nebraska 10,461 2.59 4,453 42.57 2,883 27.56 3,125 29.87 New Hampshire 4,498 1.11 2,056 45.71 273 6.07 2,169 48.22 New Mexico 6,514 1.61 4,293 65.90 1,869 28.69 352 5.40 North Carolina 34,811 8.61 4,739 13.61 610 1.75 29,462 84.63 North Dakota 4,480 1.11 451 10.07 190 4.24 3,839 85.69 Pennsylvania 54,563 13.50 25,055 45.92 312 0.57 29,196 53.51 South Carolina 17,474 4.32 7,382 42.25 448 2.56 9,644 55.19 South Dakota 6,312 1.56 335 5.31 704 11.15 5,273 83.54 Tennessee 28,837 7.13 9,599 33.29 4,035 13.99 15,203 52.72 Washington 21,904 5.42 18,455 84.25 1,109 5.06 2,340 10.68 West Virginia 8,583 2.12 1,711 19.93 196 2.28 6,676 77.78 Total 404,194 100.00 134,335 33.24 33,151 8.20 236,708 58.56
suboptimal,8 only surgical procedures that are per-formed on relatively homogeneous populations were included. Exclusion of emergency and other higher risk operations substantially reduced variability in predicted outcomes that can confound analyses, par-ticularly when observational data sets are as unbal-anced as the one used in this study. Also, because sub-stantial differences in the risk of adverse outcomes remain even within these relatively homogeneous sur-gical categories, risk-adjustment equations were derived to account for any coexisting clinical condi-tions that might affect surgical mortality.
Particularly in high-risk emergency patients like
those included in the study by Silber et al,7 a large
proportion of postoperative deaths are attributable to patients’ underlying conditions rather than to
defi-ciencies in anesthesia care.14,19 The present study’s
focus on nonemergency procedures greatly increased the probability that coexisting serious acute condi-tions were not present at the time of operation. How-ever, because deaths due to surgical complications generally are far more frequent than those due to
anesthesia complications,14,19 even rigorous risk
adjustment performed for a diverse set of surgical pro-cedures across a widely dispersed geographic area probably failed to remove all systematic biases. Only a careful review of medical records to determine the actual causes of mortality and morbidity could elimi-nate these biases.
In the present study, patients were attributed to an anesthesia provider based on data from the operation that qualified them for inclusion in the study. In
con-trast, Silber et al7classified cases as “undirected” if an
undirected CRNA administered anesthesia for post-surgical palliative procedures, even when an anesthe-siologist or a team administered anesthesia for the original surgical interventions. This difference in assignment may account, at least in part, for the higher risk-adjusted mortality rates observed by Silber
et al7in undirected cases.
It is important to note several limitations
associ-ated with any study that compares mortality rates using Medicare and AHA data.
First, non-Medicare cases are not in the database. Also, information about practitioners reflects only services that were billed, and there are no records of services for patients in Medicare health maintenance organizations.
Second, because Medicare data do not distinguish between valid risk factors (ie, comorbid conditions) and inpatient complications, risk adjustment using Medicare data may fail to capture the true
preopera-tive risk of death.8,20To enhance further the validity of
risk-adjustment models, the present study limited risk variables to those identified using New York’s SPARCS database, which distinguishes clearly between comor-bid conditions and complications.
Third, information in the AHA database comes from hospitals themselves and is not validated independently. Consequently, this database, although used widely in research studies, may contain inaccuracies about some hospitals. For example, high technology reported by a small rural hospital may actually reside in an affiliated urban medical center 100 miles away, or “number of beds” may include some that were closed years ago.
All cases Anesthesiologist CRNA Team
Metropolitan population No. % No. % No. % No. %
>1,000,000 106,479 26.34 32,001 30.05 1,914 1.80 72,564 68.15
100,000-1,000,000 189,270 46.83 68,397 36.14 5,414 2.86 115,459 61.00
<100,000 108,445 26.83 33,937 31.29 25,823 23.81 48,685 44.89
Total 404,194 100.00 134,335 33.24 33,151 8.20 236,708 58.56
Table 6. Distribution of cases among providers by size of metropolitan area where they worked
Procedure C statistic Carotid endarterectomy 0.826 Cholecystectomy 0.883 Herniorrhaphy 0.853 Hysterectomy 0.811 Knee replacement 0.766 Laminectomy 0.787 Mastectomy 0.667 Prostatectomy 0.812
All + hospital characteristics 0.857 Table 7. C statistics for risk-adjustment models
N o. of Ca se s per N o. of Pr edict ed Obser ved Pr edict ed T ype * AA CRNA Team H o spitals hospital ca s e s Dead dead rat e (%) rat e (%) O/P All cases A1 1 9 5 313 29,718 121 115.4 0.41 0.39 1.049 A2 1 191 71 13,592 61 68.0 0.45 0.50 0.897 A3 1 2 5 333 8,330 24 28.9 0.29 0.35 0.830 B1 1 112 203 22,770 94 92.8 0.41 0.41 1.013 C1 1 1 574 457 262,289 978 982.0 0.37 0.37 0.996 C2 1 1 9 9 4 844 4 3.2 0.47 0.38 1.250 D1 11 171 390 66,651 269 260.8 0.40 0.39 1.031 Total 1,177 343 404,194 1,551 1,551.0 0.38 0.38 1.000
Anesthe- siologist only A1
1 9 5 313 29,718 121 115.4 0.41 0.39 1.049 B1 1 112 107 11,970 52 50.1 0.43 0.42 1.037 C1 1 1 574 127 73,046 323 325.6 0.44 0.45 0.992 D1 11 171 115 19,601 108 90.5 0.55 0.46 1.194 Total 952 141 134,335 604 581.6 0.45 0.43 1.039 CR NA only A2 1 191 71 13,592 61 68.0 0.45 0.50 0.897 B1 1 112 96 10,800 42 42.6 0.39 0.39 0.985 C2 1 1 9 1 8 164 2 0.9 1.22 0.55 2.222 D1 11 171 50 8,595 46 35.0 0.54 0.41 1.316 Total 483 69 33,151 151 146.5 0.46 0.44 1.031
Anesthe- sia car
e team A3 1 2 5 333 8,330 24 28.9 0.29 0.35 0.830 C1 1 1 574 330 189,243 655 656.3 0.35 0.35 0.998 C2 1 1 9 7 6 680 2 2.3 0.29 0.34 0.870 D1 11 171 225 38,455 115 135.4 0.30 0.35 0.849 Total 779 325 236,708 796 822.9 0.34 0.35 0.967 Table 8. Risk-adjusted mor tality r
ates by type of anesthesia pr
o vider * K ey to type s A1 = Anesthesiologist as sole pr o vider A2 = CR NA as sole pr o vider A3 = Team as sole pr o vider
B = Both anesthesiologist and CR
NA, each working alone
AA
indicates anesthesiologist alone; O/P
, obser ved/pr edicted r atio; CR NA, Cer tified R egister ed Nurse Anesthetist.
C1 = Anesthesiologist alone and team car
e
C2 = CR
NA alone and team car
e
D = Both types of solo pr
o
viders and team car
Finally, the Medicare database does not permit pre-cise identification of the cause of death. Detailed reviews of large numbers of medical records would be required to determine definitively the contribution of anesthesia care to operative and postoperative deaths. After adjustment for differences in case mix, clini-cal risk factors, hospital characteristics, and geo-graphic location, the current study found similar risk-adjusted mortality rates whether anesthesiologists or CRNAs worked alone. Furthermore, hospitals with-out anesthesiologists had results similar to those of hospitals in which anesthesiologists provided or directed anesthesia care. Anesthesia care teams had a slightly lower risk-adjusted mortality rate than did practitioners working alone, but the difference was not statistically significant. Although these findings
differ from those of Silber et al,7they are more
consis-tent with the earlier research cited and with current
data on overall anesthesia-related mortality.1 They
indicate that for the surgical procedures included in this study, the type of anesthesia provider does not affect inpatient surgical mortality.
REFERENCES
1. Institute of Medicine. To Err Is Human: Building a Safer Health
Sys-tem. Washington, DC: National Academy Press; 1999:27.
2. 66 Federal Register 4674. 2001. 3. 66 Federal Register 35395. 2001.
4. Beecher HK, Todd DP. A study of the deaths associated with anes-thesia and surgery based on a study of 599,548 anesanes-thesias in ten institutions 1948-1952, inclusive. Ann Surg. 1954;140:2-34. 5. Bechtoldt AA Jr. Committee on Anesthesia Study.
Anesthetic-related deaths: 1969-1976. N C Med J. 1981;42:253-259. 6. Forrest WH Jr. Outcome: the effect of the provider. In: Hirsh RA,
Forrest WH Jr, Orkin FK, Wollman H, eds. Health Care Delivery in
Anesthesia. Philadelphia, Pa: George F. Stickley Co; 1980:137-142.
7. Silber JH, Kennedy SK, Even-Shoshan O, et al. Anesthesiologist direction and patient outcomes. Anesthesiology. 2000;93:152-163. 8. Pine M, Norusis M, Jones B, Rosenthal GE. Predictions of hospital
mortality rates: a comparison of data sources. Ann Intern Med. 1997;126:347-354.
9. Efron B, ed. The jacknife, the bootstrap and other resampling plans. Philadelphia, Pa: Society for Industrial and Applied Mathe-matics; 1982.
10. Hanley JA, McNeil B. A method of comparing the areas under receiver operating characteristic curves derived from the same cases. Radiology. 1983;148:839-843.
11. Colton T. Statistics in Medicine. Boston, Mass: Little, Brown and Co; 1974:151-188.
12. Vacanti CJ, VanHouton RJ, Hill RC. A statistical analysis of the relationship of physical status to postoperative mortality in 68,388 cases. Anesth Analg. 1970;49:564-566.
13. Blumberg MS. Risk adjusting health care outcomes: a method-ologic review. Med Care Rev. 1986;43:351-393.
14. Cohen MM, Duncan PG, Tate RB. Does anesthesia contribute to operative mortality? JAMA. 1988;260:2859-2863.
15. Iezzoni LI. Using risk-adjusted outcomes to assess clinical prac-tice: an overview of issues pertaining to risk-adjustment. Ann
Tho-rac Surg. 1994;58:1822-1826.
16. Daley J, Forbes MG, Young GJ, et al. Validating risk-adjusted sur-gical outcomes: site visit assessment of process and structure. National VA Surgical Risk Study. J Am Coll Surg. 1997;185:341-351.
17. Miller RD. Perspective from the editor-in-chief: anesthesia providers, patient outcomes, and costs. Anesth Analg. 1996;82: 1117-1118.
18. Abenstein JP, Warner MA. Anesthesia providers, patient outcomes, and costs. Anesth Analg. 1996;82:1273-1283.
19. Buck N, Devlin HB, Lunn JN. The report of a confidential enquiry into perioperative deaths. London, England: Nuffield Provincial Hospital Trust; 1988.
20. Pine M, Jones B, Lou YB. Laboratory values improve predictions of hospital mortality. Int J Qual Health Care. 1998;10:4491-4501.
AUTHORS
Michael Pine, MD, MBA, is president, Michael Pine and Associates, Inc, Chicago, Ill.
Kathleen D. Holt, PhD, is a senior analyst, Michael Pine and Associates, Inc.
You-Bei Lou, PhD, is a senior analyst, Michael Pine and Associ-ates, Inc.
ACKNOWLEDGMENTS