Impact
assessment
case study
of phytosanitary
measures for
Huanglongbing
in the production
of seedlings
in protected
environment
in Brazil
Impact
assessment
case study
of phytosanitary
measures for
Huanglongbing
in the production
of seedlings
in protected
environment
in Brazil
Montevideo, Uruguay - 2019
Editorial coordination: Lourdes Fonalleras and Florencia Sanz Translator: Miguel Barbosa Fontes
Layout: Esteban Grille Cover design: Esteban Grille Digital printing
Impact assessment case study of phytosanitary measures for Huanglongbing in the production of seedlings in protected environment in Brazil / Inter-American Institute for Cooperation on Agriculture, Comité Regional de Sanidad Vegetal del Cono Sur, John Snow / Brasil Consultoría, Secretaria de Defesa Agropecuária. – Uruguay: IICA, 2019. 34 p.; A4 21 cm X 29,7 cm.
ISBN: 978-92-9248-832-1
Published also in Spanish and Portuguese
1. Plant diseases 2. Phytosanitary measures 3. Tephritidae 4. Biological contamination 5. Diaphorina citri 6. Citrus 7. Grafting 8. Vegetative propagation 9. Impact assessment 10. Brasil I. IICA II. COSAVE III. JS/Brasil Consultoría IV. SDA/MAPA V. Title
AGRIS DEWEY
H20 632.3
Instituto Interamericano de Cooperación para la Agricultura (IICA), 2019
Impact assessment case study of phytosanitary measures for Huanglongbing in the production of seedlings in protected environment in Brazil by IICA is published under license Creative Commons
Attribution-ShareAlike 3.0 IGO (CC-BY-SA 3.0 IGO)
(http://creativecommons.org/licenses/by-sa/3.0/igo/) Based on a work at www.iica.int
IICA encourages the fair use of this document. Proper citation is requested.
This publication is available in electronic (PDF) format from the Institute’s Web site: http://www.iica.int
ACKNOWLEDGMENTS
The case study of impact assessment of phytosanitary measures of Huanglongbing in Brazil for production of seedlings in protected environment was developed based on the Methodology for the Socioeconomic Impact Assessment of Phytosanitary Measures and application Guide. Both documents were developed as a result of the component oriented to generate tools and build capacity to assess the impact of phytosanitary measures implemented by countries, in the framework of STDF / PG / 502 Project “COSAVE: Regional Strengthening of the Implementation of Phytosanitary Measures and Market Access”.
The beneficiaries are the Southern Cone Plant Health Committee (COSAVE) and the National Plant Protection Organizations (NPPOs) of its seven member countries. The Standards and Trade Development Facility (STDF) fund it, the Inter-American Institute for Cooperation on Agriculture (IICA) is the implementing organization and the International Plant Protection Convention (IPPC) Secretariat supports the project. The editorial coordination was in charge of Maria de Lourdes Fonalleras and Florencia Sanz.
Maria de Lourdes Fonalleras, Florencia Sanz and Miguel Fontes as team coordinator consultant JS/Brasil, have defined the original structure of this document.
The content development corresponds to the team of specialists of John Snow Brasil hired specially for the project: Miguel Fontes, Rodrigo Laro, Andrea Stancioli, and the specialists Álvaro Antonio Nunes Viana, Ángela Pimenta Peres, Augusto Carlos dos Santos Pintos of the Secretary of Agricultural Defense (SDF, by its acronym in Portuguese) of the Ministry of Agriculture, Livestock and Supply (MAPA, by its acronym in Portuguese) of Brazil.
The technical readers that made important contributions to the content are the specialists of the NNPO’s participating in the project:
Diego Quiroga, Francisco Leprón, Héctor Medina, Pablo Frangi, Wilda Ramírez, Yanina Outi from Servicio Nacional de Sanidad y Calidad Agroalimentaria – SENASA from Argentina;
Luis Sánchez Shimura, Douglas Kohler Cuellar, Freddy Adolfo Ramos Adrián, Immer Adhemar Mayta Llanos, Ramiro Jiménez Duran from Servicio Nacional de Sanidad Agropecuaria e Inocuidad Alimentaria – SENASAG from Bolivia;
Eriko Tadashi Sedoguchi, Graciane Goncalves Magalhaes de Castro from Secretaria de Defensa Agropecuaria SDF-MAPA from Brazil; Rodrigo Astete, Claudia Vergara, Fabiola González, María Daniela Buzunariz Ramos, Ruth Arévalo, Tamara Gálvez Reyes from Servicio Agrícola y Ganadero – SAG from Chile;
Nelson Fariña, Ana Teresa González, Erika Galeano, Julio Rojas, María Eugenia Villalba Sandoval from Servicio Nacional de Calidad, Sanidad Vegetal y de Semillas – SENAVE from Paraguay;
Enne María Carrillo Esquerre, Ezequiel Félix Quenta Cherre, Gladys Quiroz, Orlando Antonio Dolores Salas, Waldir Arbildo Ramírez from Servicio Nacional de Sanidad Agraria – SENASA from Perú; Mario De Los Santos, María José Montelongo, Leticia Casanova from Dirección General de Servicios Agrícolas – DGSA - MGAP from Uruguay. We express special appreciation to all of them.
We also thank the support received from the IPPC Secretariat for the implementation of this component of the project.
CONTENT
Acronyms ... 6
List of Tables and Graphs... 7
I. Introduction ... 8
II. Methodology ... 10
III. Results ... 11
STAGE 1: Elaboration of the logical framework ... 11
STAGE 2: Elaboration of the data collection form ... 16
STAGE 3: Data collection ... 21
STAGE 4: Financial, economic and social analysis ... 22
IV. Conclusion ... 33
ACRONYMS
COSAVE Southern Cone Plant Protection Committee (COSAVE by its acronym in Spanish)
DGSA Dirección General de Servicios Agrícolas from Uruguay FAO Food and Agriculture Organization
HLB Huanglongbing
IICA Inter-American Institute for Cooperation on Agriculture IPPC International Plant Protection Convention
MAPA Ministério da Agricultura, Pecuária e Abastecimento from Brasil
MEIS Socioeconomic Impact Assessment Methodology (MEIS by its acronym in Spanish)
NPPO National Organization for Phytosanitary Protection RENASEM National Seed and Seedling Registry
SAG Servicio Agrícola y Ganadero from Chile
SDF Secretaria de Defensa Agropecuaria from Brasil
SENASA Servicio Nacional de Sanidad y Calidad Agroalimentaria from Argentina
SENASA Servicio Nacional de Sanidad Agraria from Perú
SENASAG Servicio Nacional de Sanidad Agropecuaria e Inocuidad Alimentaria from Bolivia
SENAVE Servicio Nacional de Calidad, Sanidad Vegetal y de Semillas from Paraguay
LIST OF TABLES AND GRAPHS
Table 1. Individual suggestions for the general objective during the Logical Framework workshop
Table 2. Consolidation of the General Objective of Impact, its Goals and Indicators
Table 3. Consolidation of the Specific Objectives, their Goals and Indicators
Table 4. Consolidation of the Logical Framework (HLB in Brazil) Table 5. Data Collection Form
Table 6. Data on the impact of HLB in the state (Initial version) Table 7. Data on the impact of HLB in the state (final version) Table 8. Data on the management of HLB in the state (initial version) Table 9. Data on the management of HLB in the state (final version) Table 10. Efficacy data
Table 11. Rates of efficacy indicators Table 12. Efficacy rates
Table 13. Final budget of the measure for the three cost centers Table 14. Final cost-efficacy analysis of cost centers
Table 15. Combined cost-efficacy analysis of the three cost centers Table 16. Analysis of the distortion of prices of specific inputs
Table 17. Economic costs of eradication, abandonment and production of certified plants
Table 18. Economic benefits of employment generation and certified plants
Table 19. Calculation of the economic benefits of job creation and certified plants
Table 20. Economic Cost-Benefit Calculation
Table 21. Analysis of epidemiological concentration between the three groups (<10;> 10 and <100;> 100 thousand plants)
Table 22. Analysis of epidemiological concentration between the groups (between <10 and> 10 and <100 thousand plants)
Graph 1. Hoover Index for the three groups of Social Analysis
Graph 2. Hoover index for the two social analysis groups (between <10 and> 100 thousand plants)
Graph 3. Hoover Index for the two social analysis groups (between 10 and 100 and 100,000 plants)
I.
INTRODUCTION
This case study presents the results of the impact assessment of phytosanitary measures of seedling production in protected environments certified as a preventive measure against the propagation of HLB in Brazil. Following the Socioeconomic Impact Assessment Methodology developed within the framework of Project STDF / PG / 502 “COSAVE: regional strengthening of the implementation of phytosanitary measures and access to markets”.
Huanglongbing (HLB) was detected in Brazil for the first time in 2004 in the region of Araraquara in the state of São Paulo, and is now considered the most destructive citrus disease in the country. It is a disease of difficult control, rapid dissemination and highly devastating. It is caused by the bacteria Candidatus Liberibacter asiaticus
Jagoueix et al., Candidatus Liberibacter americanus Texeira et al. These bacteria are
transmitted to the citrus plants through the insect Diaphorina citri Kuwayama (Hemiptera: Liviidae) or by grafting contaminated material (Fundecitrus, 2016). Hunglongbing is regulated in Brazil as Quarantine In-country Plague, and is currently present in the states of São Paulo, Minas Gerais (detected in 2005) and in Paraná, with its first occurrence registered in 2007. The citrus sector has great relevance in Brazilian agribusiness, as the country is the world’s largest producer of oranges and the largest exporter of orange juice, exporting to 40 countries. Brazil accounts for 38% of orange production, 65% of juice production and 78% of international juice trade1.
The four largest Brazilian orange producing states in 2016 were São Paulo, Bahia, Minas Gerais and Paraná, and the disease was present in three of them. In the COSAVE region, besides Brazil, it is also a In-Country Quarantine Plague for Argentina and Paraguay and considered an Absent Quarantine Plague or phytosanitary alert for the others.
The diaphorina citri is 2 to 3 millimeters long, has a gray coloration with dark spots on the wings and feeds on both new shoots and mature leaves, with higher incidence in new shoots. The initial symptoms of the disease appear with the yellowing of the leaves, in young plants as well as in plants in production, in contrast with the other green leaves of the branch. With the progress of the infection there is an intense defoliation and infection of other branches, taking the entire canopy, leading to drought and death of plants. The symptoms in the fruits are yellow and green spots on its center, reduced size and deformation. Internally, the columella is deformed and with the presence of yellowish vessels and the seeds are destroyed and small. The presence of the disease in the orchard impairs both the operational cost of the citrus produces by the increase in expenses with the control of the disease through inspections, spraying, eradication and replanting, as well as a reduction in the revenue, since there is a decrease in the productivity of these affected plants. According to the FAO, the increase in production costs due to the presence of HLB in Florida was up to 50%. In Mexico, in the first year in which the disease was detected in the country, it is estimated that there was a 50% reduction in the productivity of the affected plants, and it is expected that within a five-year period and in a high 1 USDA, 2016-2017 (July 2017), Markestrat (August, 2017).
impact disease area, the potential losses of producing areas would be 41% of the country’s total production.
Still, according to the FAO, the presence of the pest has caused citrus areas in Africa and Asia to move to places that are not conducive to pest and vector development. The losses caused by the increase in production costs mainly affect small and medium-sized producers, who are less skilled and have less capital. Employment both in the field and in the agroindustry is directly affected by the reduction and loss of production. Furthermore, it is important to take into account the associated environmental impacts, mainly by eradicating and burning the affected plants and by the intensive use of insecticides used in vector control.
There is no eradication treatment for the disease and all citrus plants grown commercially in Brazil are susceptible to it and the insect vector. The control is done through the use of healthy saplings and seedlings, production of seedlings in certified nurseries protected with anti-aids, constant monitoring and eradication of plants with symptoms, monitoring of the vector in the field through traps and chemical control of the vector (Fundecitrus, 2016).
Citrus moult is considered the most important input in orchard formation. In Brazil, the Normative Instruction of the Ministry of Agriculture, Livestock and Supply (MAPA) No. 48 of September 24, 2013 establishes the norms of production and commercialization of citrus propagation material as well as its identity and quality standards, valid throughout the National Territory. The Normative Instruction does not prohibit the production of seedlings in the field, but prohibits the production of seedlings using soil, which, practically, makes the open-pit production system unfeasible. In addition, according to IN 48/2013, the seedlings should be produced in two categories: Mute and Certified seedlings. Certified seedlings are capable of ensuring genetic quality and phytosanitary purity, preventing the plant from leaving the contaminated nursery and reaching the field with its compromised productivity and shelf life. They should be produced in an environment protected against disease vectors, called screened nurseries, using pathogen-free substrates and weed propagules in containers arranged on benches, from seed of rootstocks and cultivars-cup also be certified.
The nursery owner must be registered as a producer of seedlings in the National Register of Seeds and Seedlings (Renasem by its acronym in Portuguese) and the nursery must be registered with the Ministry of Agriculture, Livestock and Supply (MAPA). This must be properly characterized as to its geodesic coordinates (latitude and longitude), to present a detailed road map for access to the property, to have a sketch of the production area and contracts with plant certifiers, when it production of certified seedlings is required (MAPA, 2013).
Some states have state legislations (Norms, Resolutions, etc.) with more rigorous criteria than the federal ones, aiming at an even greater qualification of the sys-tems of production of seedlings. For example, in the state of São Paulo, the largest producer of oranges in the country, the Norms of the Agricultural and Livestock Defense Coordination No. 5, of February 3, 2005, established standards for plant health protection measures and certification of phytosanitary compliance of citrus groves in that state.
Given the extent of the citrus sector in the Brazilian agricultural production and the losses caused by HLB in Brazil and elsewhere in the world, the production of seedlings in certified nurseries as a phytosanitary measure is considered funda-mental to contain the disease progression and ensure the maintenance of citrus production (Carvalho, 2004).
II.
METHODOLOGY
The methodology used for this case study was the MEIS (Socioeconomic Impact Assessment Methodology, MEIS by its acronym in Spanish) and followed its imple-mentation guide.
Based on scientific principles, MEIS is an impact assessment methodology, created by JS/Brazil and adapted to the needs of the COSAVE project, which makes a wide and innovative evaluation of social programs and policies, analyzing three spheres of performance: cost-efficacy, cost-benefit, and equity. The methodology incorporates different internationally recognized valuation techniques, and incorporates different elements of economic valuation methods from development banks such as the World Bank. The measurement of impacts on social indexes is also incorporated and based on several Equity Analysis metrics (for example, Hoover index).
Therefore, this case study used all the steps established in the Guide for the Implementation of the Socioeconomic Impact Assessment Methodology: definition of the logical framework for evaluation; elaboration of form for data collection; collection of endogenous and exogenous data; and cost-efficacy, cost-benefit analysis and social equity.
As described later, the case study also included the active participation of represen-tatives of the Ministries of Agriculture of all members of COSAVE. This is for both the definition of the logical framework matrix and the refinement of the indicators, data collection and recommendations on factors to be incorporated into the various formulas applied in each of the impact analyzes.
III.
RESULTS
The results of the application of the Socioeconomic Impact Assessment Methodology are subdivided according to their respective stages.
STAGE 1:
ELABORATION OF THE
LOGICAL FRAMEWORK
For the definition of the logical evaluation framework, a workshop was held with representatives of all COSAVE members. Following the MEIS implementation guide, the workshop focused on a consensus establishment discussion of the overall objective, specific objectives, goals and indicators for Impact Assessment. Initially, participants were invited to bring inputs on their perspectives in relation to the overall objective of measuring the impact of seedling production in protected environments. Therefore, several suggestions were made and a first list of possible narratives for the general objective were elaborated, as follows:
Table 1. Individual narrative suggestions for the general objective of the logical framework workshop for the general objective
GENERAL OBJECTIVE (HLB - SEEDLING PRODUCTION IN PROTECTED ENVIRONMENTS PREVENTIVE MEASURE)
To minimize the risk of entry and / or dissemination of the HLB pest in order to maintain the profitability and sustainability of the production: a) Improve the economic income of the citrus sector, b) employment, c) food security
Export of healthy fruits without phytosanitary requirements for the pest, generating more jobs in the citrus sector
Improve the quality of food for the population by consuming fruit placed on the market at appropriate prices
Control and monitoring of HLB avoiding its dispersion in established crops
contain the advance of the disease in the country to maintain the production of quality and sustainability of the sector
Sustainability of citrus production, preserve regional economies, based on citrus production Get a healthy and quality citrus production, generalize the use of citrus plants of sanity and certified quality.
Generate phytosanitary protection through the implementation of seedling production in certified nurseries
However, participants were asked to have the suggestions consolidated into a single overall impact objective. During the discussions, arguments were made about the importance of establishing a general goal that was not only within the control zone
of the measure, but which on that established broader impact aspects, such as the economic and social dimensions.
Therefore, aspects that were limited to issues of implementation of the measure, such as “production of seedlings in certified nurseries” were transferred to a more specific discussion within the specific objectives. Thus, after several arguments, the overall objective of the Impact Assessment was established as:
Minimize the risk of entry and / or dispersion of the HLB pest to maintain the profitability and sustainability of the Citrus Sector
With the definition of the general impact objective, specific targets were assigned for its best quantification. Five goals were established:
a_ To improve the economic income of the citrus sector b_ Generate and maintain jobs
c_ Contribute to and guarantee food security
d_ Contain the pest in the three Brazilian States in which HLB is present
e_ Avoid dispersion of the pest to other municipalities from the affected states These goals were then used not only to define quantitative aspects to be assessed against the overall objective but also to contribute to the definition of quantifiable indicators.
The Table 2 shows the list of indicators defined by consensus for the Impact Assessment of the measures.
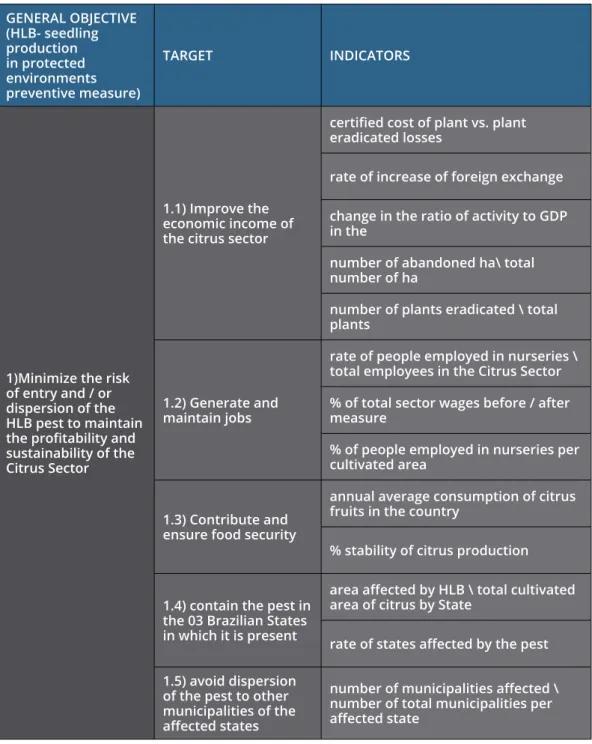
Table 2. Consolidation of the narrative of the general objective of impact, its goals and indicators GENERAL OBJECTIVE (HLB- seedling production in protected environments preventive measure) TARGET INDICATORS
1)Minimize the risk of entry and / or dispersion of the HLB pest to maintain the profitability and sustainability of the Citrus Sector
1.1) Improve the economic income of the citrus sector
certified cost of plant vs. plant eradicated losses
rate of increase of foreign exchange change in the ratio of activity to GDP in the
number of abandoned ha\ total number of ha
number of plants eradicated \ total plants
1.2) Generate and maintain jobs
rate of people employed in nurseries \ total employees in the Citrus Sector % of total sector wages before / after measure
% of people employed in nurseries per cultivated area
1.3) Contribute and ensure food security
annual average consumption of citrus fruits in the country
% stability of citrus production 1.4) contain the pest in
the 03 Brazilian States in which it is present
area affected by HLB \ total cultivated area of citrus by State
rate of states affected by the pest 1.5) avoid dispersion
of the pest to other municipalities of the affected states
number of municipalities affected \ number of total municipalities per affected state
It is interesting to note that after the definition of the targets, it was possible to establish 14 specific indicators of Impact Assessment of HLB risk mitigation measures.
After defining the overall objective, its goals and indicators, the working group defined the specific objectives of the Logical Framework. As mentioned earlier, the specific objectives relate directly to specific actions related to the implementation of the measure. Therefore, the specific objectives were established by consensus:
1_ Produce certified seedlings in nurseries 2_ Control the transit of propagating material
In addition, specific targets and indicators were suggested for the quantification of these specific objectives, as shown below:
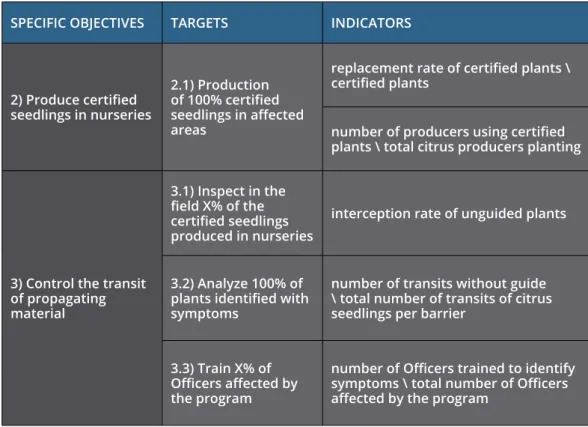
Table 3. Consolidation of the narrative of the specific objectives, their goals and indicators SPECIFIC OBJECTIVES TARGETS INDICATORS
2) Produce certified seedlings in nurseries 2.1) Production of 100% certified seedlings in affected areas
replacement rate of certified plants \ certified plants
number of producers using certified plants \ total citrus producers planting
3) Control the transit of propagating material 3.1) Inspect in the field X% of the certified seedlings produced in nurseries
interception rate of unguided plants
3.2) Analyze 100% of plants identified with symptoms
number of transits without guide \ total number of transits of citrus seedlings per barrier
3.3) Train X% of Officers affected by the program
number of Officers trained to identify symptoms \ total number of Officers affected by the program
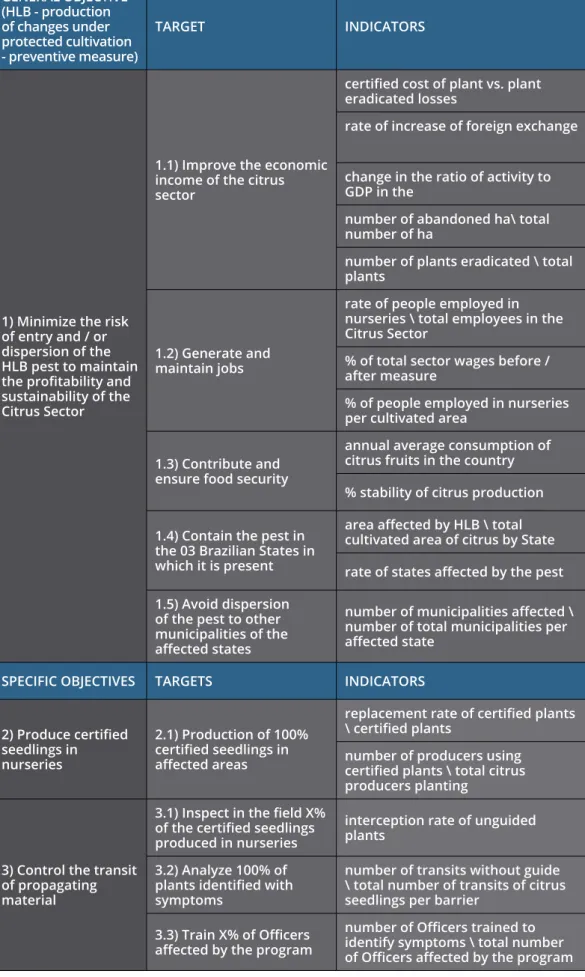
At the end of the study, a logical framework of impact assessment of measures of seedling production in protected environments in relation to HLB in Brazil was consolidated:
Table 4. Consolidation of the Logical Framework (HLB in Brazil) GENERAL OBJECTIVE (HLB - production of changes under protected cultivation - preventive measure) TARGET INDICATORS
1) Minimize the risk of entry and / or dispersion of the HLB pest to maintain the profitability and sustainability of the Citrus Sector
1.1) Improve the economic income of the citrus sector
certified cost of plant vs. plant eradicated losses
rate of increase of foreign exchange change in the ratio of activity to GDP in the
number of abandoned ha\ total number of ha
number of plants eradicated \ total plants
1.2) Generate and maintain jobs
rate of people employed in nurseries \ total employees in the Citrus Sector
% of total sector wages before / after measure
% of people employed in nurseries per cultivated area
1.3) Contribute and ensure food security
annual average consumption of citrus fruits in the country % stability of citrus production 1.4) Contain the pest in
the 03 Brazilian States in which it is present
area affected by HLB \ total cultivated area of citrus by State rate of states affected by the pest 1.5) Avoid dispersion
of the pest to other municipalities of the affected states
number of municipalities affected \ number of total municipalities per affected state
SPECIFIC OBJECTIVES TARGETS INDICATORS 2) Produce certified seedlings in nurseries 2.1) Production of 100% certified seedlings in affected areas
replacement rate of certified plants \ certified plants
number of producers using certified plants \ total citrus producers planting
3) Control the transit of propagating material
3.1) Inspect in the field X% of the certified seedlings produced in nurseries
interception rate of unguided plants
3.2) Analyze 100% of plants identified with symptoms
number of transits without guide \ total number of transits of citrus seedlings per barrier
3.3) Train X% of Officers affected by the program
number of Officers trained to identify symptoms \ total number of Officers affected by the program
STAGE 2:
ELABORATION OF THE DATA
COLLECTION FORM
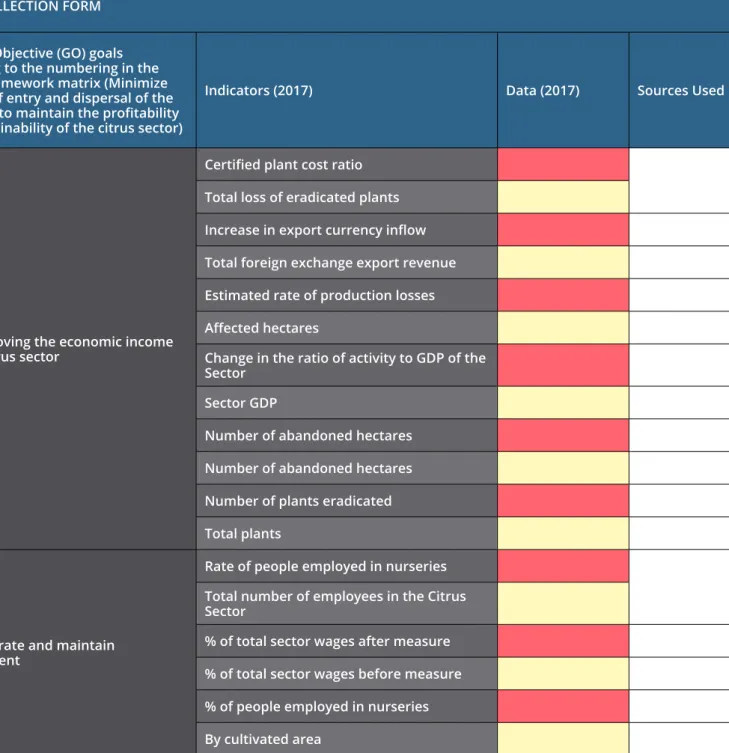
From the definition of all the indicators of the logical framework, a form was gen-erated with the decoupling of the indicators in data needed to be obtained in the field for their respective compositions and also the indication of exogenous data that would be fundamental for the use in the economic and social analyzes. Next, the generated form for the data collection is presented based on all the indicators established in the evaluative logical framew ork:
Table 5. Data collection form DATA COLLECTION FORM General Objective (GO) goals according to the numbering in the logical framework matrix (Minimize the risk of entry and dispersal of the HLB pest to maintain the profitability and sustainability of the citrus sector)
Indicators (2017) Data (2017) Sources Used
1.1) Improving the economic income of the citrus sector
Certified plant cost ratio
Total loss of eradicated plants
Increase in export currency inflow
Total foreign exchange export revenue
Estimated rate of production losses
Affected hectares
Change in the ratio of activity to GDP of the
Sector
Sector GDP
Number of abandoned hectares
Number of abandoned hectares
Number of plants eradicated
Total plants
1.2) Generate and maintain employment
Rate of people employed in nurseries
Total number of employees in the Citrus
Sector
% of total sector wages after measure
% of total sector wages before measure
% of people employed in nurseries
1.3) Contribute and ensure food security
Annual average consumption of citrus
fruits in the country
Total population
% stability of citrus production
Total citrus fruit
1.4) contain the pest in the 03 Brazilian states in which it is present
Surface affected by HLB
Total area under cultivation of citrus by
State
Rate of states affected by the pest
Total states
1.5) avoid dispersion of the pest to other municipalities in the affected states
Number of municipalities affected
Number of total municipalities per affected
state
DATA COLLECTION FORM
Specific Objectives (OEs) according to numbering in the logical framework
matrix (by cost center) Data 2017 Indicators (2017) Sources Used
2) Produce certified seedlings in nurseries
Replacement rate of certified plants
Non certified plants
Number of producers using certified plants
Total of citrus growers planting
3) Control the transit of propagating material
Interception rate of unguided plants
Total of guides
Number of transits without guide
Total number of transits of citrus plants per
barrier
Number of Officers trained to identify the
symptoms
Number of Officers affected by the program
List of Essential Inputs Data 2017 Observation
1) Number of cost centers
2) Amount invested in 2017 by MAPA
List of Essential Inputs Data 2017 Observation
Financial value invested in 2017 in the
List of non-financial inputs Data 2017 Observation
Other non-financial costs (space rent)
Costs of producers
Prices practiced (main supplies) Practical Pricing (2017) Market Prices (2017)
1) Labor hour
2) Computer
3) Vehicle
4) Uniform
Average Distortion
Discounting Factor Data 2017 Observation
Official Interest Rate
Economic and Social Profile Indicators Data 2017 Observation
Number of Municipalities Affected
Human Development Index of
affected municipalities (IDHM)
Rate of agricultural units that have
nurseries per affected municipality
Epidemiological Factors NA Observation
Pest Propagation Rate
Prevalence of the pest in affected
municipalities
As shown above, for each indicator, the data is decomposed into numerators (data cells to fill in red) and denominators (data cells to fill in yellow). The fields at the bottom of the form with blue header are the data required for economic and social analysis, but are not part of any indicator established in the logical framework. However, before the submission of the forms, the Impact Assessment Cost Centers were defined. Therefore, the public agencies implementing the measure of the states of Minas Gerais, Paraná and São Paulo (states directly affected by HLB in Brazil) were considered the three Cost Centers of the Evaluation.
In addition, the form went through a pre-testing step to facilitate the understanding and flow of data requested for the three cost centers.
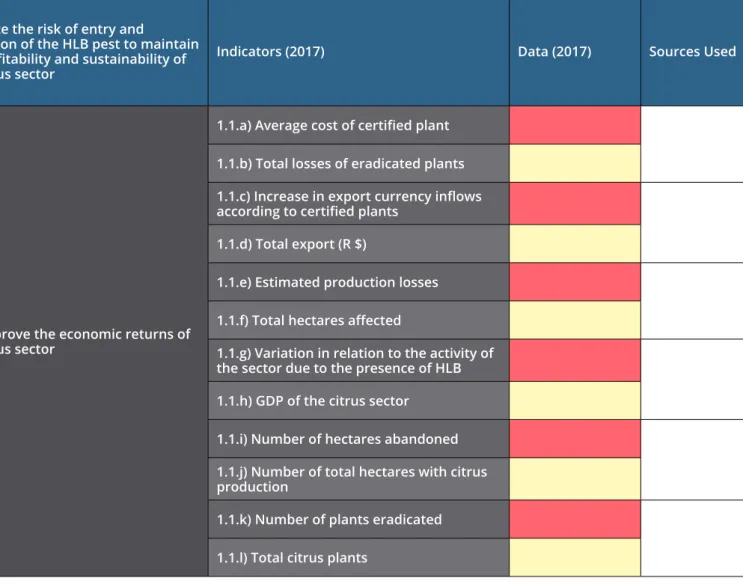
As an illustration, the Table 6 shows the impact data on the initial form that will later incorporate changes that will give the final version.
Table 6. Data on the impact of HLB in the state (Initial Version) Minimize the risk of entry and
dispersion of the HLB pest to maintain the profitability and sustainability of the citrus sector
Indicators (2017) Data (2017) Sources Used
1.1) Improve the economic returns of the citrus sector
1.1.a) Average cost of certified plant
1.1.b) Total losses of eradicated plants
1.1.c) Increase in export currency inflows according to certified plants
1.1.d) Total export (R $)
1.1.e) Estimated production losses
1.1.f) Total hectares affected
1.1.g) Variation in relation to the activity of the sector due to the presence of HLB
1.1.h) GDP of the citrus sector
1.1.i) Number of hectares abandoned
1.1.j) Number of total hectares with citrus
production
1.1.k) Number of plants eradicated
1.1.l) Total citrus plants
In this case, the suggestions were made by members of the MAPA team. There were a number of observations on the types of measures to be used for each data, the inclusion of a new collection item and the change in the order of data to be collected to give more adherence to the instrument.
Thus, the final version was established this way:
Table 7. Data on the impact of HLB in the state (Final Version) Minimize the risk of entry and
dispersion of the HLB pest to maintain the profitability and sustainability of the citrus sector
Indicators (2017) Data (2017) Sources Used
1.1) Improving the economic returns of the citrus sector
1.1.a) Number of total hectares with citrus
production
1.1.b) Total citrus plants
1.1.c) Number of plants eradicated
1.1.d) Average cost of certified seedlings (R $) 1.1.e) Estimated loss of production (tons) of the total eradicated plants.
1.1.f) Number of hectares abandoned
1.1.g) Total hectares affected
1.1.h) Estimated production losses3
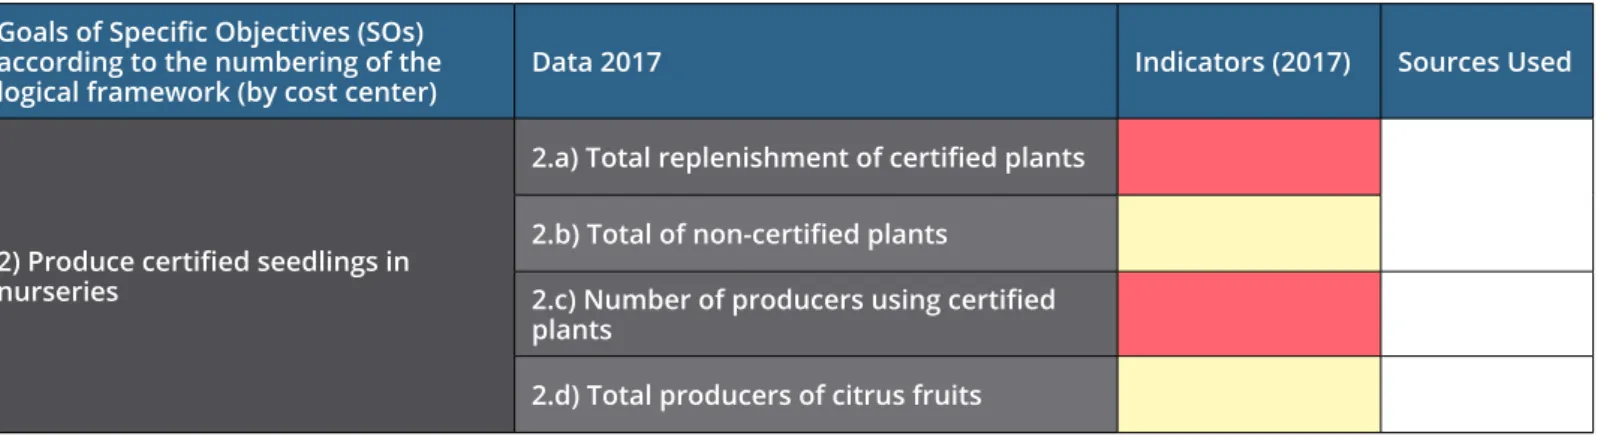
The initial version of the management data collection form is included in Table 8.
Table 8. HLB management data on the state (Initial Version) Goals of Specific Objectives (SOs)
according to the numbering of the
logical framework (by cost center) Data 2017 Indicators (2017) Sources Used
2) Produce certified seedlings in nurseries
2.a) Total replenishment of certified plants
2.b) Total of non-certified plants
2.c) Number of producers using certified
plants
2.d) Total producers of citrus fruits
After the review by the MAPA oficers, suggestions were made and based on these
recommendations, the final version was established in Table 9.2 3
2 Here the loss of production of eradicated plants should be calculated based on the average productivity of a plant.
3 Here calculate the production losses, eradicated plus abandoned, express in tones. Note: the value defined here will serve as the basis for the calculation of item 1.1.h
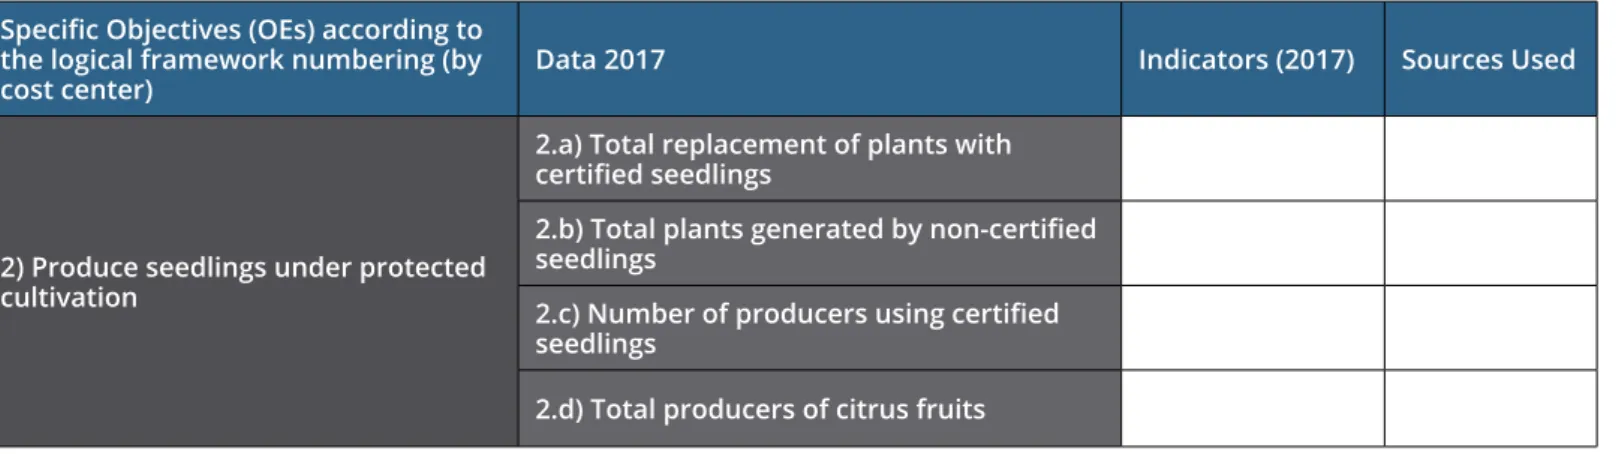
Table 9. HLB management data on the state (Final Version) Specific Objectives (OEs) according to
the logical framework numbering (by
cost center) Data 2017 Indicators (2017) Sources Used
2) Produce seedlings under protected cultivation
2.a) Total replacement of plants with
certified seedlings
2.b) Total plants generated by non-certified seedlings
2.c) Number of producers using certified
seedlings
2.d) Total producers of citrus fruits
STAGE 3:
DATA COLLECTION
At the data collection stage, consultations were held with the managers of the localities affected by HLB in Brazil (the states of São Paulo, Minas Gerais and Paraná) and also with Fundecitrus (a private entity with public goals working in the research area of HLB in the Brazilian citrus sector). For each of these locations, a form has been sent to the local agencies responsible for implementing the measures for their respective completion.
In addition, based on a working group formed at the Ministry of Agriculture for the implementation of the case study, a seminar was held in Brasília in August 2018 for the presentation of the final data.
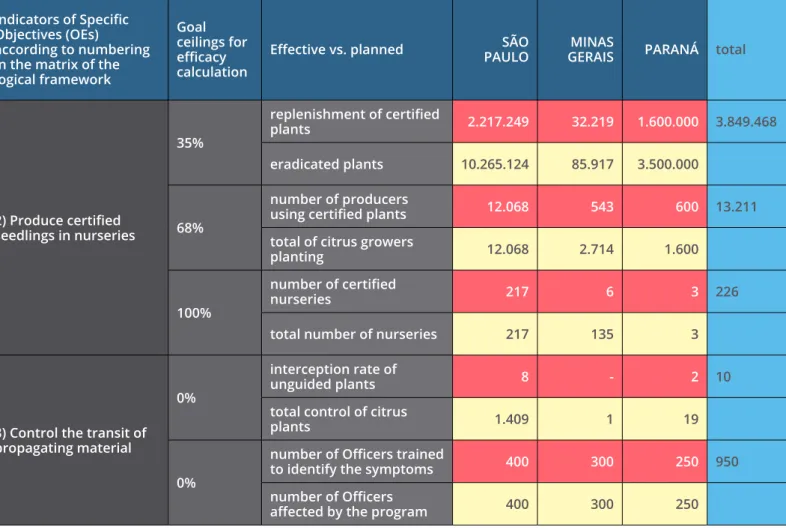
Table 10. Efficacy data Indicators of Specific Objectives (OEs)
according to numbering in the matrix of the logical framework
Goal ceilings for efficacy calculation
Effective vs. planned PAULOSÃO GERAISMINAS PARANÁ total
2) Produce certified seedlings in nurseries 35% replenishment of certified plants 2.217.249 32.219 1.600.000 3.849.468 eradicated plants 10.265.124 85.917 3.500.000 68% number of producers
using certified plants 12.068 543 600 13.211 total of citrus growers
planting 12.068 2.714 1.600
100%
number of certified
nurseries 217 6 3 226
total number of nurseries 217 135 3
3) Control the transit of propagating material
0%
interception rate of
unguided plants 8 - 2 10
total control of citrus
plants 1.409 1 19
0%
number of Officers trained
to identify the symptoms 400 300 250 950 number of Officers
affected by the program 400 300 250
STAGE 4:
FINANCIAL, ECONOMIC AND
SOCIAL ANALYSIS
Financial analysis (cost-efficacy)
The Table 10 was filled-out with data based on the indicators corresponding to the specific objectives which were defined in the Logical Framework and using the data provided by the three cost centers:
As demonstrated in Table 10, for the three cost centers, more than 3.800 thousand seedlings were certified in 2017, more than 13.000 farmers used certified plants in citrus cultivation, 226 nurseries were certified in protected environments, 10 transportation intercepts unguided plants were found in phytosanitary barriers and 950 officers were trained to identify HLB symptoms.
However, as it has also been demonstrated previously, these data should be ana-lyzed based on a specific universe of performance. For example, the state of Paraná trained 250 officers to identify symptoms of HLB, this represents the universe of officers who should have been trained. As the universe of officers who should have been trained was exactly 250, Paraná achieved 100% gross efficacy in the training of officers.
This relationship was calculated for all indicators established for the efficacy analysis at each of the cost centers, as shown below in Table 11.
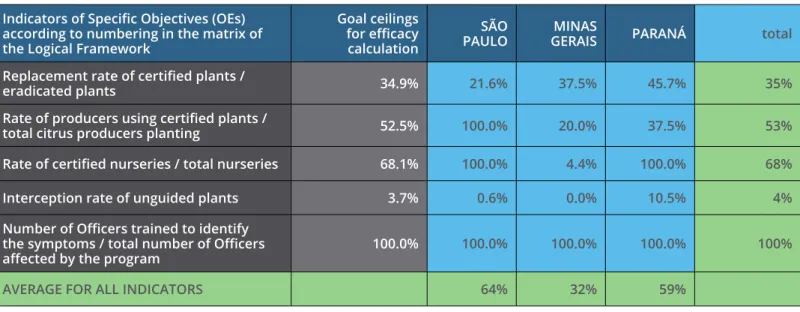
Table 11. Rates of efficacy indicators Indicators of Specific Objectives (OEs) according to numbering in the matrix of the Logical Framework
Goal ceilings for efficacy calculation
SÃO
PAULO MINAS GERAIS PARANÁ total Replacement rate of certified plants /
eradicated plants 34.9% 21.6% 37.5% 45.7% 35%
Rate of producers using certified plants /
total citrus producers planting 52.5% 100.0% 20.0% 37.5% 53% Rate of certified nurseries / total nurseries 68.1% 100.0% 4.4% 100.0% 68%
Interception rate of unguided plants 3.7% 0.6% 0.0% 10.5% 4%
Number of Officers trained to identify the symptoms / total number of Officers
affected by the program 100.0% 100.0% 100.0% 100.0% 100%
AVERAGE FOR ALL INDICATORS 64% 32% 59%
However, it should be noted that the gross efficacy rates above can only be consid-ered after adjusting them to the targets established for each indicator. Therefore, for example, even considering that Paraná reached a 45.7% rate of replacement of certified plants, the efficacy benchmark established is the average achieved by the three Cost Centers (34.9%). That is, Paraná, in this case, actually reached 100% of the established goal.
Since the targets are minimum benchmarks, values that exceed 100% have been adjusted. For example, as Paraná achieved more than 100% of the certified plant replacement rate, the use of the 45.7% minimum benchmark target made Paraná reach more than 100% of the average established goal. However, this efficacy indi-cator should be set at a maximum of 100%, since the target is always the minimum value established.
With this final adjustment, the cost centers reached the following net efficacy values:
Table 12. Efficacy rates
Indicators of Specific Objectives (OEs) according to numbering
in the matrix of the Logical Framework SÃO PAULO MINAS GERAIS PARANÁ MEDIA INDICADOR
MEDIA 75% 49% 94%
Replacement rate of certified plants / eradicated plants 62% 100% 100% 87%
Rate of producers using certified plants / total citrus producers
planting 100% 38% 71% 70%
Rate of certified nurseries / total nurseries 100% 7% 100% 69%
Interception rate of unguided plants 15% 0% 100% 38%
Number of Officers trained to identify the symptoms / total
As shown previously, the cost center with the most significant efficacy value was Paraná, which reached 94% of the average management value of the phytosanitary measure. São Paulo comes next with an average of 75% and finally, the state of Minas Gerais with 49%.
Regarding the specific efficacy indicators, the only one that reached 100% of the established goals in all cost centers was the rate of officers trained to identify symptoms. The rate with the lowest level of efficacy was the traffic interception of unguided seedlings, with only 38% of the achieved goal.
For a comparison of these rates of efficacy with the financial amounts used by each cost center for the implementation of the measures, an analysis of the financial resources used was carried out.
The following table shows the specific budgets used in each cost center in 2017 and their proportion to the total values used.
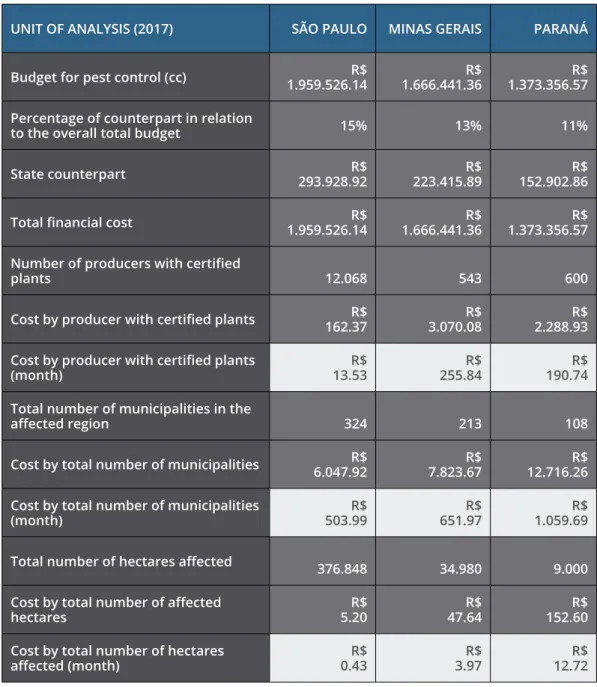
Table 13. Final budget of the measure for the three cost centers
UNIT OF ANALYSIS (2017) SÃO PAULO MINAS GERAIS PARANÁ Budget for pest control (cc) 1.959.526.14 R$ 1.666.441.36 R$ 1.373.356.57 R$ Percentage of counterpart in relation
to the overall total budget 15% 13% 11%
State counterpart 293.928.92 R$ 223.415.89 R$ 152.902.86 R$ Total financial cost 1.959.526.14 R$ 1.666.441.36 R$ 1.373.356.57 R$ Number of producers with certified
plants 12.068 543 600 Cost by producer with certified plants 162.37 R$ 3.070.08 R$ 2.288.93 R$ Cost by producer with certified plants
(month) 13.53 R$ 255.84 R$ 190.74 R$
Total number of municipalities in the
affected region 324 213 108 Cost by total number of municipalities 6.047.92 R$ 7.823.67 R$ 12.716.26 R$ Cost by total number of municipalities
(month) 503.99 R$ 651.97 R$ 1.059.69 R$
Total number of hectares affected 376.848 34.980 9.000 Cost by total number of affected
hectares 5.20 R$ 47.64 R$ 152.60 R$ Cost by total number of hectares
Based on these proportions, a counterpart value was established in the participation of the Cost Centers for the implementation of the measure. Thus, even the agreement of MAPA with São Paulo directly applying R $ 1.6 million in the implementation of the phytosanitary measure, the counterpart value of R $ 293 thousand of the budget used by the Cost Center in São Paulo was added. Thus, São Paulo had a cost of R $ 1.9 million, Minas Gerais had a cost of R $ 1.66 million and Paraná had a cost of R $ 1.3 million for the implementation of phytosanitary measures.
Taking into account as the main unit of analysis properties using certified plants, the total cost was used to calculate the cost of the measure per producer. Thus, even though São Paulo presented the highest absolute cost, the cost per producer with certified plants was the lowest (R $ 162.37 per producer). Paraná, with the second lowest budget, presented the value per producer with certified plants higher than São Paulo (R $ 2,288 per producer).
The cost analysis also shows that the monthly cost of the measure in 2017 was R $ 13.53 per producer with certified plants in São Paulo, R $ 255.84 in Minas Gerais and R $ 190.74 in Paraná.
The producer analysis unit with certified plants appears to be the best unit of analysis for a final cost-efficacy Impact of the measure, but other units of analysis were also used, such as cost per affected municipality and cost per hectare affected.
From the results of the efficiency analysis and the average costs per unit of analysis, a cost-efficacy correlation was performed. The following table presents the financial costs per producer with certified plant incorporating the efficacy rates:
Table 14. Final cost-efficacy analysis of cost centers
UNIT OF ANALYSIS (2017) SÃO PAULO MINAS GERAIS PARANÁ Cost by producer with certified
plants (month) 13.53 R$ 255.84 R$ 190.74 R$
Institutional efficacy rate 75% 49% 94%
Cost-efficacy (year) 17.94 R$ 522.94 R$ 202.30 R$ Cost-efficacy (month) 1.49 R$ 43.58 R$ 16.86 R$
It is interesting to note that in this case the difference in cost-efficacy of São Paulo for the analysis unit of Minas Gerais became even more significant, but the values between São Paulo and Paraná came closer. From a difference of approximately R $ 240.00 between São Paulo and Minas Gerais in the average cost per producer with certified plants, it reached more than R $ 505.00 in the final cost-efficacy analysis. The difference between Minas Gerais and Paraná also increased significantly, since Paraná presented a higher efficacy rate than Minas Gerais. In this case, the average difference of R $ 65.00 per producer with certified plants increased to R $ 320.00.
A pooled analysis of the three cost centers was also performed to jointly verify the levels of profitability of the measure, as shown below:
Table 15. Combined cost-efficacy analysis of the three cost centers
Total of producers with certified plants 13.211 Total invested (2017) R$ 4.999.324.07 Average cost by producer with certified plants
(year) R$ 378.43
Average cost by producers with certified plants
(month) R$ 31.54
Average efficacy rate 73%
Average cost-efficacy by producer with certified
plants (month) R$ 43.27 Cost-efficacy by municipality (month) R$ 886.24 Average cost-efficacy by hectare (month) R$ 1.36
In this case, considering that 13,211 producers with certified plants were found in the three cost centers, an overall investment total of R $ 5 million, the average cost per producer with certified plants per year reached R $ 378.43. This corresponds to a monthly value of R $ 31.54. Taking into account the average efficacy rate for all indicators and cost centers of 73%, a final adjustment was made in relation to the monthly amount, totaling R $ 43.27 per month. For the other two units of analysis, the monthly cost-efficacy averages were R $ 88.24 per municipality and R $ 1.36 per affected hectare.
Economic analysis (cost-benefit) from São Paulo
For the economic analysis, adjustments in the financial cost of the São Paulo cost center were carried out to incorporate other inputs used during the im-plementation of the measure by the state, to verify possible price distortions practiced in the use of financial resources by the state in relation to prices found in the market, and to incorporate costs incurred by the producers for the effective implementation of the measure (production of seedlings in controlled environments - nurseries).
Therefore, the data in Table 16 were used to analyze the distortion of prices on the market:
Table 16. Analysis of the distortion of prices of specific inputs
Value Market 1 Market 2 Market 3 Market 4 Market 5
Item Valor Valor Valor Valor Valor
jeans with embroidery 33.22 26 8 12
brim uniform with embroidery 41 125 93.9 80
petal scissor type: metallic scissors with extensive cable from 46.5 to 78cm, carbon
steel blades, plastic handle 86.89 109.9 119.9 159.9
portable printer 3.000.00 1.661.55 1.993.21 1.549.90
color printer with ink tank 1.525.00 743.07 1079.1 1.299.99 1.484.10 1.487.07 tablet: processor speed 1.9ghz + 1.3ghz; octa
core processor type; size toa 9.7 2.637.50 2.184.05 2.413.95 1.499.90 manual cost sprayer: tank with maximum
capacity: 12 liters, material polyethylene, minimum diameter of 100mm; piston type pump; material polypropylene, minimum working pressure 6kgf / cm², length length 600mm, spear in stainless steel, length of minimum 1.350mm hose, nozzle with adjustment, regulating ribbons.
139.95 165.66 102.51 131.5 129.9 121.1
Total Distortion
6.64%
A distortion in the average prices paid for essential inputs at the state level reached 6.64% lower than the market values.
In addition, a survey with producers showed that the measure led to an addi-tional investment of R $ 16.6 million in private capital, taking into account the total number of seedlings produced in São Paulo and the cost of production per seedling (R $ 7.50).
Table 17. Economic costs of eradication, abandonment and production of certified plants
Values Data 2017 KG Wholesale Price
Total eradication + citrus
abandonment 944,029.3 tonnes of citrus fruit R $ 1.5 Kilo Certified plants (produced under
protected cultivation) 2.217.249 R $ 7.5 per plant
Other economic costs were also identified from an analysis of the indicators of the overall impact objective of the measure. For example, the cost of plant eradication
and abandonment reached R $ 1.4 billion in São Paulo. This is due to the lost amount of tons of citrus (944029.30) and the highest price per kilo (R $ 1.50).
Therefore, the total economic cost of the measure in 2017 was estimated at R $ 1.5 billion. It is interesting to note that this economic cost represents a value 700 times higher than the financial value.
On the benefit side, two indicators were found for a projected economic benefit in the next 10 years.
Table 18. Economic benefits of employment generation and certified plants
Values Data 2017 Benefit
Employment Nurseries 226 nurseries with five new jobs on average R$29.965,00 year Certified Plants
(Seedlings produced under
protected cultivation) 2.217.249 86 kilos per plant year
An increase in production of certified plants, estimated at 86 kilos per plant year, totaling an economic benefit of more than 286 million reais a year and the generation of more than 1,000 jobs in nurseries for certification of seedlings. In the latter, it is taken into account an average salary + benefit + charges over 12 months plus the 13th. salary, totaling an economic benefit of 33.8 million reais per year.
Table 19. Calculation of the economic benefits of job creation and certified plants
Benefit TOTAL VALUE FORMULA
Gain in productivity (Year) R$ 286.025.121.00 =86*2217249*1.5 Gain in employment generation R$ 33.860.450.00 =226*5*29965
Based on these figures, a cost-benefit economic projection model was developed for the calculation of the cost-benefit ratio, net present value and internal rate of return of the phytosanitary measure.
Table 20. Economic Cost-Benefit Calculation
Year Gross Cost Gross Benefit Incremental BL Factor (6,5%) Pres Value (6,5%) 1 R$ 1.529.849.925.41 R$ - -R$ 1.529.849.925.41 0.939 -R$ 1.436.478.803.20 2 R$ 19.822.644.99 R$ 319.885.571.00 R$ 300.062.926.01 0.882 R$ 264.553.264.13 3 R$ 19.822.644.99 R$ 319.885.571.00 R$ 300.062.926.01 0.828 R$ 248.406.820.78 4 R$ 19.822.644.99 R$ 319.885.571.00 R$ 300.062.926.01 0.777 R$ 233.245.841.11 5 R$ 19.822.644.99 R$ 319.885.571.00 R$ 300.062.926.01 0.730 R$ 219.010.179.45 6 R$ 19.822.644.99 R$ 319.885.571.00 R$ 300.062.926.01 0.685 R$ 205.643.360.98 7-10 R$ 19.822.644.99 R$ 319.885.571.00 R$ 300.062.926.01 2.348 R$ 704.492.738.48
NPV R$438.873.401.73
Therefore, based on a discount factor of 6.5% (Selic rate in Brazil in June 2018), it was calculated that, over 10 years and based on the measure already implemented, for each R $ invested, there is a return of R $ 1.28. In addition, the net present value of the measure reaches more than R $ 438 million.
Finally, the Internal Rate of Return of the measure is 149%. This means that, even if there is no budget available for the implementation of the measure, there is a justification for loans to be made to credit organizations to ensure proper imple-mentation of the measures up to this rate level.
Social analysis (equity):
For the social analysis, the main unit of analysis was the level of incidence in the properties affected by the measure. Moreover, the size of the properties was verified. Based on these two characteristics, the Hoover index of equitable distribution was calculated. Recalling that indexes closer to one means extreme concentration of incidence on a given population with more vulnerable social characteristics and zero means equitable distribution of incidence across different groups.
The data on the number of properties affected primarily by the measure were collected for three groups:
1_ Properties with less than 10 thousand plants
2_ Properties with more than 10 thousand and less than 100 thousand plants. 3_ Properties with more than 100 thousand plants and proportion of plants
Average Incidence Entre >10 e <100 thousand plants <10 Thousand plants 0,058 (2015) 0,044 (2017) Decrease by 23.8% >100 thousand plants
The results of the survey are presented in Table 21.
Table 21. Analysis of epidemiological concentration between the three groups (<10;> 10 and <100;> 100,000 plants)
SÃO PAULO (CC) N. OF PROPERTIES <10 THOUSAND PLANTS N. OF PROPERTIES > 10 AND <100 THOUSAND PLANTS N. OF PROPERTIES > 100 THOUSAND PLANTS TOTAL PROPERTIES <100 THOUSAND PLANTTS (SP) PROPORTION OF PROPERTIES <10,000 PLANTS PROPORTION OF PROPERTIES > 10 AND <100 THOUSAND PLANTS PROPORTION OF PROPERTIES > 100 THOUSAND PLANTS INCIDENCE IN PROPERTIES <10,000 PLANTS INCIDENCE IN PROPERTIES > 10 AND <100 THOUSAND PLANTS INCIDENCE IN PROPERTIES > 100 THOUSAND PLANTS
2015 5.149 2.082 357 7.588 0.679 0.274 0.047 32.50 22.56 12.28
2017-2018 3.780 1.733 369 5.882 0.643 0.295 0.063 36.03 29.15 14.88
A1 A2 A3 (A1+A2+A3) E1 E2 E3 (E1+E2+E3) D1 D2 D3 H1 H2 H3 HOOVER
5.149 2.082 357 7.588 167.342.500 46.969.920 4.383.960 218.696.380 -0.087 0.060 0.027 0.087 0.060 0.027 0.058 3.780 1.733 369 5.882 136.193.400 50.516.950 5.490.720 192.201.070 -0.066 0.032 0.034 0.066 0.032 0.034 0.044
As shown in Table 21, the type of property with the highest incidence of HLB is less than 10,000 plants. However, this incidence between 2015 and 2017-2018 slowed down compared to the other two types. It was found that the 2015 Hoover index (0.058) decreased in 2017 to 0.044. That is to say, a reduction of inequality in the distribution of incidence among the three types of property reached 23.8%. This change can also be seen in the Graph 1.
Average Incidence >100 Thousand plants <10 thousand plants 0,050 (2017) 0,039 (2015) Increase by 27,7%
However, it should be noted that when analyzed in pairs, it was verified that much of this reduction in the epidemiological distribution occurred between properties with less than 10 thousand plants and properties with more than 10 thousand and less than 100 thousand plants, as shown below:
Table 22. Analysis of epidemiological concentration between two groups (between <10 and> 10 and <100 thousand plants)
SÃO PAULO (CC) N. OF PROPERTIES <10 THOUSAND PLANTS N. OF PROPERTIES > 10 AND <100 THOUSAND PLANTS TOTAL PROPERTIES <100 THOUSAND PLANTS (SP) PROPORTION OF PROPERTIES <10,000 PLANTS PROPORTION OF PROPERTIES > 10 AND <100 THOUSAND PLANTS INCIDENCE IN PROPERTIES <10,000 PLANTS INCIDENCE IN PROPERTIES > 10 AND <100 THOUSAND PLANTS
2015 5.149 2.082 7.231 0.712 0.288 32.50 22.56 2017-2018 3.780 1.733 5.513 0.686 0.314 36.03 29.15 A1 A2 A1+ A2 E1 E2 (E1+E2) D1 D2 H1 H2 HOOVER 5.149 2.082 7.231 167.342.500 46.969.920 214.312.420 - 0.069 0.069 0.069 0.069 0.069 3.780 1.733 5.513 136.193.400 50.516.950 186.710.350 - 0.044 0.044 0.044 0.044 0.044
In this case, the decrease was even more significant in 36.3%.
However, for the calculation of the Hoover index between properties with less than 10,000 and properties with more than 100 thousand, and also for properties with more than 10,000 and less than 100 thousand and properties with more than 100 thousand, the inequality increased.
In the case of the first comparison, the increase in inequality was 27.7%, as shown in the Graph 2.
In the case of the second comparison, the increase in inequality reached a similar value of 27.1%, as shown in the Graph 3.
Graph 3. Hoover Index for the two groups of Social Analysis (between> 10 and <100 and> 100 thousand plants) Average Incidence >100 thousand plants Between >10 e <100 thousand plants 0,078 (2017) 0,061 (2015) Increase by 27,1%
IV.
CONCLUSION
The phytosanitary measure of seedling production in protected environment represents an important inversion for the Brazilian citrus agricultural sector. Based on the results from the state of São Paulo state economic analysis, the economic benefits reached almost R $ 1.28 for each R $ 1.00 invested. This is very significant considering that the measure requires a series of interventions that initially increase costs for the private and public sectors.
Moreover, the measure reaches a high internal rate of return. This means that the lack of public and/or private budget cannot be used as an excuse for its non-imple-mentation. The resources must be mobilized by governmental budget adjustment or even by national or international credit loans that include the payment of interest. Furthermore, a good level of efficacy was observed with 73% of the goals reached by the three cost centers. In addition, the cost per certified producer reached a small amount of R $ 44.00 per month. This amount also includes the compensation for loss of efficacy.
The cost-efficacy analysis also brings an interesting comparison between the three cost centers and their respective rates of efficacy, financial figures and cost-efficacy ratio. It would be important to exchange experiences and discussions on how these values can be better standardized and good practices disseminated on to those directly involved in implementation of the measure.
The social analysis is also an important dimension. It demonstrates that properties with more than 10 thousand and less than 100 thousand plants are becoming the most vulnerable group for the incidence of HLB in recent years. Therefore, some measures should be implemented to target mid-size properties.
BIBLIOGRAPHY REFERENCES
Carvalho, S.A. (2004) A Produção de Mudas Fiscalizadas e Certificadas de Citros.
Disponible en: <http://www.esalq.usp.br/visaoagricola/sites/default/files/
va02-producao-de-mudas01.pdf>. Acceso 02 jul. 2018.
Coordenadoria de Defesa Agropecuária do Estado de São Paulo (2005). Portaria CDA
n.° 5, de 3 de fevereiro de 2005. Disponible en: <
http://www.defesaagro-pecuaria.sp.gov.br/www/legislacoes/popup.php?action=view&idleg=642.>.
Acceso 02 jul. 2018.
Fundecitrus. (2016) Pragas e Doenças - Greening. Disponível em: <
http://www.fun-decitrus.com.br/doencas/greening/10>. Acceso 02 jul. 2018.
MAPA (2013) Instrução Normativa nº 48 de 24 de setembro de 2013. Disponible
en: <http://sistemasweb.agricultura.gov.br/sislegis/action/detalhaAto.
do?method=consultarLegislacaoFederal>. Acceso 01 jul. 2018.
Neves, M. F. et al. O Retrato da Citricultura Brasileira. In: Neves, M. F.
(Coord.). 1. ed. Ribeirão Preto: Markestrat, 2010. 138 p. Disponível em: http://www.
citrusbr.com/download/Retrato_Citricultura_Brasileira_MarcosFava.pdf>.
Acesso 02 jul. 2018.
Oliveira, R.P.; Scivittaro, W.B.; Carvalho, F.L.C.; Souza, P.V.D; Tarillo, V.R.C; Lima, G.A.S. (2017). Produção de Mudas de Citros en ambiente Protegido. Disponible
en: <https://ainfo.cnptia.embrapa.br/digital/bitstream/item/169602/1/
Documentos-444.pdf>. Acceso 01 jul. 2018.
Santos Filho, H.P.; Barbosa, F.F.L.; Nascimento, A.S. (2009). Greening: a mais Grave
e Destrutiva Doença dos Citros: Nova Ameaça à Citricultura. Disponible en:
<http://ainfo.cnptia.embrapa.br/digital/bitstream/CNPMF2010/26089/1/
Citros31.pdf>. Acceso 02 jul. 2018.
Ronel Roberts; Emma T. Steenkamp; and Gerhard Pietersen. Three novel lineages of ‘Candidatus Liberibacter africanus’ associated with native rutaceous
hosts of Trioza erytreae in South Africa. Disponible en: <http://www.
microbiologyresearch.org/docserver/fulltext/ijsem/65/2/723_ijs069864.