´
Ecole Polytechnique Laboratoire d’Hydrodynamique Th`ese pr´esent´ee pour obtenir le grade de DOCTEUR DE L’´ECOLE POLYTECHNIQUE
Sp´ecialit´e : M´ecanique par
Nicolas Taccoen
On the long-term stability of foams:
strength of an armored bubble and
emergence of global disorder
Th`ese soutenue le 4 d´ecembre 2015 devant le jury compos´e deManouk Abkarian rapporteur Universit´e de Montpellier 2 ´
Elise Lorenceau rapporteur Universit´e Paris-Est Marie-Caroline Jullien examinateur ESPCI ParisTech Fran¸cois Graner pr´esident Universit´e Paris 7 Deniz Z. Gunes invit´e Nestl´e Research Center Charles N. Baroud directeur de th`ese Ecole Polytechnique´
On the long-term stability of foams:
strength of an armored bubble and
emergence of global disorder
Nicolas Taccoen
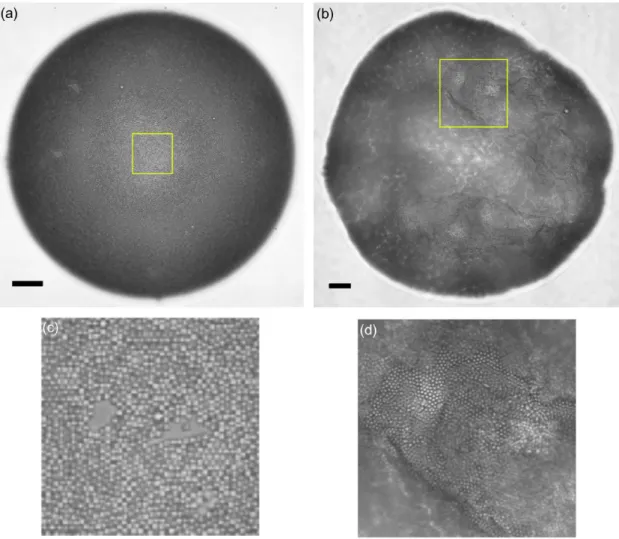
The image on cover shows epifluorescence micrographs of air-in-water bubbles coated with an armor of fluorescent polystyrene particles ( 500 nm). The radii of these bubbles is about 100 µm . The left one is spherical, the middle one has undergone buckling, and the right one is completely crumpled. More details can be found in section3.2 of this thesis.
R´
esum´
e
Une mousse est un ensemble de bulles de gaz, enchˆass´ees dans une matrice continue. Elles sont omnipr´esentes dans de nombreux domaines industriels. En agro-alimentaire, une cr`eme glac´ee peut contenir jusqu’`a 30% d’air, ce qui donne au produit sa texture a´erienne et onctueuse. Mousser un produit cosm´etique alt`ere sa rh´eologie, lui permettant de mieux s’appliquer sur la peau. Le volume apparent est aussi augment´e, limitant ainsi le gaspillage de produit. Incorporer de l’air dans un mat´eriaux de construction lui conf`ere d’excellentes propri´et´es d’isolation thermique et acoustique, tout en l’all´egeant et en r´eduisant son coˆut. N´eanmoins, les bulles composant une mousse sont des objets dynamiques, pour lesquels il n’existe pas d’´etat d’´equilibre. Soit elles gonflent, soit elles se dissolvent et disparaissent, mais elles ne peuvent pas rester stationnaires. Ceci est `a l’origine d’un processus de d´estabilisation des mousses, dans lequel le gaz des petites bulles diffuse dans les plus grosses. Ce ph´enom`ene, appel´e mˆurissement d’Ostwald (MO), explique en partie la faible dur´ee de vie des mousses. La premi`ere partie de cette th`ese s’attache `a comprendre fondamentalement les m´ecanismes physiques expliquant la stabilisation des mousses par des particules solides, une m´ eth-ode ´eprouv´ee pour bloquer le MO. Nous r´eduisons l’´etude de la mousse `a celle d’une unique bulle sph´erique, couverte d’une monocouche de particules collo¨ıdales. L’environnement de la bulle au sein de la mousse est simul´e en variant la pression autour d’elle, tout en observant son comportement. Il apparaˆıt que l’armure collo¨ıdale est capable de bloquer la dissolution du gaz jusqu’`a une certaine pression seuil, au del`a de laquelle la coque s’effondre. Ce flambage est initi´e par des dislocations locales et provoque la dissolution compl`ete de la bulle. La pression seuil de rupture varie avec le rayon R de la bulle selon ∆Pcollapse ∝ R−1, mais ne d´epend pas du diam`etre des particules. Ces
r´esultats sont en d´esaccord avec la th´eorie ´elastique g´en´eralement utilis´ee pour d´ecrire les interfaces couvertes. Nous proposons donc un nouveau mod`ele, fond´e sur un ´equilibre ´energ´etique entre le gain de dissolution du gaz, et le coˆut capillaire de d´eplacement individuel des particules `a l’interface. Ce mod`ele pr´edit bien le comportement de ∆Pcollapse, son insensibilit´e `a la taille des particules, et
l’apparition des dislocations locales. Enfin, nous appliquons cette nouvelle compr´ehension micro-scopique `a un mod`ele classique de MO, montrant ainsi que dans une mousse particulaire, les plus petites bulles se dissolvent, car la r´esistance de l’armure augmente moins vite que la contrainte impos´ee par la mousse environnante. Le dispositif exp´erimental et le cadre th´eorique peuvent ˆetre appliqu´es `a des particules et des armures plus complexes. Dans la seconde partie du travail, nous prenons du recul afin d’observer la d´estabilisation par MO d’une mousse monodisperse stabilis´ee par un tensioactif. Il s’agit d’une mousse mod`ele constitu´ee d’une monocouche de bulles arrang´ees en r´eseau hexagonal 2D, dans une puce microfluidique. Environ 30’000 bulles peuvent ainsi ˆetre suivies individuellement. La mousse initialement monodisperse se d´estabilise vers un ´etat polydisperse, autosimilaire, comme la th´eorie classique le pr´edit. Nous allons plus loin en classifiant les bulles en deux populations, une d´esordonn´ee, et une ordonn´ee, qui conserve l’ordre cristallin hexagonal initial. La transition vers le d´esordre peut ainsi ˆetre vue comme la succession de deux processus: (i) nucl´eation-croissance de zones de d´esordre qui envahissent progressivement la mousse, (ii) ´ evo-lution homog`ene vers l’autosimilarit´e. Un mod`ele est enfin d´evelopp´e pour rendre compte de la vitesse d’invasion du d´esordre. Ces deux approches fournissent de pr´ecieuses informations utiles `a la conception de mousse particulaires, tant au niveau d’une bulle qu’`a l’´echelle macroscopique de la mousse.
Abstract
A foam consists in a collection of gas bubbles, embedded in a continuous matrix. Their uses are numerous and they are ubiquitous in various industrial domains. In food products, ice-creams incorporate up to 30% of air bubbles, which gives the product an aerated, smooth, creamy texture. In cosmetics, foaming a product changes its rheology, thickening it for a better feel on the skin. It also increases the apparent volume, limiting waste. In construction, a foamed material offers superior heat and acoustic insulation, while being lightweight and cheap. However, the bubbles composing the foam are dynamic objects that cannot exist in an equilibrium state. They either grow and rise or shrink and disappear, but they cannot stay stationnary. This is at the origin of a coarsening process in which the gas of small bubbles diffuses to larger ones. Called Ostwald ripening (OR), it partly explains the relatively short life expectancy of foams. In the first part of this thesis, new insigth is gained on the fundamental physical processes at the origin of the stabilisation of foams by solid particles, a method that has been proved to block OR. We reduce the problem of foam stability to the study of the behavior of one single spherical bubble coated with a monolayer of particles. The behavior of this armored bubble is monitored while the ambient pressure around it is varied, in order to simulate the dissolution stress resulting from the surrounding foam. We find that the colloidal shell is able to block the dissolution up to a critical stress after which it buckles. This collapse is triggered by local dislocations and leads to the complete dissolution of the bubble. The critical value of the ambient pressure that leads to the failure depends on the bubble radius, with a scaling of ∆Pcollapse ∝ R−1, but does not depend on the particle diameter. These results disagree with
the elastic models generally used to describe particle-covered interfaces. Instead, the experimental measurements are accounted for by an original theoretical description that equilibrates the energy gained from the gas dissolution with the capillary energy cost of displacing the individual particles. The model recovers the short-wavelength instability, the scaling of ∆Pcollapse, and the insensitivity
to particle diameter. Finally, we use this new microscopic understanding to predict the aging of particle-stabilised foams, by applying a classical OR model. We find that the smallest armored bubbles should fail, as the dissolution stress on these bubbles increases more rapidly than the armor strength. Both the experimental and theoretical results can readily be generalized to more complex particle interactions and shell structures. In the second part of the work, we take a step back and observe the destabilisation through OR of a monodisperse foam, stabilized only with surfactant. This model foam consists in a monolayer of bubbles, arranged in a 2D hexagonal lattice, in a microfluidic chamber. The setup allows for the individual localisation and radius measurement of all the ≈ 30’000 bubbles of the foam. The initially monodisperse foam undergoes a transition and destabilizes toward a polydisperse self-similar state, as predicted by standard theory. Our setup allows a more detailed description of the transition, by classifying the bubbles into a disordered population and an ordered one, retaining the initial crystalline hexagonal order. We break down the global foam transition into two successive processes. First, disorder regions randomly nucleate and grow, progressively invading the foam, then the disorder homogeneously increases until the self-similar regime is reached. We also develop a model to describe the growth rate of disorder. These two complementary approaches yield valuable informations, useful for the engineering of stable foams, both at the microscale of a single bubble, and at the macroscale of the foam.
Remerciements
Au d´ebut de la r´ealisation de ce doctorat, en septembre 2012, j’avais dans l’id´ee qu’un travail de th`ese devait se commencer sans en connaˆıtre la fin `a l’avance. Je remercie donc en premier lieu Charles, pour m’avoir guid´e et form´e tout au long de ce chemin de recherche, qui a finalement abouti au pr´esent manuscrit, dont nous n’avions effectivement pas pr´evu le contenu `a l’´epoque.
Je remercie ensuite Caroline, qui m’a appris toutes les bases des techniques exp´ eri-mentales dont je me suis servie ces trois derni`eres ann´ees, et qui n’a pas cess´e de m’aider pour nombre d’exp´eriences.
Je remercie ´egalement Etienne et R´emi, qui m’ont accueilli au labo et montr´e nombres de ficelles microfluidiques, et m’ont plus tard permis de d´ecouvrir les coulisses de la naissance d’une startup de biotechnologie, avec Cl´ement, Magali et Barbara.
Je remercie ensuite tous les membres de l’´equipe (r´ecemment rebaptis´ee PµB): Gabriel, Rapha¨el, Cyprien, S´ebastien, Micaela, Morgane et Irma, pour la stimulation et la mo-tivation qu’ils m’ont apport´e, par leur bonne humeur mais aussi par les excellentes discussions scientifiques.
Je n’oublie pas non plus les stagiaires qui m’ont accompagn´e quelques temps, avec qui j’ai eu plaisir `a travailler: Jean-Phillipe, Loris et Elie.
Je remercie aussi tous ceux sans qui l’activit´e du LadHyX ne serait pas possible, et qui m’ont tous aid´e au quotidien: Sandrine, Th´er`ese, Delphine, Magali, Dany, Toa¨ı et Antoine.
Je remercie ´egalement ceux avec qui j’ai eu la chance de collaborer : Deniz Gunes, qui a apport´e le point de vue industriel de Nestl´e et a su voir l’interˆet potentiel de ces petites bulles armur´ees ; Benjamin Dollet, pour ses connaissances in´epuisables sur la complexe physique des mousses ; et Fran¸cois Lequeux, pour son aide pr´ecieuse sur la mod´elisation de ce que nous avons observ´e. Et bien entendu, je remercie mon Jury de th`ese, pour avoir accept´e d’´evaluer mon travail, et pour la discussion anim´ee qui a suivi ma soutenance.
Je remercie enfin tous les membres du LadHyX pour l’ambiance inimitable de con-vivialit´e et d’´emulation scientifque qui y r`egne, et qui ont rendu cette p´eriode de th`ese agr´eable. J’ajoute une mention sp´eciale `a Avin et Julien, qui ont toujours su m’aider et m’orienter, et avec qui il ´etait toujours sympathique de discuter. J’ajoute une deuxi`eme
mention sp´eciale `a Ga´etan, Timoth´ee, Manu, Camille et Romain, pour les projets que l’on qualifiera “d’annexes” au travail de recherche `a proprement parler, tels que l’escalade, la course en forˆet, et les usinages et bricolages en tous genres.
J’ai ´egalement une pens´ee pour tous mes amis qui ont eu la chance de r´ediger leur th`ese en mˆeme temps que moi, et avec qui il ´etait facile d’en discuter les d´eboires. Je pense en particulier au groupe 14 ; `a L´eopold et Hugo, qui m’ont accueilli dans leurs labos parisiens les derniers week-end o`u l’X semblait beaucoup trop loin ; mais aussi `a Eunok, Matthieu et Chakri, avec qui nous avons fortement ralenti l’activit´e du LadHyX en soutenant tous les quatre la mˆeme semaine.
Finalement, je remercie mes parents et mon fr`ere, pour m’avoir soutenu pendant ces trois ann´ees, et surtout de s’ˆetre int´eress´e `a ce sur quoi je travaillais, ainsi que pour l’intendance du pot de th`ese.
Enfin, je remercie Celia, pour le relecture attentive de ce manuscrit, et pour sa pr´esence pendant ces ann´ees de th`ese.
Contents
Introduction 1
I Mechanical strength of an armored bubble 7
1 Context 9
1.1 Trapping of a solid particle on an interface. . . 9
1.2 What is the elasticity of particle coated interfaces ?. . . 11
1.3 Adsorption of particles on gas-in-liquid bubbles.. . . 12
1.4 Particle stabilized foams . . . 13
1.5 Open questions and contribution of this thesis. . . 16
1.6 Outline of Part I . . . 16
2 Materials and Methods 17 2.1 Fabrication of the microfluidic chip . . . 17
2.1.1 Conventional soft lithography . . . 17
2.1.2 Micromachining of a mold . . . 18
2.1.3 Surface state of the channel . . . 21
2.2 Production of a single air bubble by gradient of confinement . . . 22
2.3 Particles . . . 24
2.3.1 Colloidal beads used . . . 24
2.3.2 Fabrication of ellipsoidal particles . . . 24
2.4 Imaging and control . . . 25
3 Experiments with armored bubbles 27 3.1 Producing and monitoring an armored bubble in microfluidics . . . 27
3.1.1 Covering the air bubble . . . 29
3.1.2 Trapping and monitoring the bubble . . . 33
3.2 Measurement of armor resistance . . . 35
3.2.1 Progression of a typical experiment. . . 36
3.2.2 Buckling of the armor . . . 37
3.2.3 Mechanical strength characterization of armors . . . 38
3.2.4 Onset of buckling. . . 40
3.2.5 Bubble inflation and cracks opening . . . 43
3.3 Armor with ellipsoidal colloids . . . 44
3.4 Effect of surfactant on armor strength . . . 45
3.4.1 Effect of surfactant on the failure mode of the shell . . . 45
3.4.2 Effect of SDS concentration . . . 46
3.4.3 Possible interpretation . . . 46
4 Interpretation of the behavior of colloidal armors 51 4.1 Control of the bubble dissolution . . . 52
4.1.1 Gibbs theory of bubble nucleation . . . 52
4.1.2 Calculation of Req . . . 53
4.1.3 Expression of the free energy of the dissolving bubble . . . 55
4.2 Comparison to models of elastic shell . . . 57
4.3 Modeling the armor behavior . . . 58
4.3.1 Dissolution energy . . . 58
4.3.2 Shell deformation energy . . . 59
4.4 Synthesis and model final prediction . . . 62
4.5 Prediction of the behavior of the armor within a foam . . . 64
4.5.1 Lemlich model . . . 64
4.5.2 Comparison with armor strength . . . 66
5 Outlooks 71 5.1 Connection to other studies . . . 71
5.2 Perspectives . . . 75
5.2.1 Explore more complex shells . . . 75
5.2.2 Deepen the understanding of the coverage . . . 76
5.3 Conclusion . . . 77
II Emergence of disorder in a monodisperse foam 79
7 Setup and experimental procedure 85
7.1 Microfluidic device . . . 85
7.2 Experimental procedure . . . 87
7.3 Image analysis . . . 88
8 Nucleation and growth of disorder 91 8.1 Aging of a monodisperse foam. . . 92
8.2 Long-time regime . . . 93
8.3 Order-disorder transition. . . 94
8.4 Classification in 2 sub-populations . . . 95
8.5 Characterisation of the bubbles subsets . . . 97
8.6 Model of the disorder invasion. . . 103
8.6.1 Constant invasion rate . . . 103
8.6.2 Variable invasion rate . . . 104
8.7 Conclusion . . . 109
9 Future work 111 9.1 Single bubble tracking . . . 111
9.2 Induced defect . . . 113
9.3 Grain boundary. . . 113
9.4 Further experiments . . . 114
General conclusion 119
Introduction
In January 2013, the city of Caloundra, on the Sunshine Coast near Brisbane in Australia, was submerged by a flood of sea foam that completely filled the streets (figure1). The city was paralyzed by this unusual phenomenon for several days. The origin of this huge amount of froth is unclear, but it was the consequence of the conjunction of strong winds, and the presence in the sea water of certain types of plankton, that produced a particularly stable and abundant foam.
Figure 1: The streets of Caloundra under several meters of sea foam. Source: ITN News
Nevertheless, foams do not usually cause so much problems, but rather have a lot of interesting properties that are exploited in various applications. For instance, one of the most common places where to find foams is in the bathroom. A foamy soap or shampoo provides confort and pleasure to the user, but it also increases the surface of skin that can be covered with a given amount of product. This covering capability is linked to the rheological properties of foams: they are yield stress fluids that can stay on a surface unless submitted to a shear stress [1], as for instance in the case of shaving foam on the cheeks, before it is swept away by the razor’s blade. This property is put to good use in other domains, such as chemical or radioactive decontamination. Once foamed, the decontamination solution can efficiently coat the surfaces to treat, and act
for a longer time. Finally, the thermal insulation qualities of foams can be combined with their rheology when used as firefighting foams. Indeed, a foamed fire extinguishing agent has a double effect: by coating the fuel, the foam insulates it from the heat source and cuts the fire’s oxygen supply (see figure 2).
Figure 2: A fire extinguishing foam used on a burning hydrocarbon tank. Foams are particularly useful in that case since they cover the liquid fuel, rather than sinking into it, as water would do. Photo: Mattias Georgsson.
A lot of foams are also edible. These food foams are often associated with beverages such as cider, beer or soda. The dissolved CO2 they contain nucleates into bubbles as
the pressure drops when the container is opened. The bubbles rise and form a foam at the top of the glass, which is a part of the consumer’s experience. But a variety of other products are also aerated [2], because the presence of air bubbles in a culinary preparation brings a sensation of lightness and onctuosity. This is especially true in ice-creams, where the size and the repartition of air bubbles in the frozen mix determines the texture of the ice-cream [3]. Furthermore, foamed food presents advantages not only for the consumer, but also for the producer, who can control the cost of a given volume of product: the air introduced in the preparation is free (however, the process to introduce the bubbles in the preparation is not).
Foams can also be found in the walls of buildings. Indeed introducing air bubbles in construction materials such as concrete is a process that has been known for a long time [4]. As for food products, introducing air bubbles within concrete or cement lower the production cost, but it also greatly reduces the density of the material, to such a
point that it is possible to make concrete float (see figure3(b)). Moreover, the presence of air in the material strongly reduces its thermal conductivity, in comparison with that of conventionnal concrete. This enhanced thermal insulation is one of the main selling points for cellular concrete (see figure3(a)). Research on this type of material is still a topical subject, in order to achieve controlled structures and bubble sizes [5].
Figure 3: (a) 1950 advertisement for the Thermo-Con cellular concrete [4]. It demon-strates the thermal insulation capability of foamed concrete: a person can press his cheek (without apparent burn) against a slab of concrete, the other side of which being heated with a blow-torch. (b) Floating concrete island (AB Concrete Design)
Finally, exotic materials can be obtained by introducing gas bubbles into molten aluminium. Once the metal solidifies, one obtains a porous structure similar to that of a sponge [6]. This material is very lightweight, and has very good shock absorption capabilities, similarly to the polystyrene foam used in bike helmets. The energy of the projectile is very efficiently dissipated in the metallic foam, because of its highly tortuous structure. These materials are very promising for aerospace applications (see figure4).
Figure 4: An aluminium foam sandwiched between two steel panels. This structure is manufactured by Fraunhofer and Studiengesellschaft Stahlanwendungen.
a major issue, since it determines the ability to control the material properties and their evolution in time. Foams suffer from three major aging processes [7] that alter their structure over time.
Firstly, foams are dispersions of gas bubbles in liquids. In pure water for example, when two gas bubbles come into contact, they merge together to reduce their total interfacial energy. This is known as coalescence, and it is the first destabilisation process of a foam. It can be easily prevented by dissolving surfactant molecules in the liquid. These molecules are amphiphilic, which means they are composed of a molecular head that is hydrophilic, attached to a molecular chain, the tail, that is hydrophobic. In consequence, these molecules adsorb on the air-water interface to satisfy their ambivalent nature. Bubbles whose interfaces are coated with surfactant cannot coalesce because the polar heads of the surfactant at their surfaces repulse each other. This repulsion can be steric or electrostatic, and its magnitude defines the stabilizing power of the surfactant. The second aging process of a foam is drainage. It is due to the density contrast between the gas and the liquid. By buoyancy, the bubbles tend to rise and the liquid tends to flow toward the bottom of the foam. The liquid films separating the bubbles near the top of the foam are thus progressively depleted and may rupture if they become too thin. This can be prevented by using surfactant whose heads show a strong enough repulsion to stop the film thinning, or by increasing the viscosity of the fluid to slow down the drainage.
Finally, gas can be transferred by diffusion from, small bubbles to larger ones. This transfer is due to the Laplace pressure difference existing between bubbles of different sizes. In consequence, small bubbles, where pressure is higher, become smaller and large bubbles, where pressure is lower, become larger. This phenomenon leads to the coars-ening and destabilization of the foam. This last process is known as Ostwald ripcoars-ening. It is the slowest of the three aging processes, because it is driven by diffusion, but also the most difficult to counteract. Indeed, gas diffuses through the surfactant layer, and cannot be stopped.
Solid foams are of course not affected by these problems, since their continuous matrix is rigid. However, most of the time, solid foams are created by solidification of a liquid foam. That is why, even if the final material is a solid foam, it is important to control the foam aging.
In this thesis, we are more particularly interested in Ostwald ripening. We will tackle this issue in two ways: firstly, by shedding light on a well known, but still not completely understood, method to block Ostwald ripening, and secondly by unraveling the complex gas exchanges that take place between bubbles during the ripening of a foam.
that coating the bubbles constituting a foam with an armor of solid particles is a very efficient way to block Ostwald ripening [8,9]. The particles armor provides some rigidity to the interface, which blocks the shrinkage of the bubbles. However, the mechanical properties of these colloidal-armor remain mysterious, since it is difficult to observe and probe such tiny (typically 100 µm ) objects precisely. I will demonstrate an experimental microfluidic setup that enables both the production of a single armored bubble, and its trapping in a controlled environment, for an extended monitoring of its behavior. The quantitative measurements obtained show the unusual mechanical properties of armored bubbles, that are accounted for by a model that we develop.
In the second part, I will take a step back and present a detailed analysis of the first instants of the coarsening of a monodisperse foam. Indeed, the long time regime of Ostwald ripening are well described in the litterature [10,11]. In particular, the evolution of the bubbles size distribution is well known. However, the transient regime that leads to this final state when the initial state is monodisperse (ie. all the bubbles have the same size) is less understood. I will show that the transition is characterized by a nucleation-growth process of disordered zones, in the initially very ordered foam. The nucleation-growth speed is measured, and described by a theoretical model, which gives a complete view of the evolution of the structure of the foam during the initiation of Ostwald ripening.
Part I
Mechanical strength of an
armored bubble
1
Context
In this chapter, we present the background knowledge on systems involving solid particles and fluid interfaces separating two phases (gas or liquid). Firstly, the mechanism of particle adsorption on an interface is explained. Secondly we focus on the state-of-the art in term of characterization of planar interfaces coated with those adsorbed particles. Secondly, we present the work done on armored bubbles, as well as the questions that remain open. Finally, we turn our attention to the ability of adsorbed particles to stabilize liquid foams.
1.1
Trapping of a solid particle on an interface
The first quantitative analysis of colloidal particles adsorbed on a fluid interface was reported by P. Pieranski, in an article from 1980 [12]. Motivated by the recent progress made in two-dimensionnal phase transition, the aim of the study was to find an experi-mental system in which the crystalline order of particles, arranged in a 2D lattice, could be directly observed. The idea was to trap a collection of microscopic particles ( 246 nm) at a flat air-water interface. The arrangement of the colloids was thus constrained in a 2D plane. The author showed for the first time that the adsorbing energy of a microscopic bead on a fluid interface was orders of magnitudes higher than the thermal
agitation, which justified the use of the term ’trap’. More precisely, he calculated the surface energy Eγ of a partially wetted particle, piercing the interface, as a function of
the depth of penetration z of the particle:
Eγ = πaz(γsv− γsl− γlv) + πz2γlv, (1.1)
where γsv,γsland γlv are the surface energies respectively of the solid-vapor, solid-liquid
and liquid-vapor interfaces, and a is the radius of the particle.
Figure 1.1: Energy profile of a bead adsorbed on a fluid interface, as a function of its depth of penetration z.
This energy is plotted in figure1.1. It has a parabolic shape, with a minimum for a certain depth of penetration. This equilibrium position corresponds to the case when the interface intersects the solid sphere with the solid-liquid Young-Dupr´e contact angle θ. The order of magnitude of the energy required to pull the particle out of the energy well is (1−cos θ)2γa2. In the most favorable case of θ = 90o, and for a 1 µm particle adsorbed on an air water interface, the desorbtion energy is ≈ 7−14 J, which is 107 higher than the thermal energy kT at 25oC. This proves that the particles are irreversibly adsorbed on the interface, so that they can only move in-plane.
This strong attachement of partially wetting particles on the interface is at the origin of all the work on particle covered interfaces. When the interface becomes too crowded with particles, and since they cannot desorb from the interface, the nature of the interface changes. Due to the solide nature of the particles, a particle-laden interface under compression cannot freely decrease its surface area anymore, although it must comply with the externally imposed deformation. The way it does so has been the starting question of several studies, the first one being:
1.2
What is the elasticity of particle coated interfaces ?
One way to measure the properties of these interfaces is to use a Langmuir trough, a conventionnal method to measure the interfacial elasticity properties of surfactants. It consists of a tank filled with liquid, one boundary of which is mobile. The interfacial area can thus be modified, compressing the layer of grain adsorbed on the interface. The first reported experiment with particles was done by Sheppard et al. in 1967 [13], but three decades passed until other groups started to recently tackle this problem again [14,15,16]. These studies describe the buckling of a layer of particles sprinkled on a water surface. The experimental setup is sketched in figure1.2(a). As the layer is compressed, the particles are progressively more and more packed, and they finaly jam at some point. If the layer is further compressed beyond jamming, it undergoes a buckling transition, wrinkles and undulations appear, as shown on figure 1.2. This layer morphology can be found both in the case of air-water interface [15] and oil-water interface [14], and for particles of various sizes.
Figure 1.2: (a) Scheme of the Langmuir trough experiment with a monolayer of adsorbed grains. (b) Polystyrene particles with mean diameter 300µm and (c) lycopodium parti-cles with mean diameter 30 µm on an air water interface. Scale bars are 5mm. Adapted from [15]. (d-f ) Increasing compression of a layer of polystyrene particles with mean diameter 2.6 µm , at an octane/water interface. Scale bars are 100 µm . Adapted from [14].
These experiments reveal the solid-like nature of particle-laden interfaces. The anal-ysis carried out by Vella et al. [15] uses an elastic analogy to link the wavelength of the
buckling patterns to an equivalent elastic modulus of the composite material realised by the capillary trapped beads. This apparent young modulus Eγ scales like γ/a, a being
the radius of the particles, an expression which fits well their experimental data. How-ever, a crucial assumption of the model is that the weight of the liquid underneath the granular layer provides the restoring force that prevents it form deforming. The elastic-ity of the material thus arises from gravelastic-ity, which render this model unable to describe a gravity-free case. For instance bubbles encountered in usual foams are typically much smaller than the capillary length. They are thus spherical and the effects of gravity are negligible at the scale of a single bubble.
1.3
Adsorption of particles on gas-in-liquid bubbles.
The first observation of a particle-stabilized air-in-water bubble is attributed to Walter Ramsden in 1903 [17]. He describes the crystallisation of certain proteins and organic molecules at an air-water interface. The interface of the bubble is thus covered either with a rather continuous film as in the case of albumin, or a granular layer, as in the case of saponin (a class of surfactant molecule found in certain plants). In both cases, he describes both the solid like properties and elastic nature of the covered interface:
Bubbles of solution of egg-albumin, caseinogen and saponin exhibit remark-able phenomena, which show that the bubble-film as a whole is very imper-fectly elastic and is covered with solid membranes. Egg-albumin are deformed on collapse by the formation of persistent folds of solid proteid in the bubble-film. Bubbles of pure saponin solution, containing 0.01 per cent. or more of saponin, fall on collapse into innumerable shimmering folds containing isolated curved rods of solid saponin, [...]. The collapsing bubble assumes extraordinary shapes, with sharp angles [...]. Walter Ramsden, 1903 [17]
The author already noticed the wrinkling of the coated interface in the case of a granular coating of solid saponin particles. This wrinkling and folding gives rise to unusual bubble shapes, a photography of which is unfortunately not available in the original paper.
Recently, there has been a regain of interest for these objects, thanks in part to the rise of new experimental techniques. Indeed, a method of choice for the study of these kind of small objects is to use microfluidic techniques. Subramaniam et al. [18] designed an elegant microfluidic chip on which a flow-focusing geometry used at high flowrate give the particles a sufficient speed to force their adsorbtion on the air-water interface. The interface is thus progressively coated, and an armored bubble periodically detaches from the air thread when enough particles packed at the tip of the thread (see figure 1.3).
Another approach was used by Park et al. [19], who took advantage of a chemi-cal modification of the particles surface. They used particles made of a copolymer of polystyrene and polyacrylic acid. The later carries carboxylic acid groups which take an ionic carboxylate form at high pH, and a neutral carboxylic acid form at high pH. The principle of the armor assembly is thus to disperse the particle in a basic solution, to ensure a good dispersion of the particles while their surface is charged by the carboxy-late groups. Pure CO2 bubbles are then injected via a T-junction in the microchannel.
This gas is very soluble in water, and its dissolution rapidly decreases the pH of the solution in the proximity of the bubble. Consequently, the carboxylate groups are proto-nated and lose their ionic character, which renders the beads surface more hydrophobic, promoting their adsorbtion at the gas-liquid interface. This method enables the serial production of monodisperse armored bubbles, but is limited to certain combinations of gas and particles chemistry.
Subramaniam et al. used their microfluidic production device to investigate the prop-erties of armored bubbles in another article [20]. Notably, they showed that a stress applied on the shell can induce a plastic rearrangement of the beads, so that the bubble takes and maintain a non spherical shape.
The capacity of armors to block the dissolution of the gas inside the bubble was studied by Abkarian et al. , experimentally and numerically [21]. The authors observed the dissolution of armored bubbles submersed in degased water. While bare bubbles rapidly dissolve, the dissolution of armored ones is blocked, and the colloidal shell deforms under the subsequent ’dissolution pressure’ (this term is explained in detail in the next chapter). The wrinkled shapes observed by Ramsden appear when the particles are significantly smaller than the bubble, while a faceting of the armor is observed when a/R ≈ 0.1, R being the radius of the bubble (see figure1.4).
Other groups have investigated the mechanical properties of spherical particle-laden interfaces, but in the case of liquid droplets, as surrogates for gas bubbles [22,16, 23,
24,25].
1.4
Particle stabilized foams
The ability of the colloidal shell to arrest gas dissolution is at the origin of the outstanding stablility of particle-stabilized foams. The gas dissolves until the particles jam, prevent-ing the bubble within the foam from decreasprevent-ing their volume, thus blockprevent-ing Ostwald ripening.
Substituting the usual surfactant with solid particles thus increases the lifetime of foams, which have lead numerous groups to study these systems [26,27,28,29,30,31].
Figure 1.3: (a) Armored bubble in formation at the flow focusing junction. An air thread is pushed in the middle (dashed arrow) and is pinched by a flow of colloidal dispersion in the lateral channels (solid arrows). (b) When the tip of the thread is sufficiently loaded with particles, it detaches and form an armored bubble. (c) Skecth of the trajectories of the particles from the bulk liquid to the interface. (d-g) Armored bubble being squeezed between to glass slides. It deforms from a prolate ellipsoid shape to an oblate shape through a plastic rearrangement of the beads. Scale bars are 200 µm . Adapted from [18].
These studies demonstrated that the aeration of dispersions of suitable particles lead to the formation of foams, with a shelf life of several weeks or even months. As shown above, the depth of the energy well in which an interfacially adsorbed particle is trapped, depends on the contact angle of the liquid on the solid particle, and is maximum at 90o. Therefore, the particles must be wisely chosen, with a contact angle not too far from 90o, to ensure a sufficiently strong adsorbtion.
Figure1.5shows a picture of such a foam, stabilized solely with hydrophobised silica nanoparticles. Indeed, native silica is too hydrophilic to adsorb on an air-water inter-face. It is necessary to chemically graft hydrophobic groups on its surface, to enhance adsorbtion. The sample exhibits the visual characteristics of a foam: the bubbles diffuse the incoming light, giving it its white color, and the sample can hold its pyramidal shape under gravity, a signature of the existence of a yield-stress, characteristic of liquid foams [1].
Figure 1.4: (a) Wrinkled shell blocking the dissolution of the gas. (b-c) Faceted armored bubbles. Scale bars are 8 µm . (d) Results of Surface Evolver simultations of armored bubbles. As its internal volume is deflated, it takes a faceted shape. Adapted from [21].
1.5
Open questions and contribution of this thesis
Systems involving interfacially adsorbed particles have been studied for a long time, at a variety of scales, from a single particle to the complete architecture of a foam. While the mechanics of adsorption and stabilisation has been investigated [8], there is still a lack of understanding in the origin of the stability of armored bubbles.
In particular, all of the above studies on armored bubbles only lead to qualitative description of their behavior, and lack quantitative measurements of their mechanical properties. For instance, the concentration of dissolved gas in the degased water in [21] is not controlled, so that it is impossible to know to what extent the armor is able to block the dissolution. More quantitative measurements have been done on droplets, but they might not be relevant for the case of gas bubbles and foams, since a gas is much more soluble in water than another liquid imiscible phase, such as oil. Furhtermore, the description as a planar elastic sheet might not be sufficient to account for the behavior of spherical armored bubbles, due to the predominant role of gravity forces in the elastic behavior of the granular layer in the planar case. Finally, there is no obvious link between the ability of a given colloidal shell to stabilize a bubble, and the stability of this same bubble within a real foam.
I will present in this manuscript experiments giving access to precise quantitative measurements on individual armored bubbles, and I will build a more adapted model to account for their behavior.
1.6
Outline of Part I
In the next chapter, we investigate the fate of a colloid-armored bubble as its environ-mental conditions are varied. Thanks to recently developped microfluidic tools [32,33], that rely on channels with non-parallel floor and ceiling, a single bubble is produced into a quiescent fluid, and held stationary for observation. We first show an efficient way of adsorbing colloidal beads at the air-water interface of the bubble to produce the armor. Then we describe a method to precisely control the dissolution of the bubble and the resulting compressive stress applied on the armor. This enables us to quantitatively measure the maximum dissolution stress that an armor can withstand, while observing its behavior. A theoretical model of the shell mechanics is then developped to account for the experimental observations. Finally, we show the implications of the mechanical stability of a single armored bubble for a large population of such objects, that is to say a particle-stabilized foam.
2
Materials and Methods
2.1
Fabrication of the microfluidic chip
2.1.1 Conventional soft lithography
Conventionnal microfabrication techniques commonly used in microfluidics rely on the fabrication of a master mold, of which a replica is made, using a suitable material. The most widely used material for this purpose is a silicone elastomer, the polydimethyl-siloxane (PDMS). The one we use is manufactured by Dow Corning under the trade name Sylgard 184 and consists in two parts: a base of PDMS linear chains terminated by reactive groups, and a heat-activated curing agent that binds the chains together to form a 3D reticulated network. It has excellent replications capabilities, and its use is as simple as pouring it over the master mold, and baking it between 70oC and 150oC, for 15 min to 2h. The negative replica of the mold constitutes the first half of the microchip, in which entry holes are punched, and which is then bonded to a glass slide after a 35 s air-plasma treatment. This process has been known for a long time and is extremely convenient for fast prototyping design at the laboratory scale [34].
This is the replication method that we use here, but the fabrication of the master mold differs from what is commonly done. The simplest method to obtain a micron-sized imprint of a microchannel (ie: a mold) is to use optical lithography. In this method, a
layer of photosensitive material is deposited on a flat substrat, and is illuminated with UV light through a mask, whose transparent areas have the geometry of the desired channel. The process can be repeated through a second mask after deposition of a new layer of photosensitive material to obtain 3D shapes. The unexposed material is then dissolved using the appropriate chemical, which directly yields the mold. The main drawback of this technique is that the layer by layer deposition of resin leads more to a stack of 2D designs, rather than to a true 3D shape. For example, it is impossible using this method to obtain a smooth slope of continuously increasing thickness, which is what is needed in the design of our micro channels.
2.1.2 Micromachining of a mold
We circumvent this issue by taking advantage of micromachining methods that allow the fabrication of molds with more complex geometries. A block of metal is micromilled using a CNC machine (Minitech) with high precision in its three translationnal degrees of freedom (1 µm ). The geometry of the mold is drawn using a 3D software (Rhinoceros) and the tool path used by the micromilling machine is computed by a computer assisted machining plugin (RhinoCAM).
A few rules must essentially be followed to obtain a mold with a geometry as close to the initial design as possible.
Feeding speed and spindle rotation The principle of milling is to feed the part to machine against a rotating tool. The sharp teeth of the tool cut the metal and remove small bits of material called chips. The geometry of the tool defines the geometry of the cut part. We use end mill tools, that cut grooves of rectangular sections with sharp right angles, as shown in figure 2.1(a).
The advance per tooth fz is the distance covered by the tool during 1/z rotation
of the tool, z being the number of teeth on the tool. As depicted in figure 2.1(b), this distance defines the thickness of the chip of metal that is cut by one tooth. Thus, fz
must be set to the nominal values required by the tool manufacturer. Indeed, if the chip is thicker than the nominal value, the stress on the material and on the tool becomes too large, which might either break the tool, or reduce the precision of the cut. On the other hand, if the chip is thinner, the tooth will rather scratch than cut the metal, which leads to a poor surface state.
The advance per tooth is set by a combination of two machining parameters, tunable by the user. The first parameter is n, the rotation speed of the spindle holding the tool, in rotations per minute (rpm). The setup we use has a maximum rotation speed of 60’000 rpm. The second parameter is the feeding speed Vf, which is the speed at which
Figure 2.1: (a) Picture and drawing of a 3 mm end mill tool with 2 teeth. The drawing on the right shows the operation of the tool and the section of the groove created. Adapted from Magafor documentation. (b) Sketch showing the chip in red. It is defined by the area cut by the incoming tooth as the part is fed against the tool, from top to bottom (Vf). The light gray area is the region already machined, while the darker gray
represents the region to be machined, thicker.
the table on which the part is fixed moves. Its maximum value is 1800 m/min. The relationship from the definition of fz is
fz=
Vf
zn(in mm) (2.1)
For each tool diameter, a value of fz is prescribed by the tool’s manufacturer. Thus,
for the largest tool, the limiting parameter is the maximum feeding speed, and for the smallest tools, the limiting factor is the maximum rotation speed. The following table sums up the optimal parameters for commonly used tools, which all have z = 2 teeth.
Tool (mm) fz (mm) Vf (m/min) n (rpm)
3 0.05 1800 18’000
1 0.02 1800 45’000
0.15 0.003 360 60’000 0.05 0.001 120 60’000
It appears that small tools work much slower than larger ones, that is why it is optimal to reduce their use as much as possible to avoid excessive machining times.
Materials The easiest metals to machine are aluminium, and brass, which is an alloy of copper and zinc. We chose brass because of its ease of machining and because it
is is harder than aluminium, which allows for thinner mold structure without risk of deformation. During the machining process, cutting oil is sprayed on the part to ensure a good lubrication and avoid tool overheating.
Machining strategy The typical machining process is skectched in figure2.2. Metal must be removed from the stock part (ie: the raw metal piece) to expose the desired part geometry. The first step consists in successive passes of large depth (10% of the tool diameter) to quickly remove a thick layer of metal. This leaves a rough shape of the desired part with an excess of metal of ≈ 10 µm . The slopped areas are roughed by step machining, with tool path parallel to the slope, which leaves a stair shape just above the desired slope line. The roughing step enables the quick removal of a thick layer of metal but it leads to a flawed part. Firstly, the surface state is rather bad, and the roughness is not acceptable for use as a microfluidic mold. Indeed, deeper passes cut thicker metal chips, which is the source of higher cutting stresses in the material, and explains the rough surface state obtained. Secondly, at the edges of the machined patterns, residual metal can build up and form burrs (see figure 2.2(b)). The part is cleaned by a finishing step with low depth passes (1% of the tool diameter) that removes very thin layers of material at once. This kind of machining yields a smoother surface, with a root mean square roughness < 100 nm. The profile of the slope area is refined by cutting lines parallel to the slope and typically 3 µm appart. The result is a succession of very thin steps, extremely close to a continuous slope.
Figure 2.2: Micromilling steps. (a) Initial stock part with the desired geometry high-lighted in yellow. (b) Roughed part. (c) Finished part.
This last finishing step can be repeated with multiple tools of different diameters, depending on the size of the patterns on the mold. Indeed, the minimum radius of curvature reachable for an internal angle is equal to the radius of the tool used. Smaller feature such as narrow channels and injectors require the use of a smaller tool diameter. Typically in our case, the roughing step and large areas machining is done using a 3 mm end mill (see figure 2.1(a)), then a 1 mm tool is used for a first refinement, and finally a 0.15 mm or 0.25 mm tool for the smallest features. Smaller tools enable a
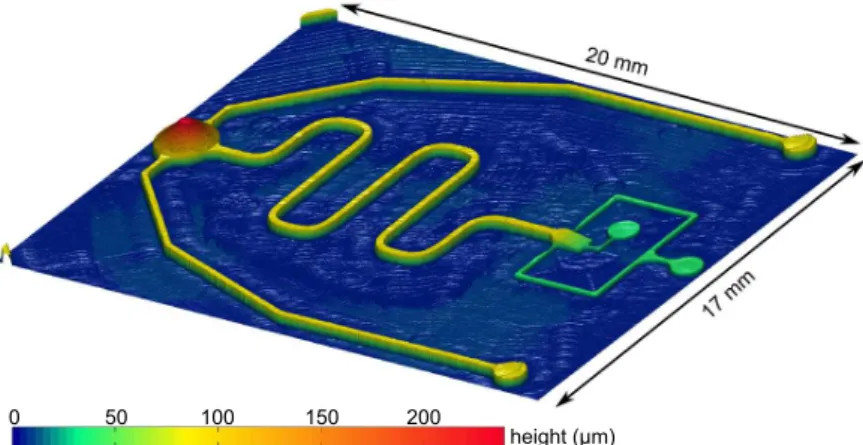
Figure 2.3: 3D profile of the mold. The heigth of the central channel is 80µm and its width is 300µm . The slope of the bubble injector is 4%.
higher precision for the replication of small features, but it is at the expense of longer machining time as explained above. Furthermore, smaller tool are more likely to break and are more expensive than larger ones.
Final geometry
The part is analyzed using an optical profilometer (Zygo), as shown on figure2.3. Mul-tiple acquisitions are stitched together to obtain a complete 3D profile of the brass mold.
2.1.3 Surface state of the channel
The working principle of the wedged injector relies on the hypothesis of total wetting of the outer phase on the channel’s wall (see section2.2). This is particularly difficult to achieve in our case, since the experiments must be performed without any trace af surfactant in solution, which would hinder the adsorbtion of particles on the interface (as shown in section3.4). The most commonly used method to render the glass and PDMS inside the channel hydrophilic is to use plasma treatment, which is already a part of the fabrication process. After curing the PDMS, the channel is closed with a flat glass slide, which is covalently bonded to the PDMS after a 35 s air-plasma treatment. The contact with plasma strongly oxidizes the glass and PDMS, which creates hydroxyle surface groups (-OH), whose presence renders the surface very hydrophilic. This hydrophilicity is preserved if the channel is filled with distilled water just after the plasma treatment.
However, the PDMS has a tendency to recover its native hydrophobicity over time, which is characterized by a contact angle value of ≈ 110o. This is due to the mobility
of the low molecular weight (LMW) unreacted polymer chains that remain in the bulk material after curing [35]. These chains slowly migrate from the bulk to the surface of the PDMS, where they react with the hydrophilic (-OH) groups, canceling the hydrophiliciy. A method to limit this phenomenon is to thermally age the PDMS after curing, to react the LMW chains and immobilize them into the bulk [36]. Therefore, the PDMS chips are cured at least 24h before being bonded to glass and stored under water to prevent drying, which preserve the hydrophilicity. This treatment is necessary since the deep vacuum inside the plasma chamber removes the dissolved gas from the PDMS. It is then necessary to let the channel reequilibrate with air atmospheric pressure for 6-12h before any bubble dissolution experiment can be performed.
2.2
Production of a single air bubble by gradient of
confinement
To produce an armored bubble, a single air in water bubble needs first to be generated. The conventionnal microfluidic methods usually deployed to produce bubbles or droplet are T-junction or flow-focusing [37,38] channel geometries. These methods have proved efficient when a high throughput production of droplets or bubbles is needed. However, the performances are poor at low flowrate, and it is difficult to use them to produce single objects. This is especially true with air, whose flowrate is difficult to control because of its large compressibility. Indeed, a plug of air inside a microfluidic chip considerably increases the hydraulic capacitance of the system [39]. In consequence, the time to establish a steady flow considerably increases, rendering the fine control of the flowrate very difficult. We circumvent this problem by taking advantage of a tool developped in the lab, that enables the production of bubbles or droplets in a quiescent fluid at very low flowrate [33]. This bubble production device is based on the curvature imbalance that arises when a thread of non-wetting liquid flows into a Hele-Shaw cell with non parallel floor and ceiling. As shown in figure 2.4, a tongue of non wetting fluid (in our case, air) first expands in a reservoir initially filled with a wetting liquid (in our case, de-ionized (DI) water). The tongue then destabilizes and detaches from the injector, forming the bubble.
Breakage mechanism Dangla et al. [33] observed that with this geometry, droplets or bubbles of definite size are produced, even at very low injection flowrate, which led them to assume a quasistatic regime, in which the fluid is at mechanical equilibrium at all times. In this situation, the Laplace’s law imposes that the mean curvature of the air-water interface should remain constant, except in the region where it is pressed
Figure 2.4: Geometry of the bubble production unit. An air thread (in blue) is pushed into a wedged chamber initially filled with water (in pink). As it is pushed, the thread of air expands into a circular flat tongue. From Dangla et al. [33]
against a wall of the channel. Yet, the geometry imposed by the channel differ in the inlet and reservoir region. The mean curvature of the surface can be decomposed into two contributions, κ⊥ and κk, respectively the curvature in the directions perpendicular
and parallel to the plane of the wedged Hele-Shaw cell.
Figure 2.5: (a) Destabilization of the tongue. At a critical value of injected volume, the thread pinches and the droplet/bubble detaches. (b) Cross section of the thread as the tongue curvature decreases (from top to bottom). From Dangla et al. [33]
As fluid is progressively injected, the curvature in the tongue decreases in two ways. First, the volume increase leads the forming droplet to increase its radius R, so that κk ∝ 1/R decreases. Second, the wedged geometry of the reservoir leads to an increase of
its thickness h, and κ⊥ ∝ 1/h decreases as well. To satisfy Laplace’s law, the curvature
in the thread must decrease in the same way. At first, there is no parallel curvature component in this region, so the only curvature is given by the corners of the interface, near the gutter of the injection channel (see figure 2.5(b,top)). As the curvature in
the tongue decreases, this curvature must also decrease up to a critical value where it equals the inverse of the half-channel thickness (figure 2.5(b,middle)). Past this point, it cannot decrease furthermore without falling into the unphysical situation described in figure 2.5(b,bottom). In order to cope with the curvature of the tongue, the threads bends inwards, adding a negative κk to the thread’s mean curvature. This correspond
to the necking event showed in figure 2.5(a,middle). Eventually, the neck size will be reduced until it destabilizes via Rayleigh-Plateau instability, thus forming the drop.
It is worth noting that the case depicted in (figure2.5(b,bottom) is unphysical given the assumption of a perfect wetting of the external phase on the walls of the channel. If this condition is relaxed, this situation corresponds to a dewetting of the external phase, or equivalently a wetting of the internal phase. If this occurs, the thread possesses a very large reservoir of curvature, the formation of the neck is greatly retarded and the droplet may never detach from the inlet. This explains why, in the present case of bubble production, a proper wetting of the external water phase on the surfaces of the microfluidic channel is crucial.
2.3
Particles
2.3.1 Colloidal beads used
The particles used for the experiments were yellow-green fluorescent polystyrene (PS) mi-crobeads, charge-stabilized by covalently bonded carboxylate groups . They were washed 3 times with distilled water by centrifugation-sonication cycles and finally redispersed in DI-water with 0.5 M sodium chloride (pH=7) to a final solid concentration of 0.5% w/w. Salty water was used in order to screen the electrostatic repulsion between the particles and the interface [8], to facilitate adsorption. In our experiments, we used three different particles diameters, 0.5, 1.1 (Fluospheres, Life Technologies) and 4.5 µm (Fluoresbrite, Polysciences).
2.3.2 Fabrication of ellipsoidal particles
In order to evalutate the effect of the particle shape on armor properties, ellipsoidal colloids are fabricated. We choose to use the particles described above and to deform them to reach the desired shape. This has the benefit of ensuring that the particles retain the same chemical properties, in particular the water contact angle θ. We apply a protocol described previously to strecth our polystyrene microbeads [40]. This protocol is schemed in figure2.6.
First, the PS particles are dispersed in an aqueous solution of polyvinyl alcohol (PVA), a water soluble polymer. Then the solution is cast on a flat substrate and let
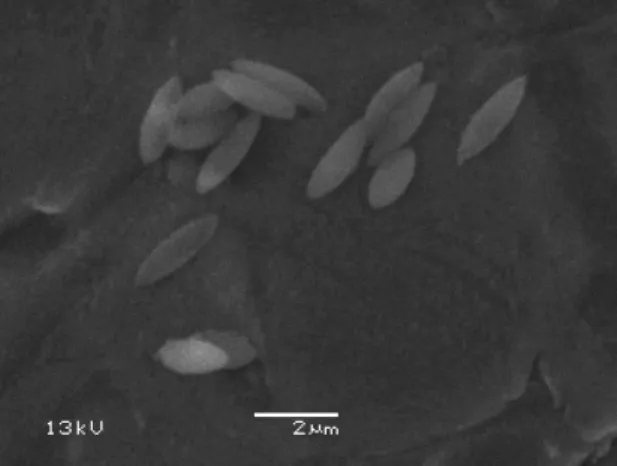
air-dried at room temperature overnight. The resulting film is then mounted on an extensible frame, and the assembly is immersed in a silicon oil bath heated at 170oC. This temperature is above the glass transition temperature both of PS and PVA, so that the film can be streched to the desired elongation thanks to the mobile frame. The elongated film is then cooled down and residual silicon oil is rinsed with isopropyl alcohol. The PVA film is redissolved in a DI water/isopropyl alcohol (IPA) mixture to redisperse the elongated particles, which are washed by multiple centrifugation/redispersion cycles in DI water. This process yields prolate PS ellipsoids, whose aspect ratio is proportionnal to the elongation applied on the PVA film. We perform scanning electron microscopy on dried samples of dispersion, as shown in figure2.7. The dimensions (major and minor axis) of the colloidal ellipsoids were directly measured on these images. The maximum aspect ratio reached is 3.5, and is limited by the size of the extensible frame.
Figure 2.6: (a) The PVA solution containing the dispersed PS spheres is cast on a plate. (b) It is air-dried, which yields a PVA film with embedded PS colloids. (c) The dried film is cut and mounted on an extensible frame. (d) The frame is immersed in hot silicon oil, extended, and removed from the oil bath while maintaining the extension. (e) The film is washed in IPA and redissolved in a 50/50 v/v mixture of DI water and IPA at 80oC. (f ) After several centrifugation/redispersion cycles, a dispersion of ellipsoidal colloids in water is obtained.
The quality of the cleaning protocol is tested by submitting 1µm particles to the thermal treatment in the PVA film but without elongation. The resulting particles are spherical, and their behavior is the same as the initial untreated particles when used in armor bubble experiments..
2.4
Imaging and control
The experiments in the microfluidic chip are monitored using an inverted Nikon micro-scope. Multiple types of illuminations are used, including brightfield, phase contrast, and epifluorescence. The images are acquired with an Insight Spot camera or a Photron
Figure 2.7: SEM micrograph of ellipsoids deposited by air-drying the dispersion obtained at the end of the protocol.
SA3 fast camera. Thresholding image analysis and the subsequent data extraction is performed under Matlab software.
For certain images, focus stacks are acquired either manually or using the motoriza-tion of the z-axis of the microscope. These stacks are then reconstructed into images with an extended depth of field using Nikon Elements or Adobe Photoshop softwares. These highly detailed images enable a qualitative description of the colloidal shells.
The flow in the microfluidic channels are driven by Cetoni Nemesys syringe pumps and Scientific Glass Engineering Analytical Science glass syringes, connected to the PDMS chip via polytetrafluoroethylene (PTFE) tubing. The internal pressure of the chip is controlled using an external Fluigent MFCS pressure controller.
Finally, the temperature is an important parameter and must be regulated to ensure the accuracy of the measurements. The microfluidic chip is therefore placed on a heated microscope stage (Warner Instrument), maintained at 50.0o throughout the experiment. An aluminium foil wrapped around the setup minimize the thermal pertubations due to the convection in the ambient air.
3
Experiments with armored bubbles
3.1
Producing and monitoring an armored bubble in
mi-crofluidics
In this section, we present the operation of the microfluidic device used in our experiment. A bright-field top view of the chip is shown in figure3.1, where its three main parts are highlighted. First (I), a wedged injector produces a single bubble on demand, according to the principles described earlier. Then (II), the bubble is pushed through a long coating channel, where its interface is coated with adsorbed colloidal particles. The coating mecanisms are explained in the next paragraph. Finally (III), we show how the armored bubble is trapped in a controlled environment observation chamber, to monitor its behavior under various conditions.
The progression of the bubble in the chip is shown in figure 3.2, which corresponds to the movie 1. The bubble is produced at the wedged inlet, and then journeys through the coating channel, before being released in the conical chamber.
Figure 3.1: Bird’s eye view of the microfluidic chip used in the experiments. (I) Area of bubble production, with air and particle dispersion injectors. (II) Coating chan-nel, to force the adsorbtion of particles at the air water interface and build the armor. (III) Conical observation chamber, connected to two independent outlets of a pressure controller.
Figure 3.2: (a) t=0 s. Bubble in the wedged injection chamber, in brigthfield illumina-tion. (b) Same as (a), in epifluorescence. The particles appear in white. (c-d) t=4-12 s. The bubble is pushed through the coating channel. (e) t=21 s. The partially armored bubble is released is the conical chamber. (f ) t=24 s. The particles still in suspension, not adsorbed on the interface are washed away by flow from the side channels. Scale bars are 1 mm.
3.1.1 Covering the air bubble
After its formation, the bubble moves along the gradient of confinement and reaches the rightmost extremity of the wedged injector, at the entrance of the coating channel. The bubble is then pushed by a flow of colloidal dispersion injected via two side injectors. The channel has been initially filled with particle dispersion, so that the bubble is surrounded by suspended particles. The flow of colloidal dispersion forces the bubble to travel inside the coating channel, where the armoring by colloidal beads takes place. Figure 3.3
shows the evolution of the bubble as it travels along the coating channel. The images are composites of bright-field and epifluorescence micrographs, where particles appear in green. The bubble has very few particles adsorbed on its surface at the entrance of the channel (figure 3.3(a)). As it progresses in the coating channel, particles gather at the rear of the bubble, gradually building the armor (figure3.3(b,c)).
Figure 3.3: Composite micrographs of the bubble being covered with particles as it travels throught the coating channel. The fluorescent particles appear in green. ((a)) Bubble in the injector, at the entrance of the channel. (b) Bubble in the first curve of the coating channel. (c) Bubble in the last straight line of the channel. Scale bars are 200 µm .
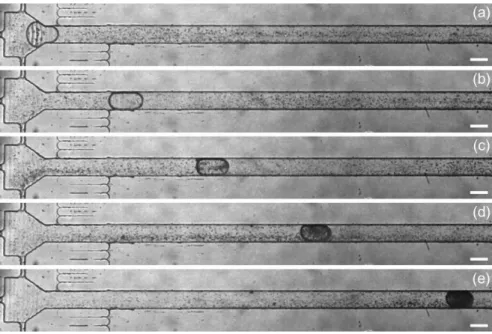
Figure 3.4 gives a more quantitative view of the covering process. The geometry of this covering channel is different. It is straight, and its heigth slowly increases with a slope of 0.5%, which explains the apparent size reduction of the bubble as it progresses through the channel. However, the coating mechanism stays the same and this very slight slope has no effect. In these bright field images, the bubble is initially transparent and becomes progressively darker, as the particle coverage increases. We did not carry out systematic measurements but this type of setup would allow a precise monitoring of the coating rate of the bubble.
We now present a mechanism for the adsorbtion of particles at the air-water interface. This mechanism has been recently extensively described by Zoueshtiagh et al. [41] in various wetting conditions at the scale of a millimetric glass capillary tube, but is slightly
Figure 3.4: Coating of a bubble in a straight channel. The scale bars are 1 mm and the images are 2 s appart.
different in our case. Similar bubbles behaviors have also been observed at smaller scales in microfluidic channel, using nanoparticles [42]. Therefore, we assume that a similar mechanism takes place in our coating channel. Zoueshtiagh et al. have shown that the mechanism at play when an air-in-colloidal-dispersion bubble travels through a capillary depends strongly on two contact angles: (i) the contact angle of the liquid phase (here water) on the wall of the capillary, (ii) the contact angle of the liquid dispersing phase on the solid particles.
In our case, the outer phase (water) partially wets the walls of the channel made of glass on one side, and PDMS on the other. As stated earlier, we ensured that these walls stay hydrophilic on the time scale on the experiment. However, the exact contact angle is unknown, but it can reasonnably be assumed to lie in between 40◦ and 70◦ [36].
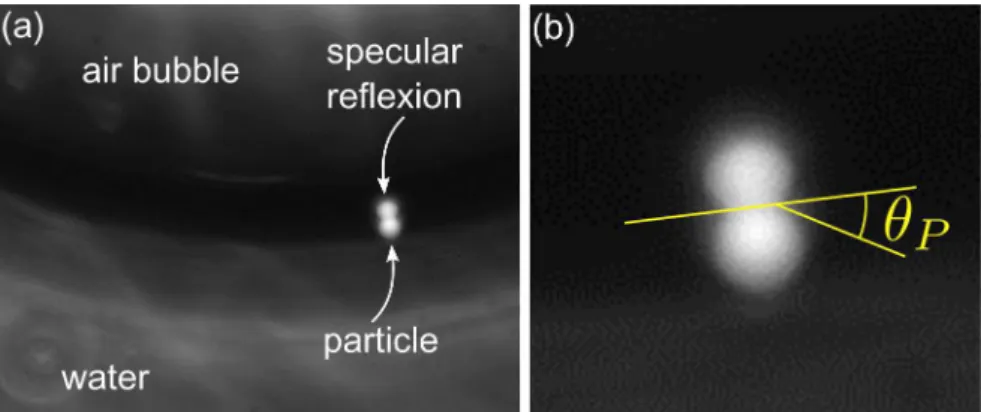
Regarding the contact angle on the particles, we were able to image a single particle adsorbed on the interface of a bubble with very low particle coverage. Using both bright-field illumination and epifluorescence, it is possible to image a side view of the adsorbed particle and its specular reflexion in the air-water interface (see figure 3.5). This way, we directly measure on the image an estimate of the contact angle of the water on the particle, θP ≈ 35◦− 45◦.
Using the phase diagram established by Zoueshtiagh et al. (see figure 3.6), we find that our experimental parameters correspond to the regime of particle being captured by the rear meniscus of the bubble, as is observed in our device.
Figure 3.5: (a) Image of a single 4.5 µm particle adsorbed on an air-water interface. The particle emits fluorescent light, and its specular reflexion in the interface can be seen. (b) Close-up showing the geometrical construction used to estimate the wetting contact angle of water on the particle.
Figure 3.6: Phase diagram adapted from Zoueshtiagh et al. [41], showing the behavior of an air bubble pushed through a capillary filled with colloidal dispersion. The contact angle of the liquid on the particles is reported on the vertical axis, and the contact angle on the wall on the horizontal axis. The case of the present experiment is highlighted in pink, and falls in regime 3.
More precisely, as the bubble advances, particles near the floor and ceiling of the channel may be trapped in the lubrication films when they come close to the nose (ie. the front meniscus) of the bubble [43]. Since the bubble has an elongated pancake geometry, the trapped particles are squeezed between the interface and the wall (see figure3.7). The thin film separating them from the bubble quickly drains, the particles pierce the interface, and becomes irreversibly adsorbed. Dewetting can occur on the wall,
creating some ’dewetted patches’, ie. droplets of water with adsorbed particles, pinned on the wall (see figure 3.7(d)). This is not an issue because they are ’swept’ by the rear meniscus that integrate the newly adsorbed particles into its interface, according to the mecanism described in [41].
Figure 3.7: (a-b)Phase contrast micrographs of the front meniscus (b) and rear meniscus (a) of a bubble advancing in the coating channel. (c) Side view of the bubble squeezed in the coating channel, moving from left to right. The green arrowed lines at the front of the bubble indicate the trajectories of the beads trapped in the lubrication films. (d) Close-up (not to scale) of the bottom face of the bubble, pressed against the glass slide, represented by the thick gray line.
However, in Zoueshtiagh’s experiment, the capillary has a circular section. In that case, the regime of covered meniscus can not give birth to an armored bubble because when it becomes fully covered, it reaches a limit contact angle at the wall and cannot integrate new particles. Once enough particles have covered the meniscus, it is not energetically favorable anymore to integrate new particles. But in our case, the channel has a rectangular cross section, which leaves gutters in the corners of the bubble where the adsorbed particles can freely recirculate, as depicted in figure 3.8 (see also movie 2). The particles are first trapped at the nose of the bubbles, then packed into the rear meniscus, and when the later is sufficiently covered, particles start to flow back toward the nose of the bubble. This recirculation enables a nearly complete coverage of the bubble.
However, the rate at which the particles adsorb on the interface must be carefully tuned. Indeed, if the bubble reaches full coverage before the end of the channel, the adsobed particles suddenly jam and the recirculation stops. The incoming flow of
dis-Figure 3.8: Sketch of a top view of a bubble being pushed from left to right in the coating channel (same point of view as in figure3.7(a-b)). (a) The green bead is first captured from the bulk dispersion to the lubrication film. (b) It then is trapped and squeezed against the wall of the channel. (c) The particle is then absorbed in the forming armor at the reat of the bubble. (d) As the armor gets more and more packed, it is pushed back toward the nose by other incoming particles. (e) It is then pushed further in the gutters of the channel. (f ) Finally, it comes back to the nose of the bubbles, and flows back into the lubrication film.
persion may then fragment the armored bubble, similarly to what is observed by Kotula et al. [42]. To avoid that, we dilute the initial particle dispersion to a concentration of 0.5% w/w so that the coverage of the bubble to not increase too quickly in the covering channel. The objective is that at the end of its travel through the coating channel, the bubble is almost fully coated with a monolayer of adsorbed particles.
3.1.2 Trapping and monitoring the bubble
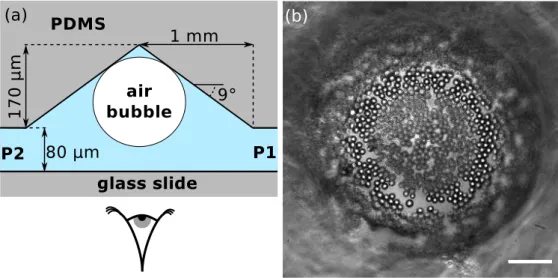
After the bubble has been coated with particles in the coating channel, it is released in a conical observation chamber. The geometry of this chamber is depicted in figure3.9(a). It consists of a wide cavity of radius 1 mm with a conical ceiling of maximum height 250 µm . The slope of the top wall ensures that the bubble rises by buoyancy and stays trapped at the center of the chamber. When the partially armored bubble leaves the coating channel, it is quickly attracted toward the center of the chamber. Afterward, a flow of clean water without particles is applied through the side channels labeled Pressure 1 and Pressure 2 on figure3.1. This removes the unattached particles floating around the armored bubble. As seen on the video, these particles are advected by the flow, while
the adsorbed particles circulate at the surface of the bubble. At the end of this process, a partially armored bubble is left trapped at the center of the observation chamber, as showed in figure3.9.
One can show that the bubble remains essentially spherical by calculating the Bond number of the system:
Bo = ∆ρgR 2 γ ≈ 103.10.10−8 10−1 = 10 −3 , (3.1)
where ∆ρ is the mass volume difference between air and water, g is the acceleration of gravity, R the typical radius of a bubble in the chamber, and γ the air-water sur-face tension. Since Bo << 1, it is reasonnable to consider that the trapped bubble is spherical.
Figure 3.9: (a) Cross section schematic of the conical observation chamber (not to scale). The trapped bubble is observed from below through the glass slide closing the microfluidic system. (b) Phase contrast micrograph of the bubble partially covered with 4.5 µm diameter particles. Scale bar is 30 µm .
The pressures in the two side branches P1 and P2 (’Pressure 1’ and ’Pressure 2’) can be independently adjusted. By setting a slight pressure difference between the two, we create the gentle flow necessary to wash the bubble. It is also possible to set the same pressure in both branches, but at a value higher than the atmospheric pressure. No flow is established because the channel is sealed, and its volume is fixed. We use this ability to fine tune the internal ambient pressure around the bubble to control its behavior. Indeed, an air-in-water bubble will swell if the pressure P is below a certain equilibrium value Peq, and will dissolve and shrink if it is above. For P = Peq, the bubble