5 authors, including:
Some of the authors of this publication are also working on these related projects:
Scalable Data Dissemination in VANETsView project
FlexRFIDView project Mohammed Boulmalf
Université Internationale de Rabat 91PUBLICATIONS 691CITATIONS SEE PROFILE Tamer Rabie University of Sharjah 73PUBLICATIONS 648CITATIONS SEE PROFILE Abderrahmane Lakas
United Arab Emirates University 90PUBLICATIONS 897CITATIONS
SEE PROFILE
Hesham El-Sayed
United Arab Emirates University 52PUBLICATIONS 321CITATIONS
SEE PROFILE
All content following this page was uploaded by Tamer Rabie on 04 October 2016.
Int. J. Value Chain Management, Vol. 2, No. 1, 2008 109
Copyright © 2008 Inderscience Enterprises Ltd.
Performance evaluation study of an indoor
IEEE 802.11g
Mohammed Boulmalf*, Tamer Rabie,
Khaled Shuaib, Abderrahamne Lakas and
Hesham El-Sayed
College of Information Technology UAE University, Al-Ain, 17555, UAE Fax: +971–3–7626309 E-mail: [email protected] E-mail: [email protected] E-mail: [email protected] E-mail: [email protected] E-mail: [email protected] *Corresponding author
Abstract: Wireless Local Area Networks (WLANs) based on IEEE
802.11a/b/g standards are growing rapidly. WLANs can provide the benefits of network connectivity without the restrictions of being tied to a location or restricted by wires. Despite this convenience of mobility, the performance of a WLAN must be addressed carefully before it can be adopted and deployed in any environment. In this paper, we address the impact of various key parameters on the actual performance of IEEE 802.11g. A series of controlled experiments are carried out to assess the performance of IEEE 802.11g in the presence of interferences, and to find the maximum throughput under realistic conditions.
Keywords: Wireless Local Area Network; WLAN; IEEE 802.11g;
performance; throughput.
Reference to this paper should be made as follows: Boulmalf, M., Rabie, T.,
Shuaib, K., Lakas, A. and El-Sayed, H. (2008) ‘Performance evaluation study of an indoor IEEE 802.11g’, Int. J. Value Chain Management, Vol. 2, No. 1, pp.109–118.
Biographical notes: M. Boulmalf received his MSc and PhD degrees
in Wireless Communications from the INRS-Telecom, Montreal, Canada, in 1994 and 2001 respectively. In 2002, he joined the College of Information Technology at the United Arab Emirates University, Abu Dhabi – Al-Ain, where he is now an Assistant Professor. He has held many RF engineering positions, at INRS-Telecom (Montreal, Canada), Microcell (Montreal, Canada), and Ericsson (Montreal, Canada). He is the author/co-author of about 30 papers in refereed journals and conferences in the areas of wireless networking and communications, mobile computing and network security.
T. Rabie is an Associate Professor at the College of Information Technology, UAE University, United Arab Emirates. He received his PhD in Computer Science from the University of Toronto, Canada. His research interests include digital image processing, computer vision, virtual reality, and their application
to the field of intelligent transportation systems. Dr. Rabie is a Senior Member of the IEEE and a member of the Professional Engineers of Ontario (PEO) Association in Toronto, Canada.
K. Shuaib received his PhD in Electrical Engineering from the City University of New York, 1999. Since September 2002, Dr. Shuaib has been with the College of Information Technology at the UAE University as an Assistant Professor. Currently, he is the Program Coordinator of the Network Engineering Track and the Director of the UAE University Cisco Regional Networking Academy. His research interests are in the area of network design and performance, video transmission over terrestrial and wireless networks, and protocols for ad hoc and wireless networks. Dr. Shuaib is a Senior IEEE member, a member of the IEEE Communications Society and a member of the IEEE Communications and Information Security Technical Committee (CISTC).
A. Lakas is an Assistant Professor in Networking at the College of Information Technology, UAE University, UAE. He received his PhD and MSc degrees in Computer Systems from the University of Paris VI, France. Prior to his current position, he held many positions in telecommunication companies such as Newbridge (Canada, 1997), Nortel (Canada, 1998), Netrake (Texas, USA, 2001) and SIPquest (Canada, 2003). His current research focuses on voice over IP, quality of service, wireless and mobile networks, and pervasive applications.
Dr. H. El-Sayed is currently an Assistant Professor at the College of Information Technology, United Arab Emirates University. He received his PhD in Systems and Computer Engineering from Carleton University, Canada, in 1999. His broad research interests span the areas of mobile and wireless networks, IP networking, data mining in telecommunications, and software performance engineering. Before joining the United Arab Emirates University in 2003, Dr. El-Sayed held several industrial positions at Nortel Networks, Wind River Systems, and Paragon Networks (acquired by Carrier Access Corporation).
1 Introduction
The Wireless Local Area Network (WLAN) market has grown rapidly, as wireless technology has evolved to meet fundamental needs of businesses and technology consumers. Corporate IT departments are deploying WLANs to support roaming employees, reduce the cost of cabling and provide a rapid response to changes in connectivity demands. The mobile worker uses public-access WLANs in cafes, airports, trains, lobbies and remote corporate sites to connect to the corporate network or internet. Small offices and enterprises use WLANs to share internet connections, printers and peripherals, and create backup connectivity solutions while remaining highly scalable and flexible. The home-based networks use WLAN technology to share broadband internet connection among multiple families’ PCs. The IEEE 802.11g wireless standard is the latest WLAN technology to be ratified by IEEE. It extends the widely deployed IEEE 802.11b by broadening its data rates to 54 Mbps within the 2.4 GHz band using Orthogonal Frequency Division Multiplexing (OFDM) modulation (Carney, 2002; Cisco, 2005).
Performance evaluation study of an indoor IEEE 802.11g 111 To design and deploy a WLAN network, an accurate deployment procedure is required to ensure sufficient coverage and network functionality (capacity, interference,
etc.). While wireless networking gear is often classified according to its standards-based
signalling rate, such as 54 Mbps for 802.11g, the actual data throughput, or data being transmitted, is often just a fraction of the theoretical maximum rate. Research conducted by Henry (2001) showed that the user throughput performance changes radically when access points or clients are located near an interfering transmitter or when frequency planning is not carefully conducted. Data throughput can also be limited owing to a number of important environmental and product-specific factors, including:
• distance between WLAN devices: Access Points (APs) and Network Interface Cards (NICs)
• transmission power levels
• effect of waveguide, e.g., in hallways • building and home materials
• radio frequency interference • signal propagation
• antenna type and location.
Therefore, even though the new 802.11g products available are capable of a 54 Mbps signalling rate, the practical, or ‘actual’, data throughput is more likely to be much less than that (in the 10–12 Mbps range).
There are few papers that discuss the performance of the 802.11b standards, such as Rose et al. (2002) and Zahur et al. (2003), and to the best of our knowledge, there is no work in the literature that discusses the throughput performance of 802.11g WLANs in small enterprise environments such as a cubicle-offices area. In this paper, we present a full-scale performance study and analysis conducted on IEEE 802.11g to measure its effective application-level throughput under different scenarios. In order to improve its performance, a clear understanding of WLAN behaviour is needed, therefore measuring and analysing the performance of a system under realistic conditions is of paramount importance. Initially, much of the WLAN research was conducted primarily through the use of analytic models (Biani, 2000; Cali et al., 1998) and simulation techniques (Carvalho and Garcia-Luna-Aceves, 2003; Chatzimisios et al., 2004). Only recently have researchers tackled the task of measuring WLANs (Jardosh et al., 2005) to understand performance anomalies. However, accurate WLAN measurements have proven more elusive than measurements for wired LANs owing to the unique characteristics of the wireless medium. For example, measurements over a single wireless hop, such as in an 802.11 infrastructure network, can vary depending upon the hop distance, cross and contending traffic, the building structure and even the human motion within a measurement test-bed (Li et al., 2006).
In our experiments, we studied the performance of WLAN in both asynchronous (UDP) and synchronous (TCP) communications by varying the packet size and Inter-Packet Delay (IPD). We also studied the effect of interferences on TCP and UDP traffic. The remainder of this paper is organised as follows. Section 2 presents an overview of the measurements undertaken, and describes the test set-up and testing environment. Section 3 discusses the performance experiments carried out. Finally, Section 4 concludes the paper.
2 Measurement campaign overview and test set-up
In order to design a WLAN, it is often necessary to perform a measurement campaign to ensure that the WLAN provides the needed coverage and capacity (i.e., throughput) for the intended users. With this need in mind, a full measurement campaign was performed. In this study, we used a test-bed of ten IEEE 802.11g access points where the set-up was a typical indoor cubicle-offices environment. Then measurements of the TCP and UDP throughput were collected in the presence of interferences. In addition, we investigated the impact of interferences on the quality of video when streamed over WLAN. The details of the IEEE 802.11g test-bed and the testing environment are discussed in the following subsections. Details of the measurement campaign and results are presented in Section 3.
2.1 Testing environment
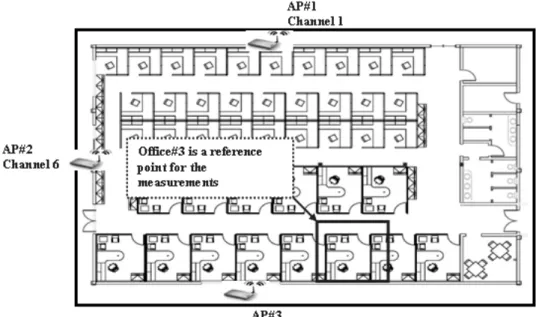
Figure 1 shows the physical layout of the measurement environment in the campus of the College of IT at the UAE University. The measurement environment is basically an open area with 42 cubicles and served by three IEEE 802.11g Nortel APs using Channels 1, 6 and 11. In addition, the environment includes seven other IEEE 802.11g Nortel APs located outside the open area at fixed places inside the campus to serve the offices outside the open area. All ten APs are connected to a main switch in the campus using a 10/100 Mbps Ethernet cable.
During all experiments, the ten access points were actively busy serving around 50 active mobile users inside the campus rooms. These APs generate an interference-rich environment, and were used to evaluate how the IEEE 802.11g test-bed system performs in the presence of interferences.
Performance evaluation study of an indoor IEEE 802.11g 113 During all experiments, cubicle #3 was used a reference point for all measurements, and the LanTrafficTM v2 software (produced by France Telecom R&D) was used to generate
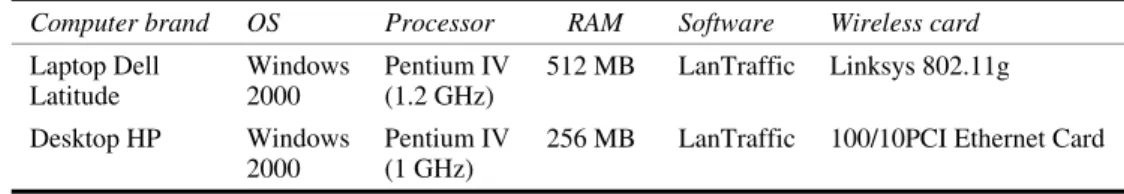
UDP and TCP traffic. As a client, we used a laptop with a 54 Mbps WLAN card, and as a server we used a desktop PC that was connected to the main switch, which also connected all APs using a 10/100 Mbps Ethernet cable. Specifications of the laptop and desktop PC are shown in Table 1.
Table 1 Computers and setting used in measurements
Computer brand OS Processor RAM Software Wireless card
Laptop Dell
Latitude Windows 2000 Pentium IV (1.2 GHz) 512 MB LanTraffic Linksys 802.11g Desktop HP Windows
2000 Pentium IV (1 GHz) 256 MB LanTraffic 100/10PCI Ethernet Card
3 Performance evaluation experiments
This section discusses the three different scenarios that were used to measure the performance of the WLAN systems under testing. The three measurement scenarios reflect different indoor environments that are likely to be used in WLAN networks, and were selected to reflect a range of typical installation locations. The measurements were taken on a single floor at various locations throughout all the experiments, with the access point located in a central location. In all testing scenarios, the RTS/CTS protection mode was turned on. In this mode, when a device wants to communicate, it sends a Request To Send (RTS) to the destination node, and waits for a Clear To Send (CTS) message before it transmits any data. This is done to avoid collisions; however, this brings the maximum data-throughput performance down (see Broadcom (2003) for further details). During all experiments, all power-save features of the WLAN cards were disabled and no WEP encryption was used. Specific details of each of these scenarios are given in the following sections.
3.1 Scenario 1: calculation of the effective TCP/UDP throughput
The basic idea behind this scenario is to calculate the effective TCP/UDP throughput in an interference-rich environment. The set-up is illustrated in Figure 2. The laptop was located within 7 m from AP#3 to ensure high signal strength. Both the AP and desktop were connected to the same Ethernet LAN segment via the main switch. Traffic was generated using LanTrafficTM with packet payload varying from 64 to 1460 bytes and the
IPD varying from 1 to 20 ms. For all tests, 50 000 packets were transferred between the WLAN laptop (client) and the desktop (server).
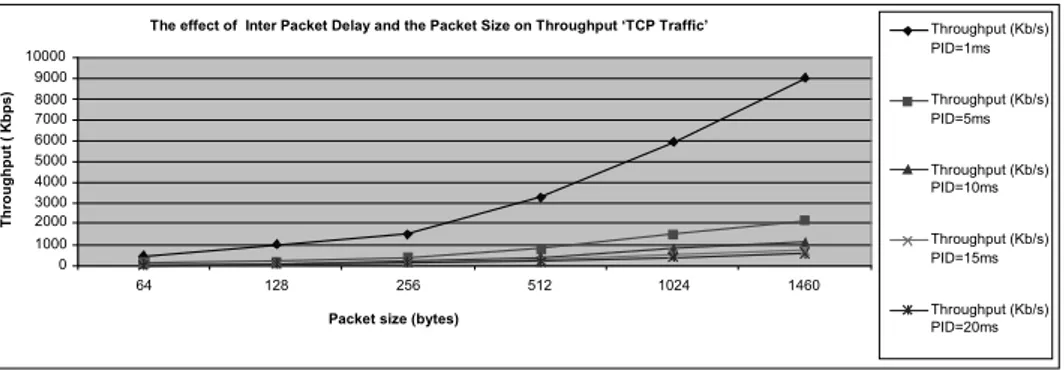
Figure 3 and Figure 4 show the measured throughput for TCP and UDP traffic respectively. It has been noticed that the throughput increases as the packet size increases. It has also been noticed, for both TCP and UDP experiments, the throughput increases as the IPD decreases. The maximum throughput can be achieved with maximum packet size and minimum IPD. This throughput is around 9 Mbps with one user. This means that if we have more users, they will share the 9 Mbps, and consequently the throughput will decrease dramatically.
Figure 2 The IEEE 802.11g measurement test-bed without interferences
Figure 3 The effect of packet size and IPD on the throughput in TCP
Figure 4 The effect of packet size and IPD on the throughput in UDP
3.2 Scenario 2: generation of co-channel interferences
The main objective of this scenario is to study the effect of co-channel interferences on UDP/TCP Traffic. In this experiment, we considered two segments using similar infrastructures. In each segment, we used one laptop with wireless connection acting as a sender and a desktop with wired connection acting as the receiver. The first segment used Nortel AP (Channel 11) and the second segment used Linksys Access Point
The effect of Inter Packet Delay and the Packet Size on Throughput ‘TCP Traffic’
0 1000 2000 3000 4000 5000 6000 7000 8000 9000 10000 64 128 256 512 1024 1460
Packet size (bytes)
Thr oughput ( K bps ) Throughput (Kb/s) PID=1ms Throughput (Kb/s) PID=5ms Throughput (Kb/s) PID=10ms Throughput (Kb/s) PID=15ms Throughput (Kb/s) PID=20ms
The effect of Inter Packet Delay (IPD) and the Packet Size on Throughput ‘UDP Traffic’
0 1000 2000 3000 4000 5000 6000 7000 8000 9000 10000 64 128 256 512 1024 1460
Packet size (bytes)
Thr oughput ( K bps ) Throughput (Kb/s) PID=1ms Throughput (Kb/s) PID=5ms Throughput (Kb/s) PID=10ms Throughput (Kb/s) PID=15ms Throughput (Kb/s) PID=20ms
Performance evaluation study of an indoor IEEE 802.11g 115 (Channel 11). Moreover, we installed LanTraffic software in each computer to send data traffic from a sender to a receiver in the network. The test-bed of this scenario is shown in Figure 5.
Figure 5 Test-bed with a co-channel interferences generator
In order to assess the effect of the co-channel interference on the performance of the network, we measured the highest possible throughput that we could get without interferences (with IPD set to 1 ms and packet size equal to 1460 bytes) and considered this throughput as the base line. The results of the experiments are presented in Table 2, where the effect of the co-channel interference is clearly shown to drastically degrade the throughput performance, with TCP suffering much more than UDP. This is explained by the delays incurred by the retransmission and error detection. The throughput in the UDP mode also decreased with co-channel interferences, but smoothly, because there was no error detection and no retransmission.
Table 2 Test-bed of co-channel interferences scenario
Mode Condition Throughput (kbps)
Without co-channel interference 9703.2 UDP
With co-channel interference 8606.9 Without co-channel interference 9096.7 TCP
With co-channel interference 2207.6
3.3 Scenario 3: video streaming with interferences
The objective of this scenario is to study the impact of channel interferences and noise on the quality of video streaming. Streaming video is a process that allows video content to be delivered in real time across the network to the user's browser without requiring the entire clip to be downloaded before it can be viewed. Without this technology in place, websites would require users to wait until the whole content was completely downloaded. For instance, an uncompressed Audio Visual Information (AVI) file that is only 40 s long may take over 20 min to download using a 56 Kbps modem. Compare this with an AVI file that has been converted to a suitable streaming format and hosted on a streaming
server; the clip would begin to play back during the downloading process. A streaming video file can be of virtually unlimited length, and can run over the internet using bandwidths of 56 Kbps and upwards.
Applications such as video streaming are used in a variety of situations, bringing commercial benefits to companies such as content providers. For instance, they can be utilised for sales demonstrations, training presentations, entertainment, publishing, advertising and news. In order to understand the effect of channel interference and noise on the quality of video streaming, we simulated and analysed three different scenarios. The first scenario, shown in Figure 6(a), consists of a network with no interference. The client and the server were connected to the access point by an RJ45 cable. The second scenario, shown in Figure 6(b), was implemented with adjacent interference, which was caused by nearby laptops, mobile phones, neighbouring access points and other devices that interfered with each other’s transmission. The third scenario is shown in Figure 6(c). In this scenario, there were two types of interferences: adjacent and co-channel interferences. In addition, we had more interferences coming from running LAN Traffic in the background.
In the three scenarios, the client is streaming the video from the server and capturing it to analyse the output. The video is first captured while it is being streamed from the server and frames are randomly extracted from the captured video (keeping a record of the frame numbers that are extracted). These frames are then converted into grey-scale images and the Peak Signal-to-Noise Ratio (PSNR) is then computed between the captured random selected frames and their original grey-scale counterparts in each of the three scenarios, then the average PSNR is computed for all the frames of each scenario.
A Matlab script was developed to calculate the Root Mean Squared Error (RMSE). The RMSE is usually used as a measure of video degradation due to compression or channel impairments. Given an original N × M image f and a compressed or degraded image f ′, the RMSE can be calculated according to the following formula, as described in Gringeri et al. (1999): 1 1 ' 2 0 0 1 [ ( , ) ( , )] . . N M x y RMSE f x y f x y N M − − = = =
∑ ∑
− (1)The PSNR is derived using RMSE to denote the deviation of a compressed or degraded image from the original in dB. For an eight-bit image, with intensity values between 0 and 255, the PSNR is given by:
10 255 20 log . PSNR RMSE ⎛ ⎞ = ⎜ ⎟ ⎝ ⎠ (2)
The PSNR values were calculated using both the luminance and chrominance information in the raw video frames. In our experiments, for each iteration of the video sequence, the PSNR was calculated for each frame then averaged over the total number of frames in the sequence. The overall PSNR was calculated by averaging the PSNR values of all iterations.
The average PSNRs for the captured video for the three scenarios are 19.9 dB, 20.4 dB and 24 dB respectively for co-channel interferences, adjacent interferences and without interferences. It is clear from the average PSNR values obtained that the signal quality is affected to a greater extent when the type of interference is co-channel and adjacent.
Performance evaluation study of an indoor IEEE 802.11g 117
Figure 6 (a) Scenario 3a: no interference; (b) Scenario 3b: adjacent interference;
(c) Scenario 3c: adjacent and co-channel interference
4 Conclusion
In this paper, we have conducted a campaign of tests to characterise the performance of IEEE 802.11g in a typical cubicle-offices environment. The throughput performance of UDP and TCP traffic were evaluated under different realistic operational scenarios. Our results showed that the performance of IEEE 802.11g can be greatly degraded owing to co-channel interferences, especially for TCP traffic. In addition, we looked at how the video quality was affected when streamed over a WLAN in the presence of adjacent and co-channel interferences. The PSNR of a video frame was shown to be degraded by up to 13 dB in some cases owing to interferences.
References
Biani, G. (2000) ‘Performance analysis of the IEEE 802.11 distributed coordination function’,
IEEE Journal on Selected Areas in Communications, Wireless Series, Vol. 18, No. 3,
pp.535–547.
Broadcom (2003) ‘IEEE 802.11g: the new mainstream Wireless LAN standard’, White paper. Cali, F., Conti, M. and Gregory, E. (1998) ‘IEEE 802.11 Wireless LAN: capacity analysis and
protocol enhancement’, Proceedings of IEEE INFOCOM, San Francisco, California, USA, pp.142–149.
Receiver Ethernet Sender with Linksys
Adapter G Sender Receiver Linksys AP with router RJ-45 Cable RJ-45 Cable (b) (a) (c)
Carney, W. (2002) IEEE 802.11g New Draft Standard Clarifies Future of Wireless LAN, Wireless Networking Business Unit, Texas Instruments, USA.
Carvalho, M. and Garcia-Luna-Aceves, J. (2003) ‘Delay analysis of IEEE 802.11 in single hop networks’, Proceedings of the IEEE International Conference on Network Protocol (ICNP), Atlanta, Georgia, USA.
Chatzimisios, P., Boucouvala, A.C. and Vitsas, V. (2004) ‘Performance analysis of IEEE 802.11 DCF in presence of transmission errors’, IEEE International Conference on Communications
(ICC), Vol. 27, pp.3854–3858.
Cisco (2005) ‘Capacity, coverage, and deployment considerations for 802.11g’, Cisco Systems, USA.
Gringeri, S., Egorov, R., Shuaib, K., Lewis, A. and Basch, B. (1999) ‘Robust compression and transmission of MPEG-4 video’, 7th ACM International Conference on Multimedia, 30 October–5 November, pp.113–120.
Henry, B.E. (2001) ‘Throughput measurements and empirical prediction models for IEEE 802.11b Wireless LAN (WLAN) installations’, Master thesis, Virginia Polytechnic Institute and State University, Virginia, USA.
Jardosh, A.P., Ramachandran, K.N., Almeroth, K.C. and Belding-Royer, E.M. (2005) ‘Understanding congestion in IEEE 802.11b wireless networks’, Proceedings of the Internet
Measurement Conference (IMC), Berkeley, California, USA.
Li, F., Li, M., Lu, R., Wu, H., Claypool, M. and Kinicki, R. (2006) ‘Tools and techniques for measurement of IEEE 802.11 wireless networks’, Proceedings of the Second International
Workshop on Wireless Network Measurement (WiNMee), Boston, Massachusetts, USA.
Rose, C., Ulukus, S. and Yates, R.D. (2002) ‘Wireless systems and interference avoidance’, IEEE
Transactions on Wireless Communications, pp.415–428.
Zahur, Y., Doctor, M., Davari, S. and Yang, T.A. (2003) ‘802.11b performance evaluation’,
Proceedings of the 2nd IASTED International Conference on Communications, Internet, and Information Technology, Scottsdale, Arizona, USA.
View publication stats View publication stats