HAL Id: halshs-01570057
https://halshs.archives-ouvertes.fr/halshs-01570057
Preprint submitted on 28 Jul 2017HAL is a multi-disciplinary open access archive for the deposit and dissemination of sci-entific research documents, whether they are pub-lished or not. The documents may come from teaching and research institutions in France or abroad, or from public or private research centers.
L’archive ouverte pluridisciplinaire HAL, est destinée au dépôt et à la diffusion de documents scientifiques de niveau recherche, publiés ou non, émanant des établissements d’enseignement et de recherche français ou étrangers, des laboratoires publics ou privés.
The Long-Lasting Effects of Family and Childhood on
Adult Wellbeing: Evidence from British Cohort Data
Sarah Flèche, Warn Lekfuangfu, Andrew E. Clark
To cite this version:
Sarah Flèche, Warn Lekfuangfu, Andrew E. Clark. The Long-Lasting Effects of Family and Childhood on Adult Wellbeing: Evidence from British Cohort Data. 2017. �halshs-01570057�
WORKING PAPER N° 2017 – 33
The Long-Lasting Effects of Family and Childhood on Adult
Wellbeing: Evidence from British Cohort Data
Sarah Flèche
Warn N. Lekfuangfu
Andrew E. Clark
JEL Codes: A12, D60, I31
Keywords: life satisfaction, cohort data, childhood, adult outcomes
P
ARIS-
JOURDANS
CIENCESE
CONOMIQUES48, BD JOURDAN – E.N.S. – 75014 PARIS
TÉL. : 33(0) 1 43 13 63 00 – FAX : 33 (0) 1 43 13 63 10 www.pse.ens.fr
CENTRE NATIONAL DE LA RECHERCHE SCIENTIFIQUE – ECOLE DES HAUTES ETUDES EN SCIENCES SOCIALES ÉCOLE DES PONTS PARISTECH – ECOLE NORMALE SUPÉRIEURE
1
The Long-Lasting Effects of Family and Childhood on Adult Wellbeing:
Evidence from British Cohort Data
S
ARAHF
LÈCHE*
CEP, London School of Economics
S.Fleche@lse.ac.uk
W
ARNN.
L
EKFUANGFUCEP, London School of Economics and Chulalongkorn University
nuarpear.l@chula.ac.th
A
NDREWE.
C
LARKParis School of Economics – CNRS and CEP, London School of Economics
Andrew.Clark@ens.fr
This version: July 2017
* Corresponding author: CEP, London School of Economics, Houghton Street, London, WC2A 2AE. E-ma il: S.Fleche@lse.ac.uk. The authors thank Richard Layard and Nick Powdthavee for many useful discussions. Support from the US National Institute on Aging (Grant R01AG040640), the John Templeton Foundation and the
What Work s Centre for Wellbeing is gratefully acknowledged. For the BCS and NCDS data access, we are grateful
to The Centre for Longitudinal Studies, UCL Institute of Education for the use of these data and to the UK Data Archive and UK Data Service for making them available. However, they bear no responsibility for the analysis or interpretation of these data.
2
Abstract
To what extent do childhood experiences continue to affect adult wellbeing over the life
course? Previous work on this link has been carried out either at one particular adult age or for
some average of adulthood. We here use two British birth-cohort datasets (the 1958 NCDS and
the 1970 BCS) to map out the time profile of the effect of childhood on adult outcomes,
including life satisfaction. We find that the effect of many aspects of childhood do not fade
away over time, but are rather remarkably stable. In both birth cohorts child non-cognit i ve
skills are the strongest predictors of adult life satisfaction at all ages. Of these, emotional health
is the strongest. Childhood cognitive performance is more important than good conduct in
explaining adult life satisfaction in the earlier cohort, whereas this ranking is inverted in the
more recent BCS.
Keywords: life satisfaction, cohort data, childhood, adult outcomes.
3 1. Introduction
Previous work has established that the childhood environment plays a powerful role in shaping both socioeconomic success and adult wellbeing. In particular, the analysis of British Cohort Study (BCS) data in Layard et al. (2014) revealed that a substantial proportion of the variation across individuals in life satisfaction at age 34 results from childhood cognitive and non-cognitive skills, family economic characteristics and parental psychosocial background.1 Analogous findings appear in Frijters et al. (2014) using National Child Development Study (NCDS) data, for both average life satisfaction over time and life satisfaction at age 50.
This existing work has considered adulthood as a single period, focusing on a single adult year or the average over adult years. The implicit assumption is thus that the effects of childhood on adult life satisfaction are constant over adult ages. However, a growing body of evidence has argued that the formation of skills and/or capabilities (for example education, health status and social wellbeing) is, in fact, dynamic (see Heckman and Mosso, 2014, for a recent literature review). And as individual life satisfaction is thought to reflect these dynamically-accumulated capabilities (e.g. Oreopoulos and Salvanes, 2011, and Powdthavee et al., 2015), we might expect the determinants of life satisfaction to change by adult age.
In the conventional model of skill formation, cognitive and non-cognitive skills are accumulated over time, and earlier stocks of skills depreciate with age (Grossman, 1972). The influence of childhood on later outcomes may then be attenuated over time (Todd and Wolpin, 2003 and 2007). A relatively happy childhood – in terms of financial resources, parental employment and education, emotional support, intellectual performance and health – may yield satisfaction in early adulthood, but with an effect that fades away at older ages. However, recent work on early-childhood development has emphasised the non-linear technology of skill formation (Cunha and Heckman, 2007, and Cunha et al., 2010).2 Here the effects of childhood at different adult ages may persist.
We contribute to this literature by estimating the life-cycle effects of family environment and child outcomes on adult wellbeing at a number of different adult ages: this has not been taken into account in the existing life-satisfaction literature. Following Layard et al. (2014), we also establish which of the intermediate adult outcomes (income, education, employment, health, etc.) are the most important channels for the effect of childhood on adult life-satisfaction. We can thus establish which early
1 The childhood variables in Layard et al. (2014) are grouped into family economic, family psychosocial, emotional health, good conduct and intellectual performance variables.
2 Cunha et al. (2010) find that the elasticity of substitution for cognitive skills and investment is smaller, while that for non-cognitive skills and investment is larger and constant at any age over the life cycle.
4
childhood circumstances cast the longest shadow over both adult outcomes and life satisfaction at later ages.
We use data from two British birth cohorts (the 1958 NCDS and the 1970 BCS) to analyse the determinants of a successful adult life. The 1970 BCS follows approximatively 17,000 individuals from birth to up to age 42 at the most recent data sweep. BCS respondents are interviewed roughly every five years, on a variety of topics including health, the labour market, individual behaviours and family formation. As the BCS is a birth cohort, we also have information collected during the respondent’s childhood. Adult life-satisfaction is recorded when the respondent is aged 26, 30, 34 and 42. The 1958 NCDS also contains measures of both childhood experiences and outcomes during adulthood, including life satisfaction at ages 33, 42 and 50. The comparison of these two cohort datasets will allow us to look for differences in the age profile of the effect of childhood on adult wellbeing across birth cohorts.
The remainder of the paper is organised as follows. Section 2 presents a brief overview of the literature on the impact of childhood on adult wellbeing. Section 3 describes the datasets that we use, and Section 4 discusses our main results. Section 5 then looks at the various pathways from childhood experiences to adult wellbeing. Last, Section 6 concludes.
2. Background
There is by now a substantial literature on the relationship between childhood and later adult outcomes (see for example, Keane and Wolpin, 1997, Currie and Almond, 2011 and, Huggett et al., 2011).3 This literature has clearly shown that early-life characteristics and circumstances predict adult outcomes, including wages, schooling, participation in crime, and success in many aspects of social and economic life. In recent years, economists have included life satisfaction in the list of adult variables that may be determined by childhood circumstances (Frijters et al., 2014; Layard et al., 2014).
Programme interventions with long-term follow-ups have confirmed that childhood conditions do affect adult outcomes (see the recent review of Heckman and Kautz, 2014). The success of the Perry Preschool Program4 in the US in the early 1960s is widely-cited in support of early public investment in disadvantaged children. The Perry program, along with other similar contemporary projects were found to significantly improve adult outcomes, including education, employment, earnings, marriage
3 For further details of each itemised childhood factor (for example birthweight, early health conditions, family income and environmental-risk exposure), see Ahlburg, 1998; Currie and Thomas, 1995, 1999; McLeod and Kaiser, 2004; Case et al., 2005; Black et al., 2007; Blanden et al., 2007; Mensah and Hobcraft, 2008; Currie , 2009; Smith, 2009; Contoyannis and Dooley, 2010; Currie et al., 2010; Frijters et al., 2010; Currie, 2011, Goodman et al., 2011; Salm and Schunk, 2011; and Conti and Heckman, 2014.
4 The Perry Preschool Program was a randomised trial that targeted disadvantaged low-IQ African-America n children aged between 3 and 4. After two years, all participants left the programme and entered the same public school. Data were collected on the treatment and control groups up to age 40.
5
and participation in healthy behaviours, and to have reduced participation in crime (Heckman et al., 2010 and García et al., 2016).5
Parental influence and family environment are well-documented as key childhood circumstances affecting both cognitive and non-cognitive skills (Cuhna and Heckman, 2008; Cuhna et al., 2010; Heckman and Mosso, 2014, and Conti and Heckman, 2014). These former include financial resources and financial strain, parental education and employment, parenting style and the family psychosocial environment. These cognitive and non-cognitive skills in turn have direct effects on wages, schooling, participation in crime, and many other aspects of social and economic life (see e.g. Heckman, 2005; Borghans et al., 2010; Heckman and Rubinstein, 2011).
Taking these observations as established, child development is conventionally considered as a cumulative function of past family background and skill acquisition (see Becker, 1967 and Grossman, 1972). In these models, skill is accumulated via a weighted linear technology, so that a skill acquired in a given period may have a declining effect as the individual ages.
However, the recent literature on the economics of child development takes an alternative approach. There is growing evidence that the technology of skill formation is, in fact, non-linear with dynamic complementarity (Cunha et al., 2010). There are two key characteristics of this technology: family environment in childhood remains an important contributor to adult success, and the long-run influence of family environment can be as large as that earlier in adult life. Strong evidence is shown for the effects of early health conditions, for example low birth weight or parental health conditions, on later physical health status (see Case et al,. 2005, Smith, 2009 and Currie et al., 2010).
We here contribute to the literature on the life-cycle impact of childhood variables by focusing on adult life satisfaction. Our contribution is two-fold. We first model the effects of childhood, through family economic and parental psychosocial background and investment in cognitive and non-cognitive skills, on adult life satisfaction at different ages. Second, we ask which intermediate adult outcomes (income, education, employment and health) are the most important channels for the effect of childhood on adult life-satisfaction at different ages.
3. Data and Methods
We use two British cohort datasets. The first is the 1970 British Cohort Study (BCS), which follows around 17,000 individuals from birth up to age 42 (at the latest data release). The data here provide a
5 Examples of early-childhood programmes are the Carolina Abecedarian Project (ABC) and the Carolina Approach to Responsive Education (CARE). Both programmes were launched in the 1970s and have long -term follow-ups through the mid-30s. The programmes started with early interventions (begun at the age of 8 weeks) and engaged participants from disadvantaged backgrounds up to age 5.
6
broad range of information on socioeconomic characteristics, subjective wellbeing, family environment and individual life circumstances. Information is available on respondents at birth and ages 5, 10, 16, 26, 30, 34 and 42. Subjective wellbeing is assessed using the life-satisfaction question “How dissatisfied
or satisfied you are about the way your life has turned out so far”, with responses on a 0-10 scale, from
age 26 onwards. The descriptive statistics for adult life satisfaction and the main BCS childhood variables we use in our analysis appear in the left-hand panel of Table 1.
The second cohort dataset is the National Child Development Study (NCDS), which covers 17,000 children born in England, Scotland and Wales in a single week in 1958. Following the birth survey in 1958, there have been nine public-use sweeps of the survey members at ages 7, 11, 16, 23, 33, 42, 46, 50 and 55 (as of 2017). At ages 33, 42 and 50, cohort members answered the same life-satisfaction question as in the BCS above, with answers on the scale from 0 “completely dissatisfied” to 10 “completely satisfied”. The right-hand panel of Table 1 describes the main NCDS variables, which mirror closely those from the BCS.
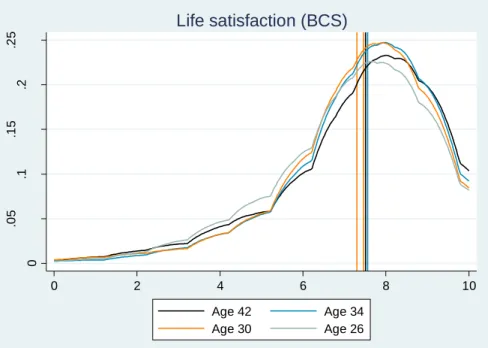
Figures 1A and 1B depict the kernel distribution of life satisfaction in the BCDS (at ages 26, 30, 34 and 42) and the NCDS (at ages 33, 42 and 50). The modal life satisfaction score is 8 in both cohorts and at all ages. Just under 10% of BCS respondents reported being completely satisfied and around 5% dissatisfied (which we define as scores from 0 to 3). Average life satisfaction rises slightly from 26 to 34 and then falls from 34 to 42, but these movements are not statistically significant. Life satisfaction in early and middle adulthood is also flat in the NCDS.6 Average NCDS life satisfaction does fall slightly in the later waves (i.e. at older ages)7 but remains between seven and eight.
We estimate four specifications of the relationship between childhood variables and adult wellbeing. The first, simplest, one considers the direct relationship between childhood variables and adult subjective well-being:
𝐿𝑆𝑖.𝑡+𝑠= 𝛼1+ 𝛽𝐹𝐹𝐴𝑀𝐼𝐿𝑌𝑖,𝑡+ 𝛽𝐶𝐶𝐻𝐼𝐿𝐷𝑖,𝑡+ 𝜀𝑖,𝑡+𝑠 (1)
where 𝐿𝑆𝑖.𝑡+𝑠 refers to the reported life satisfaction of individual i at period s after the childhood period of t. 𝐹𝐴𝑀𝐼𝐿𝑌𝑖,𝑡 and 𝐶𝐻𝐼𝐿𝐷𝑖,𝑡 are vectors of family-background and childhood characteristics respectively (and so are measured at time t). If the error term 𝜀𝑖𝑡+𝑠 is orthogonal to 𝐹𝐴𝑀𝐼𝐿𝑌𝑖,𝑡 and 𝐶𝐻𝐼𝐿𝐷𝑖,𝑡 then the estimated values of 𝛽𝐹 and 𝛽𝐶 will show us how family and childhood circumstances affect adult life satisfaction. Identification in equation (1) comes from between-person variation in the childhood and family variables.
We carry out this analysis for each of the different adult ages at which we have life -satisfaction information (26, 30, 34 and 42 for the BCS; 33, 42, and 50 for the NCDS). This allows us to test whether
6 In the 2008 sweep, 7.8% of respondents were completely satisfied and 4% dissatisfied with their lives. 7 This fall is significant at the ten per cent level, but not at the five per cent level.
7
the estimated coefficients 𝛽𝐹 and 𝛽𝐶 in equation (1) are stable over different adult ages. We use balanced samples of respondents, so that the comparison across adult ages will always be carried out for the same individuals.8 This produces balanced observations on 5,046 individuals in the BCS and 6,875 individuals in the NCDS. The summary statistics for the balanced sample appear in Appendix Table A1, and can be compared to those for the full sample in Table 1. In the NCDS, the individuals in the balanced sample are similar to those in the full sample with respect to many characteristics. Nevertheless, household income and the measure of intact families (both natural parents living in the household) are both higher in the balanced sample. The differences between the balanced and full sample in the BCS seem smaller. In both datasets, the child outcomes in the balanced sample reveal somewhat better intellectual performance, but similar levels of childhood emotional health and conduct.
We have a number of variables that characterise childhood and the family environment, and we may worry about multi-collinearity. We circumvent this problem by following the approach in Layard et al. (2014), where the childhood and family variables are aggregated into five composite indicators: family economic, family psychosocial, emotional health, good conduct and intellectual performance (see Layard et al., 2014, for a detailed description of the method used, and Appendix B for more details).9 10
The second regression asks to what extent the direct effects of family and childhood identified in equation (1) are mediated by adult outcomes. We thus extend equation (1) to include seven contemporaneous objective adult outcomes (education, income, labour-force status, marital status, emotional health, physical health, and good conduct). Equation (2) then describes the production technology of life satisfaction, as a function of current adult achievements and childhood background. We again estimate this equation at a number of different ages, to see how this production technology changes at different respondent ages. The analysis of BCS data at age 34 in Layard et al. (2014) revealed adult emotional health to be the dominant factor: equation (2) will check whether this is the case at all adult ages.
𝐿𝑆𝑖,𝑡+𝑠= 𝛼2+ 𝛾𝐹𝐹𝐴𝑀𝐼𝐿𝑌𝑖𝑡+ 𝛾𝐶𝐶𝐻𝐼𝐿𝐷𝑖𝑡+ 𝛾𝐴𝐴𝐷𝑈𝐿𝑇𝑖,𝑡+𝑠+ 𝜖𝑖,𝑡+𝑠 (2) The specification of equation (2) assumes that current adult outcomes (𝐴𝐷𝑈𝐿𝑇𝑖,𝑡+𝑠) reflect all
adult-life outcomes that matter. We may alternatively consider that some types of adult-life-course transitions continue to matter in their own right, even conditional on the final adult outcomes at period t+s. In
8 Note that both BCS and NCDS face issues of attrition as their samples become older.
9 In Layard et al. (2014) (Figure 3), skills during childhood are calculated as a weighted sum over three childhood periods (aged 5, 10 and 16). Family background variables include family economic (father’s social class, family income, family size, father’s employment and parents’ education attainment) and family psycho-social conditions. Lekfuangfu and Lordan (2015) consider the effect of childhood on later cognitive skills, and put the childhood variables into five age categories instead of summing them from ages 0 to 16.
8
particular, Switek (2013) emphasises the importance of transitions between the ages of 16 and the 20s to early 30s in defining the later adult.
Our third regression then adds a set of life-transition variables up to a time s’ after childhood to the mediated analysis in equation (2). Note that the definition of success during young adulthood may differ from that at other ages. Adults in their 40s are considered successful if they are married with children, but this is not necessarily the case for teens or those in their early 20s (Marini, 1984; Hogan and Aston, 1986; and Billari, 2001). Our young-adult success transitions (𝑇𝑅𝐴𝑁𝑖,𝑡+𝑠′) include that from school to work (age left full-time education, and the characteristics of the first job), partnership (early marital breakdown), parenthood (early parenthood and lone parenthood), and independence (age left home).
𝐿𝑆𝑖,𝑡+𝑠= 𝛼3+ 𝛿𝐹𝐹𝐴𝑀𝐼𝐿𝑌𝑖𝑡+ 𝛿𝐶𝐶𝐻𝐼𝐿𝐷𝑖𝑡+ 𝛿𝐴𝐴𝐷𝑈𝐿𝑇𝑖,𝑡+𝑠+ 𝛿𝑅𝑇𝑅𝐴𝑁𝑖,𝑡+𝑠′+ 𝜏𝑖,𝑡+𝑠 (3) Last, we directly estimate the indirect effect of childhood circumstances by seeing how they are related to both adult outcomes and younger-adult transition variables. The equations are as follows:
𝐴𝐷𝑈𝐿𝑇𝑖,𝑡+𝑠= 𝜃𝐴 + 𝜋𝐹𝐹𝐴𝑀𝐼𝐿𝑌𝑖𝑡+ 𝜋𝐶𝐶𝐻𝐼𝐿𝐷𝑖𝑡+ 𝜐𝑖,𝑡+𝑠 (4.1) 𝑇𝑅𝐴𝑁𝑖,𝑡+𝑠′= 𝜃𝑅+ 𝜌𝐹𝐹𝐴𝑀𝐼𝐿𝑌𝑖𝑡+ 𝜌𝐶𝐶𝐻𝐼𝐿𝐷𝑖𝑡+ 𝜔𝑖,𝑡+𝑠′ (4.2)
In equation (3), 𝛿𝐹 and 𝛿𝐶 denote the direct effects of family and childhood background on adult life satisfaction, conditional on adult outcomes and transitions. The indirect effects of these variables via adult outcomes are then 𝛿𝐴∗ 𝜋𝐹 and 𝛿𝐴∗ 𝜋𝐶. Analogously, the indirect effects via the early-life transitions 𝑇𝑅𝐴𝑁𝑖,𝑡+𝑠′ are 𝛿𝑅∗ 𝜌𝐹 and 𝛿𝑅∗ 𝜌𝐶.
The variables in all regressions are coded so that higher numbers represent more positive outcomes. All variables, including the composite variables (for family background and childhood), are standardised, with means of 0 and standard deviations of 1.
4. The impact of family background and childhood on adult life satisfaction 4.1. Baseline results
Table 2 shows the results from the estimation of equation (1) at a number of different ages, t+s (26, 30, 34 and 42 for the BCS in the top panel, and 33, 42 and 50 for the NCDS in the bottom panel). In the BCS, the childhood family economic, family psychosocial, emotional health, good conduct and intellectual performance variables are all significant predictors of adult life satisfaction at all four adult ages. The same holds in the NCDS, apart for childhood conduct.
The last column of Table 2 estimates the average adult life satisfaction score over all available years. Childhood emotional health is the strongest predictor of adult life satisfaction in both the BCS and the
9
NCDS (at around 0.2 - 0.3 of a standard deviation). Childhood conduct is second in the BCS, followed by all of the other three background variables (family economic, family psychosocial and intellectual performance), which have similar effect sizes. In the NCDS, it is rather intellectual performance that is in second place, followed by family economic and family psychosocial tied in third place, with childhood conduct being insignificant. There has thus been a notable evolution in the role of child conduct between the two cohort sweeps. For the 1958 cohort, conduct was unimportant, with intellectual performance taking second place only to emotional health in determining adult well-being. Twelve years later, in the BCS cohort, good conduct as a child was just behind emotional health as a determinant of adult life satisfaction; intellectual performance remained significant but was now less important than child behaviour.
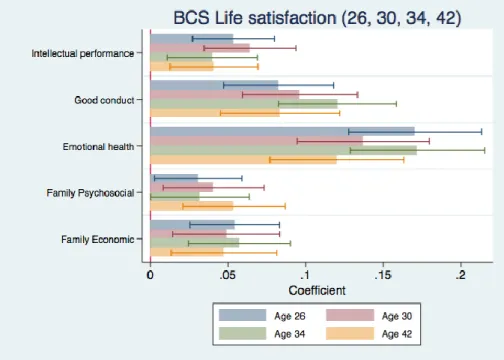
We can also read Table 2 horizontally, instead of vertically, to see how these regression coefficients change at different adult ages; these estimated coefficients are depicted visually in Figures 2A and 2B for the BCS and the NCDS respectively. Overall, the results suggest that the link between childhood characteristics and adult wellbeing is remarkably stable, and we find no evidence that influence of childhood experiences on adult life satisfaction fades away as the years go by.
Note that the R-squareds are around 4% in all of the BCS sweeps. Hence, without controlling for other adult outcomes, childhood and family characteristics account for 4% of the between-person variation in adult life-satisfaction from ages 26 to 42. The explanatory power is smaller in the NCDS (at 3%).
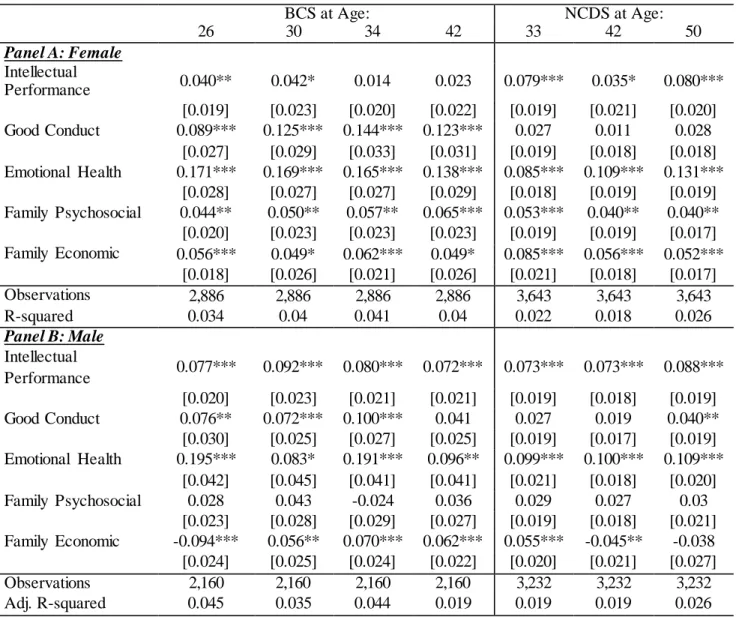
Table 3 asks whether the effects of childhood and family background on adult life satisfaction differ by gender. In both the NDCS and the BCS, family psychosocial matters more for female than for male life satisfaction. On the contrary, the effect of child intellectual performance is larger for men than for women in the BCS. Overall, the gender differences here are not particularly striking.
4.2. Adding contemporaneous adult outcomes
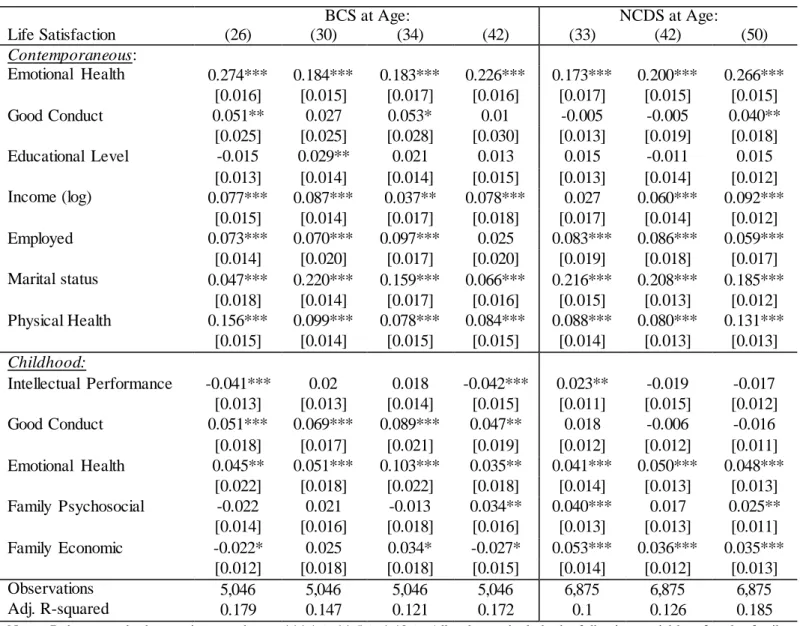
We now add the proximal adult outcomes to the specification in Table 2 above. The coefficients 𝛾𝐹 and 𝛾𝐶 in equation (2) reveal the residual influence of the family and childhood variables respectively on adult life satisfaction, independent of the effect that they may have on the seven adult outcomes that we consider. Table 4 shows the results from the BCS (in columns 1-4) and the NCDS (columns 5-7). Adult emotional health exhibits the strongest correlation with life satisfaction across all ages and in both cohorts (with an effect of around 0.2 to 0.3 standard deviations). Contemporaneous marital status and physical health are also consistently correlated with life satisfaction. The correlations with labour-force status and log income are almost as consistent, but are smaller in size. Last, most of the correlations with contemporaneous education and conduct are insignificant.
10
Controlling for adult outcomes for the most part (unsurprisingly) reduces the estimated coefficients on the childhood variables: part of the effect of family and childhood works through the adult outcomes. The coefficients on child emotional health fall substantially in both the BCS and the NCDS (but remain significant), while those on intellectual performance are now small or zero. Childhood conduct remains an important determinant of adult life satisfaction in the BCS, even conditional on adult outcomes, but not in the NCDS.
4.3. Adding young adulthood life transitions
We here turn to a potentially independent role for life transitions in early adulthood, conditional on the final adult outcomes that are observed contemporaneously with life satisfaction: this is the specification in equation (3) above. The life transitions we consider here are early parenthood, lone parenthood, the age at which the individual left full-time education, the first job being full-time, early marital breakdown and the age at which the individual left home.
Table 5 shows the results when we include these young adult transition variables in addition to the adult outcomes and child and family background variables that already appeared in Table 4. A number of these transitions are significant predictors of adult life satisfaction, even controlling for contemporaneous adult outcomes. In particular, early lone parenthood and marital breakdown continue to cast a shadow on life satisfaction many years later in both datasets: the effect here is found for life satisfaction at younger adult ages. Perhaps more interestingly, the introduction of these transition variables has very little effect on the estimated coefficients on the childhood variables, which are very similar to those in Table 4.
5. The indirect effects of childhood 5.1. Via contemporaneous adult outcomes
The estimated coefficients on the family and childhood variables in Table 2 were reduced in size with the introduction of contemporaneous adult outcomes into the life-satisfaction regressions in Table 4 and of young adult transitions in Table 5. We thus suspect that the family and childhood variables themselves should help predict both the young adult transitions and the adult outcomes. We check for this mediation via contemporaneous adult outcomes by estimating equation (4.1) and that via young adult transitions by estimating equation (4.2).
The comparison of the BCS childhood determinants of well-being in Tables 2 and 4 reveals that almost all of the effect of childhood intellectual performance works via adult outcomes, with analogous
11
figures of over one half for childhood emotional health and one quarter to one half for childhood behaviour. The mediation in the NCDS is of similar size.
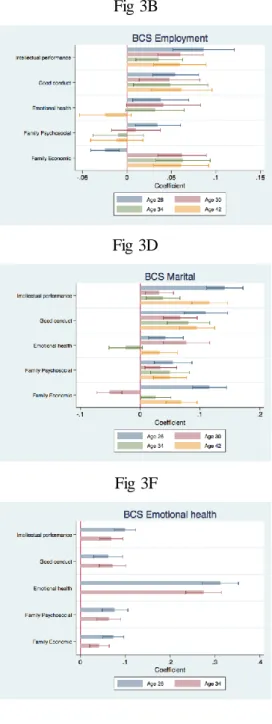
Figures 3A-3G and 4A-4G plot the effect of each of our five family and childhood composite variables on the seven contemporaneous adult outcomes in the BCS and the NCDS, respectively. The bars on the Y-axis depict the estimated coefficients at the different adult ages, with the associated 95% confidence intervals.
In the NCDS data, childhood intellectual performance is an important predictor of practically all adult outcomes, and is the largest predictor of adult income, employment and education. Remarkably, it is also just as important as childhood emotional health in predicting adult physical and emotional health. Childhood behaviour also has quite consistent effects on adult outcomes, but with an effect size that is much smaller. Childhood emotional health predicts the “social” outcomes of adult marital status, and physical and mental health. Family psychosocial background is correlated with adult marital status and good conduct. Last, the effect of family economic background is much like that of childhood intellectual performance, but of smaller size.11
The results in the more recent BCS data are to some extent similar. However, although childhood intellectual performance continues to be an important predictor of practically all adult outcomes, its role in predicting adult physical and emotional health is now much reduced compared to that of childhood emotional health. Childhood behaviour in the BCS predicts every adult outcome, and with an effect size that is notably larger than that in the NCDS cohort twelve years earlier. Last, the effect of family economic background seems more pronounced in the BCS than in the NCDS cohort.
5.2. Through young adult transitions
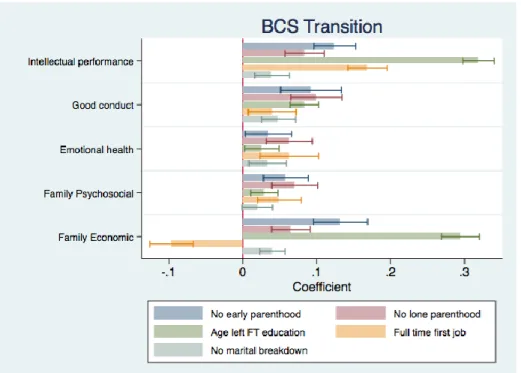
We now turn to mediation effects via the young adult transitions in Table 5. The results are shown in Figures 5A and 5B for the BCS and NCDS respectively. Unsurprisingly, childhood intellectual performance is the best predictor of age left full-time education in both datasets, and is in general a very consistent predictor of all young adult transitions. Childhood behaviour is also a consistent predictor of transitions, with an effect size that is notably larger in the (more recent) BCS than the NCDS. Childhood emotional health is not a strong predictor of transitions.
The comparison of the estimated coefficients on family and childhood background in Tables 4 and 5 however reveal that the inclusion of these young adult transitions does not change our broad conclusions regarding the mediating effect of adult outcomes in Section 5.1 above.
11 Apart from a striking negative correlation with adult marital status, at least in earlier adult years , this probably reflects later marriage by those with more advantaged backgrounds.
12 6. Conclusions
There is now increasing interest in not only the contemporaneous correlates of subjective well-being, but also the distal correlates. We here use two UK birth cohorts, the 1958 NCDS and the 1970 BCS to show how family background and childhood variables are related to life satisfaction measured at a variety of adult ages.
There are first a number of similar findings across the two cohorts. Perhaps the most important one is that there is little evidence that the distal determinants of adult well-being change over time: the childhood factors that predict life satisfaction in the 20s predict it just as well in the 40s and beyond. The effect of childhood and family does not then fade away over time. In both cohort datasets, it is childhood emotional health that is the strongest predictor of adult life satisfaction.
The predictors of adult life satisfaction are not entirely the same in the BCS and NCDS, however. In particular, the role of childhood intellectual performance is weaker in the later cohort, while the effect of childhood behaviour is stronger (childhood behaviour is not significantly correlated with adult life satisfaction in the NCDS).
When we add adult outcomes, we find that adult emotional health has the largest correlation with adult life satisfaction at all ages in both datasets, but there is little independent role for education. There are again some notable differences: family is more important in the NCDS than in the BCS (although the family effect is notably larger in the latter for respondents in their 30s). Physical health is less important in general in the NCDS, but its coefficient does increase sharply for the respondents at age 50.
The adult outcomes mediate the effect of childhood. Almost all of the effect of childhood intellectual performance works via these adult outcomes, and over half that of childhood emotional health. The figure for childhood behaviour is smaller.
Our results underline the importance of emotional health, both in adulthood and childhood, in determining adult life satisfaction. More broadly, they show that interventions that affect adult outcomes, given childhood and family background, can improve adult well-being, and so can interventions that target the childhood outcomes themselves. There is thus a role for policy all through the lifetime.
The correlations that we find here are similar for our two UK cohorts. But we still only know how to predict the life satisfaction of middle-aged British respondents. That the correlations are similar over adult ages is a useful finding, but one that we would like to extend to older ages. Equally, these results refer to only one country, and their replication elsewhere is part of a current broad international effort to use cohort datasets to inform policy about the causes of well-being throughout life.
13 References
Ahlburg, D. (1998) Intergeneration transmission of health. American Economic Review, Papers and
Proceedings, 88, 265-270.
Billari, F.C. (2001). The Analysis of Early Life courses: Complex Descriptions of the Transition to Adulthood. Journal of Population Research, 18, 119-142.
Black, S. E., Devereux, P. J., & Salvanes, K. G. (2007). From the cradle to the labor market? The effect of birth weight on adult outcomes. The Quarterly Journal of Economics, 122(1), 409-439.
Blanden, J., Gregg, P. and Macmillan, L. (2007). Explaining intergenerational income persistence: Non-cognitive skills, ability and education. Economic Journal, 117, 43-60.
Case, A., Fertig, A. and Paxson, C. (2005). The lasting impact of childhood health and circumstance.
Journal of Health Economics, 24, 365-89.
Conti, G. and Heckman, J. (2014). Economics of child well-being, in Ben-Arieh, A., Casas, F., Frønes, I., Korbin, J.E. (Eds.), Handbook of Child Wellbeing, Springer Netherlands, pp. 363-401.
Contoyannis, P. and Dooley, M. (2010). The role of child health and economic status in educational, health and labor market outcomes in young adulthood. Canadian Journal of Economics, 43, 323-346.
Cunha, F. and Heckman, J. (2007). The Technology of Skill Formation. American Economic Review, 97, 31-47.
Cunha, F. and Heckman, J. (2008). Formulating, identifying and estimating the technology of cognitive and noncognitive skill formation. Journal of Human Resources, 43, 738-782.
Cunha, F., Heckman, J. and Schennach, S. (2010). Estimating the technology of cognitive and noncognitive skill formation. Econometrica, 78, 883-931.
Currie, J. (2009). Healthy, wealthy and wise: Socioeconomic status, poor health in childhood, and human capital development. Journal of Economic Literature, 47, 87-122.
Currie J. (2011). Inequality at birth: Some cases and consequences. American Economic Review, 101, 1-22.
Currie, J. and Thomas, D. (1995). Does Head Start make a difference? American Economic Review, 85. 341-364.
Currie, J. and Thomas. D. (1999). Does head start help Hispanic children? Journal of Public Economics, 74, 235-262.
Currie, J., Stabile, M., Manivong, P. and Roos, L. (2010). Child health and young adult outcomes.
Journal of Human Resources, 45, 517-548.
Currie, J. and Almond, D. (2011). Human capital development before age five. Handbook of Labor
Economics, 4, 1315-1486.
Frijters, P., Hatton, T. and Shields, M.A. (2010). Childhood economic conditions and length of life: Evidence from the UK Boyd Orr Cohort, 1937-2005. Journal of Health Economics, 29, 39-47.
Frijters, P., Johnston, D.W. and Shields, M.A. (2014). Does childhood predict adult life satisfaction? Evidence from British Cohort Surveys, Economic Journal, 124, 688-719.
Frijters, P., and Beatton, T. (2012). The mystery of the U-shaped relationship between happiness and age. Journal of Economic Behavior & Organization , 82, 525-542.
14
García, J. L., Heckman, J. J., Leaf, D. E., & Prados, M. J. (2016). The life-cycle benefits of an influential
early childhood program, NBER Working Paper, Number 22993.
Goodman, A., Joyce, R. and Smith, J.P. (2011). The long shadow cast by childhood physical and mental problems on adult life. Proceedings of the National Academy of Sciences, 108, 6032-37.
Grossman, M. (1972). On the concept of health capital and the demand for health. Journal of Political
Economy, 80, 223-255.
Heckman, J. and Kautz, T. (2014). Fostering and measuring skills interventions that improve character and cognition. In J. J. Heckman, J. E. Humphries, and T. Kautz (Eds.), The GED Myth: Education,
Achievement Tests, and the Role of Character in American Life, Chicago, IL: University of Chicago
Press, Chapter 9.
Heckman, J., Moon, S., Pinto, R. Savelyev, P. and Yavitz, A. (2010). The rate of return to the HighScope Perry Preschool Program. Journal of Public Economics, 94, 114–128.
Heckman, J. and Mosso, S. (2014). The Economics of Human Development and Social Mobility.
Annual Review of Economics, 6, 689-733.
Heckman, J. and Rubenstein, Y. (2001). The Importance of Non-cognitive Skills: Lessons from GED Testing Program. American Economic Review, 91, 145-149.
Hogan, D. and Aston, N. (1986). The Transition to Adulthood. Annual Review of Sociology, 12, 109-130.
Huggett, M., Ventura, G., & Yaron, A. (2011). Sources of lifetime inequality. American Economic
Review, 101(7), 2923-2954.
Layard, R., Clark, A., Cornaglia, F, Powdthavee, N. and Vernoit, J. (2014). What predicts a successful life? A life-course model of wellbeing. Economic Journal, 124, 720-738.
Lekfuangfu, W. and Lordan, G. (2015) Long or short arm? Childhood characteristics and human capital accumulation, LSE mimeo.
Marini, M. (1984). The order of events in the transition to adulthood. Sociology of Education, 57, 63-64.
McLeod, J. and Kaiser, K. (2004). Childhood emotional and behavioural problems and educational attainment. American Sociological Review, 69, 636-58.
Mensah, F.K. and Hobcraft, J. (2008). Childhood deprivation, health and development: Associations with adult health in the 1958 and 1970 British prospective birth cohort studies. Journal of
Epidemiology and Community Health, 62, 599-606.
Oreopoulos, P. and Salvanes, K. (2011). Priceless: The nonpecuniary benefits of schooling. The Journal
of Economic Perspectives, 25, 159-184.
Powdthavee, N., Lekfuangfu, W. N., and Wooden, M. (2015). What's the good of education on our overall quality of life? A simultaneous equation model of education and life satisfaction for Australia. Journal of Behavioral and Experimental Economics, 54, 10-21.
Salm, D. and Schunk, D. (2011). The relationship between child health, development gaps, and parental education: Evidence from administrative data. Journal of the European Economic Association, 10, 1425–1449.
Smith, J. (2009). The impact of childhood health on adult labor market outcomes. Review of Economics
15
Switek, M. (2013). Explaining Wellbeing over the life cycle: A look at life transitions during young adulthood. IZA Discussion Paper No. 7877.
Todd, P. and Wolpin, K. (2003). On the specification and estimation of the production function for cognitive achievement. Economic Journal, 113, 3-33.
Todd, P. and Wolpin, K. (2007). The production of cognitive achievement in children: Home, School and Racial Test Score gaps. Journal of Human Capital, 1, 91-136.
16
Figures
Figure 1A and 1B: The distribution of life satisfaction by age in the BCS and NCDS Figure 1A: BCS at ages 26, 30, 34 and 42
Figure 1B: NCDS at ages 33, 42 and 50
Note: The vertical lines refer to mean life satisfaction by age.
0 .0 5 .1 .1 5 .2 .2 5 D e n si ty 0 2 4 6 8 10 Age 42 Age 34 Age 30 Age 26 Life satisfaction (BCS) 0 .0 5 .1 .1 5 .2 .2 5 D e n si ty 0 2 4 6 8 10 Age 50 Age 42 Age 33
Life satisfaction (NCDS)
17
Figures 2A and 2B: The predictors of adult-life satisfaction at different ages. Balanced sample (BCS and NCDS)
Figure 2A: BCS
Figure 2B: NCDS
Note: The bars on the Y-axis depict the estimated coefficients from each of the life satisfaction equations at the different adult ages, with the associated 95% confidence intervals shown as the horizontal line.
18
Figure 3A-3G: Predictors of adult outcomes at different ages. (BCS - Balanced sample)
Fig 3A Fig 3B
Fig 3C Fig 3D
Fig 3E Fig 3F
Fig 3G
19
Figure 4A-4G: Predictors of adult outcomes at different ages. (NCDS - Balanced sample)
Fig 4A Fig 4B
Fig 4C Fig 4D
Fig 4E Fig 4F
Fig 4G
20
Figure 5: Predictors of young adult transitions (BCS and NCDS)
Figure 5A: BCS (Balanced)
Figure 5B: NCDS (Balanced)
21
Tables
Table 1: Descriptive statistics for life satisfaction and childhood variables
BCS NCDS
Variables No. obs Mean SD No. obs Mean SD
Life satisfaction at 26 (BCS) 8,250 7.16 1.958 NA NA NA
Life satisfaction at 30 (BCS) 10,251 7.29 1.84 NA NA NA
Life satisfaction at 33 (BCS), 33 (NCDS) 8,869 7.41 1.79 10,629 7.42 1.72 Life satisfaction at 42 (BCS), 42 (NCDS) 8,943 7.36 1.99 11,269 7.29 1.92
Life satisfaction at 50 (NCDS) NA NA NA 9,632 7.29 1.85
Social class of the father (5 categories) 11,390 2.55 1.25 9,323 2.24 1.25
Log of family weekly income 11,676 4.74 0.52 7,376 1.60 1.83
Total number of siblings 16,362 1.75 1.36 17,415 2.25 1.51
Average employment rate of father 9,760 0.95 0.14 17,825 0.69 0.42
Age mother left full-time education 17,128 15.55 2.11 16,114 15.82 0.41 Age father left full-time education 16,669 15.74 2.31 15,424 16.34 1.52
Mother’s average mental health 10,873 0.78 0.13 NA NA NA
Post-marital conception 16,827 0.91 0.27 18,558 0.96 0.19
Both natural parents live in household 8,398 0.84 0.36 18,558 0.66 0.26 Emotional health at 5 (BCS), 7 (NCDS) 12,743 0.62 0.13 14,632 0.82 0.12 Emotional health at 10 (BCS), 11 (NCDS) 12,681 0.6 0.12 13,819 0.81 0.13 Emotional health at 16 4,101 0.74 0.11 14,653 0.92 0.09 Good conduct at 5 (BCS), 7 (NCDS) 12,654 0.79 0.16 14,608 0.75 0.18 Good conduct at 10 (BCS), 11 (NCDS) 12,581 0.79 0.13 13,805 0.76 0.18 Good conduct at 16 8,172 0.91 0.16 11,653 0.90 0.13 Intellect at 5 (BCS), 7 (NCDS) 12,641 0.58 0.24 15,028 0.58 0.15 Intellect at 10 (BCS), 11 (NCDS) 11,551 0.59 0.12 14,134 0.53 0.16 Intellect at 16 8,303 0.71 0.45 12,705 0.51 0.25
22
Table 2: The family and childhood predictors of adult life -satisfaction at different ages (balanced sample)
Life Satisfaction at Age:
BCS 26 30 34 42 Average Intellectual Performance [5 10 16] 0.054*** 0.064*** 0.040*** 0.041*** 0.092*** [0.013] [0.015] [0.015] [0.014] [0.021] Good Conduct [5 10 16] 0.083*** 0.096*** 0.121*** 0.084*** 0.190*** [0.018] [0.019] [0.019] [0.020] [0.028] Emotional Health [5 10 16] 0.170*** 0.137*** 0.172*** 0.120*** 0.298*** [0.022] [0.022] [0.022] [0.022] [0.032] Family Psychosocial [5 10 16] 0.031** 0.041** 0.032** 0.054*** 0.074*** [0.014] [0.017] [0.016] [0.017] [0.024] Family Economic [5 10 16] 0.055*** 0.049*** 0.058*** 0.048*** 0.098*** [0.015] [0.018] [0.017] [0.017] [0.025] Observations 5,046 5,046 5,046 5,046 5,046 R-squared 0.039 0.035 0.040 0.028 0.061 NCDS 33 42 50 Average Intellectual Performance [7 11 16] 0.072*** 0.053*** 0.083*** 0.124*** [0.014] [0.014] [0.014] [0.020] Good Conduct [7 11 16] 0.025* 0.009 0.025** 0.028 [0.014] [0.012] [0.013] [0.020] Emotional Health [7 11 16] 0.088*** 0.103*** 0.116*** 0.182*** [0.014] [0.013] [0.014] [0.020] Family Psychosocial [7 11 16] 0.044*** 0.035*** 0.034*** 0.067*** [0.013] [0.013] [0.013] [0.018] Family Economic [7 11 16] 0.066*** 0.045*** 0.045*** 0.080*** [0.014] [0.013] [0.014] [0.019] Observations 6,875 6,875 6,875 6,875 Adj. R-squared 0.019 0.018 0.024 0.033
Notes: Robust standard errors in parentheses. *** 1%, ** 5%, * 10%. All columns include the following variables: female, family economic, family psychosocial, emotional health, good conduct and intellectual performance, measured during childhood. For the BCS, childhood ages are 5, 10 and 16; for the NCDS they are 7, 11 and 16. All continuous variables are standardised. In the last column, average life satisfaction is calculated as the sample mean of life satisfaction across ages for each cohort.
23
Table 3: BCS and NCDS results by gender
BCS at Age: NCDS at Age: 26 30 34 42 33 42 50 Panel A: Female Intellectual Performance 0.040** 0.042* 0.014 0.023 0.079*** 0.035* 0.080*** [0.019] [0.023] [0.020] [0.022] [0.019] [0.021] [0.020] Good Conduct 0.089*** 0.125*** 0.144*** 0.123*** 0.027 0.011 0.028 [0.027] [0.029] [0.033] [0.031] [0.019] [0.018] [0.018] Emotional Health 0.171*** 0.169*** 0.165*** 0.138*** 0.085*** 0.109*** 0.131*** [0.028] [0.027] [0.027] [0.029] [0.018] [0.019] [0.019] Family Psychosocial 0.044** 0.050** 0.057** 0.065*** 0.053*** 0.040** 0.040** [0.020] [0.023] [0.023] [0.023] [0.019] [0.019] [0.017] Family Economic 0.056*** 0.049* 0.062*** 0.049* 0.085*** 0.056*** 0.052*** [0.018] [0.026] [0.021] [0.026] [0.021] [0.018] [0.017] Observations 2,886 2,886 2,886 2,886 3,643 3,643 3,643 R-squared 0.034 0.04 0.041 0.04 0.022 0.018 0.026 Panel B: Male Intellectual Performance 0.077*** 0.092*** 0.080*** 0.072*** 0.073*** 0.073*** 0.088*** [0.020] [0.023] [0.021] [0.021] [0.019] [0.018] [0.019] Good Conduct 0.076** 0.072*** 0.100*** 0.041 0.027 0.019 0.040** [0.030] [0.025] [0.027] [0.025] [0.019] [0.017] [0.019] Emotional Health 0.195*** 0.083* 0.191*** 0.096** 0.099*** 0.100*** 0.109*** [0.042] [0.045] [0.041] [0.041] [0.021] [0.018] [0.020] Family Psychosocial 0.028 0.043 -0.024 0.036 0.029 0.027 0.03 [0.023] [0.028] [0.029] [0.027] [0.019] [0.018] [0.021] Family Economic -0.094*** 0.056** 0.070*** 0.062*** 0.055*** -0.045** -0.038 [0.024] [0.025] [0.024] [0.022] [0.020] [0.021] [0.027] Observations 2,160 2,160 2,160 2,160 3,232 3,232 3,232 Adj. R-squared 0.045 0.035 0.044 0.019 0.019 0.019 0.026
Notes: Robust standard errors are in parentheses. *** 1%, ** 5%, * 10%. All columns include the following variables: female, family economic, family psychosocial, emotional health, good conduct and intellectual performance, measured during childhood. For the BCS, childhood ages are 5, 10 and 16. For the NCDS, the ages are 7, 11 and 16. All continuous variables are standardised.
24
Table 4: The proximate and distal predictors of adult life -satisfaction
BCS at Age: NCDS at Age: Life Satisfaction (26) (30) (34) (42) (33) (42) (50) Contemporaneous: Emotional Health 0.274*** 0.184*** 0.183*** 0.226*** 0.173*** 0.200*** 0.266*** [0.016] [0.015] [0.017] [0.016] [0.017] [0.015] [0.015] Good Conduct 0.051** 0.027 0.053* 0.01 -0.005 -0.005 0.040** [0.025] [0.025] [0.028] [0.030] [0.013] [0.019] [0.018] Educational Level -0.015 0.029** 0.021 0.013 0.015 -0.011 0.015 [0.013] [0.014] [0.014] [0.015] [0.013] [0.014] [0.012] Income (log) 0.077*** 0.087*** 0.037** 0.078*** 0.027 0.060*** 0.092*** [0.015] [0.014] [0.017] [0.018] [0.017] [0.014] [0.012] Employed 0.073*** 0.070*** 0.097*** 0.025 0.083*** 0.086*** 0.059*** [0.014] [0.020] [0.017] [0.020] [0.019] [0.018] [0.017] Marital status 0.047*** 0.220*** 0.159*** 0.066*** 0.216*** 0.208*** 0.185*** [0.018] [0.014] [0.017] [0.016] [0.015] [0.013] [0.012] Physical Health 0.156*** 0.099*** 0.078*** 0.084*** 0.088*** 0.080*** 0.131*** [0.015] [0.014] [0.015] [0.015] [0.014] [0.013] [0.013] Childhood: Intellectual Performance -0.041*** 0.02 0.018 -0.042*** 0.023** -0.019 -0.017 [0.013] [0.013] [0.014] [0.015] [0.011] [0.015] [0.012] Good Conduct 0.051*** 0.069*** 0.089*** 0.047** 0.018 -0.006 -0.016 [0.018] [0.017] [0.021] [0.019] [0.012] [0.012] [0.011] Emotional Health 0.045** 0.051*** 0.103*** 0.035** 0.041*** 0.050*** 0.048*** [0.022] [0.018] [0.022] [0.018] [0.014] [0.013] [0.013] Family Psychosocial -0.022 0.021 -0.013 0.034** 0.040*** 0.017 0.025** [0.014] [0.016] [0.018] [0.016] [0.013] [0.013] [0.011] Family Economic -0.022* 0.025 0.034* -0.027* 0.053*** 0.036*** 0.035*** [0.012] [0.018] [0.018] [0.015] [0.014] [0.012] [0.013] Observations 5,046 5,046 5,046 5,046 6,875 6,875 6,875 Adj. R-squared 0.179 0.147 0.121 0.172 0.1 0.126 0.185
Notes: Robust standard errors in parentheses. *** 1%, ** 5%, * 10%. All columns include the following variables: female, family economic, family psychosocial, emotional health, good conduct and intellectual performance, measured during childhood. Adult emotional health and adult physical health are measured lagged by one surve y wave. For the BCS, the childhood ages are 5, 10 and 16; for the NCDS, they are 7, 11 and 16. All continuous variables are standardised.
25
Table 5: The proximate and distal predictors of adult life satisfaction, including young adult transitions Life Satisfaction BCS: at NCDS: at (26) (30) (34) (42) (33) (42) (50) Contemporaneous: Emotional Health 0.272*** 0.179*** 0.181*** 0.226*** 0.158*** 0.197*** 0.266*** [0.014] [0.015] [0.017] [0.016] [0.017] [0.015] [0.015] Good Conduct 0.048** 0.027 0.053* 0.007 -0.010 -0.005 0.038** [0.022] [0.025] [0.028] [0.030] [0.013] [0.019] [0.018] Educational Level 0.015 0.016 0.027 0.014 0.003 -0.019 0.017 [0.019] [0.019] [0.019] [0.019] [0.015] [0.016] [0.014] Income [log] 0.084*** 0.083*** 0.041** 0.074*** 0.032* 0.058*** 0.090*** [0.015] [0.014] [0.018] [0.018] [0.017] [0.014] [0.012] Employed 0.077*** 0.071*** 0.096*** 0.025 0.080*** 0.086*** 0.060*** [0.011] [0.020] [0.018] [0.019] [0.020] [0.018] [0.017] Marital Status 0.055*** 0.212*** 0.152*** 0.070*** 0.178*** 0.203*** 0.181*** [0.018] [0.015] [0.019] [0.016] [0.016] [0.013] [0.012] Physical Health 0.158*** 0.097*** 0.077*** 0.084*** 0.082*** 0.080*** 0.130*** [0.013] [0.014] [0.015] [0.015] [0.013] [0.013] [0.013] Transition: No early parenthood -0.01 0.033* 0.024 -0.014 0.000 -0.021 0.007 [0.016] [0.020] [0.018] [0.018] [0.015] [0.015] [0.014] No lone parenthood 0.042*** 0.046*** -0.002 -0.004 0.111*** 0.006 -0.007 [0.016] [0.017] [0.018] [0.016] [0.017] [0.013] [0.013]
Age left full-time education -0.025 0.000 -0.018 -0.004 0.004 0.024* -0.012
[0.017] [0.016] [0.015] [0.016] [0.013] [0.013] [0.012]
First full-time job -0.069*** 0.028 -0.004 0.034** -0.012 0.008 0.019
[0.015] [0.021] [0.018] [0.014] [0.016] [0.015] [0.014]
No marital breakdown -0.014 0.040*** 0.022* -0.017 0.100*** 0.027** 0.025**
[0.012] [0.013] [0.013] [0.012] [0.012] [0.011] [0.011]
Left home by aged 21 -0.013 -0.010 0.023**
[0.011] [0.011] [0.011] Childhood: Intellectual Performance -0.039*** 0.022 0.018 -0.041*** 0.016 -0.025 -0.015 [0.013] [0.014] [0.013] [0.015] [0.011] [0.016] [0.012] Good Conduct 0.047*** 0.062*** 0.086*** 0.049** -0.013 -0.007 -0.016 [0.016] [0.017] [0.021] [0.019] [0.011] [0.012] [0.011] Emotional Health 0.048** 0.049*** 0.102*** 0.035** 0.049*** 0.050*** 0.049*** [0.020] [0.018] [0.022] [0.017] [0.013] [0.013] [0.013] Family Psychosocial -0.027* 0.02 -0.012 0.036** 0.030** 0.016 0.024** [0.014] [0.016] [0.018] [0.016] [0.013] [0.013] [0.011] Family Economic 0.024* 0.023 0.032* -0.025 0.057*** 0.039*** 0.034*** [0.013] [0.017] [0.017] [0.015] [0.014] [0.013] [0.013] Observations 5,046 5,046 5,046 5,046 6,875 6,875 6,875 R-squared 0.193 0.152 0.122 0.173 0.130 0.127 0.185
26
Notes: Robust standard errors in parentheses. *** 1%, ** 5%, * 10%. All columns include the following variables: female, family economic, family psychosocial, emotional health, good conduct and intellectual performance, measured during childhood. Adult emotional health and adult physical health are lagged by one survey wave. In the BCS the childhood ages are 5, 10 and 16; in the NCDS, they are 7, 11 and 16. The dummy transition variables are “no early parenthood” for the individual not having children at age 21, “no lone parenthood” for not being single parent at age 21, “Full time first job” for the first job being full-time, “no marital breakdown” for not being separated or divorced at age 21, and “Left home by 21” for the individual living on his/her own at age 21. All continuous variables are standardised.
27 Appendix A
Table A1. Summary statistics (balanced sample with full information on life satisfaction)
BCS NCDS
Obs Mean SD Obs Mean SD
Life satisfaction at 26 (BCS) 5,046 7.301 1.83 NA NA NA
Life satisfaction at 30 (BCS) 5,046 7.4 1.7 NA NA NA
Life satisfaction at 33 (BCS), 33 (NCDS) 5,046 7.55 1.7 6,875 7.53 1.63 Life satisfaction at 42 (BCS), 42 (NCDS) 5,046 7.51 1.89 6,875 7.40 1.79
Life satisfaction at 50 (NCDS) NA NA NA 6,875 7.36 1.79
Social class of the father (5 categories) 4,176 2.77 1.25 4,297 2.36 1.26
Log of Family weekly income 4,178 4.81 0.5 2,410 2.62 1.72
Total number of siblings 4,798 1.63 1.13 6,549 2.15 1.39
Average employment rate of father 3,717 0.97 0.12 6,639 0.83 0.33
Age mother left full time education 5,041 15.8 2.07 6,019 15.78 0.43 Age father left full time education 5,000 15.95 2.36 6,355 16.39 1.60
Mother’s average mental health 4,033 0.81 0.12 NA NA NA
Post marital conception 4,972 0.93 0.26 6,875 0.97 0.16
Both natural parents live in household 3,468 0.87 0.33 6,875 0.73 0.23 Emotional health at 5 (BCS), 7 (NCDS) 4,434 0.63 0.13 6,114 0.82 0.12 Emotional health at 10 (BCS), 11 (NCDS) 4,550 0.6 0.12 5,978 0.82 0.13 Emotional health at 16 2,097 0.75 0.11 6,282 0.92 0.09 Good conduct at 5 (BCS), 7 (NCDS) 4,415 0.81 0.14 6,103 0.77 0.17 Good conduct at 10 (BCS), 11 (NCDS) 4,524 0.86 0.12 5,976 0.78 0.17 Good conduct at 16 3,444 0.93 0.13 5,281 0.92 0.11 Intellect at 5 (BCS), 7 (NCDS) 4,419 0.64 0.24 6,214 0.61 0.13 Intellect at 10 (BCS), 11 (NCDS) 4,093 0.63 0.11 6,030 0.56 0.15 Intellect at 16 5,046 0.76 0.43 5,536 0.57 0.23
28 Appendix B
Table B.1. Data description (outcome variables)
BCS (age) NCDS (age)
Adult Outcomes
Life satisfaction (0-10) 26, 30, 34, 42 33, 42, 50
Log household income (equivalised)
26, 30, 34, 42 33, 42, 50
Educational achievement 26, 30, 34, 42 33, 42, 50
Employed (whether not being unemployed)
26, 30, 34, 42 33, 42, 50
Good conduct (minus total times found guilty by a criminal court or formally cautioned at police station)
26, 30, 34 total 33, 42, 50
Has a partner 26, 30, 34, 42 33, 42, 50
Emotional health (reversed sum of Malaise score)
26, 30, 34 33, 42
Physical health (total score of self-rating items)
26, 30, 34 33, 46
Childhood Outcomes
Intellectual performance 5, 10, 16 average 7, 11, 16 average
(Age 5- Copying-Design) (Age 7- Southgate reading,
Copying-Design; Draw-a-Man, Problem Arithmetic)
(Age 10- British Ability Scales
score)
(Age 11- Reading, Math, General, Copying-Design)
(Age 16- Whether any GCSE
pass)
(Age 16- Reading, Math, Teacher's assessments) Good conduct (externalising
behaviour)
5, 10, 16 average 7, 11, 16 average
(Rutter Behaviour Scale:
Conduct and Hyperactivity)
(Rutter Behaviour Scale: Conduct and Hyperactivity) Emotional health
(internalising behaviour)
5, 10, 16 average 7, 11, 16 average
(Rutter Behaviour sub-scale:
Emotional and Peer Problem)
(Rutter Behaviour sub-scale: Emotional and Peer Problem)
29
Table B.2. Data description (childhood and transitional year variables)
BCS (age) NCDS (age)
Childhood: Family Economic
Father’s socio-economic group 10 16
Log of family weekly income 10 16
Total number of siblings 10 16
Average employment rate of father
0, 5, 10, 16 average 11, 16 average
Mother’s and father’s age on leaving full-time education
One answer during age 0, 5, 16
One answer during age 0, 7, 11, 16
Childhood: Family Psychosocial
Mother average mental health 0, 5, 10, 16 average NA
Whether post-marital conception 0 NA
Whether both natural parents live in household
16 7, 11, 16 average
Transition years
Whether early motherhood (pregnancy before 21)
26,30,34 (any) 23, 33 (any)
Whether have any period of lone parenthood
26,30,34 (any) 23, 33 (any)
Any marital breakdown (separated, divorced or widow) from 26 to 34
26,30,34 (any) 23, 33 (any)
Age left full time education Responded at age 30 Responded at age 33 Whether left home by aged 21 (no
longer live at parents' home)
Responded at age 26 Responded at age 33