HAL Id: hal-00730768
https://hal.inria.fr/hal-00730768
Submitted on 11 Sep 2012
HAL is a multi-disciplinary open access
archive for the deposit and dissemination of
sci-entific research documents, whether they are
pub-lished or not. The documents may come from
teaching and research institutions in France or
abroad, or from public or private research centers.
L’archive ouverte pluridisciplinaire HAL, est
destinée au dépôt et à la diffusion de documents
scientifiques de niveau recherche, publiés ou non,
émanant des établissements d’enseignement et de
recherche français ou étrangers, des laboratoires
publics ou privés.
Decoding Visual Percepts Induced by Word Reading
with fMRI
Alexandre Gramfort, Christophe Pallier, Gaël Varoquaux, Bertrand Thirion
To cite this version:
Alexandre Gramfort, Christophe Pallier, Gaël Varoquaux, Bertrand Thirion. Decoding Visual
Per-cepts Induced by Word Reading with fMRI. Pattern Recognition in NeuroImaging (PRNI), 2012
International Workshop on, Jul 2012, Londres, United Kingdom. pp.13-16, �10.1109/PRNI.2012.20�.
�hal-00730768�
Decoding Visual Percepts Induced by Word Reading with fMRI
Alexandre Gramfort1,3 Ga¨el Varoquaux1,3 Bertrand Thirion1,3
1Parietal Team
INRIA Saclay-ˆIle-de-France, France [email protected] Christophe Pallier2,3 2Inserm, U992 3Neurospin bˆat 145 CEA, DSV, I2BM Gif-Sur-Yvette, France
Abstract—Word reading involves multiple cognitive pro-cesses. To infer which word is being visualized, the brain first processes the visual percept, deciphers the letters, bigrams, and activates different words based on context or prior expectation like word frequency. In this contribution, we use supervised machine learning techniques to decode the first step of this processing stream using functional Magnetic Resonance Images (fMRI). We build a decoder that predicts the visual percept formed by four letter words, allowing us to identify words that were not present in the training data. To do so, we cast the learning problem as multiple classification problems after describing words with multiple binary attributes. This work goes beyond the identification or reconstruction of single letters or simple geometrical shapes [1], [2] and addresses a challenging estimation problem, that is the prediction of multiple variables from a single observation, hence facing the problem of learning multiple predictors from correlated inputs. Keywords-fMRI, supervised learning, decoding, word, read-ing, visual cortex, retinotopy
I. INTRODUCTION
Supervised learning can be used to predict from functional MRI (fMRI) volumes one or multiple variables describing a stimulus [3]. This procedure, often called decoding [4], is a key element in answering a question that naturally arises in fMRI studies of cognitive processes: given the observation of brain activity, what can be concluded about the mental state of the subject in a particular task [5]? Decoding methods have been extensively used to study the visual system, from texture orientation [4], to high-level object recognition [6]. However, to inform about the full visual processing stream, a decoding experiment must go beyond classifying objects in well-separated predefined categories or predicting shape regardless of content: it should capture the brain’s ability to represent rich stimuli. Written words are a typical case of such complex stimulus with high-level cognitive content [7]. Learning predictive models from fMRI is challenging because of the high dimensionality of the data, comprising tens of thousands of voxels and the limited number of measurements, seldom more than a few hundreds of fMRI volumes. When predicting complex objects like words, it is even more challenging as the prediction space is large: we would like to predict a word among thousands of
candidates, some of which have not been presented during the training sessions. This problem is also known as zero shot learning [8].
Reading involves various cognitive tasks, from the pro-cessing of the visual percept, assembling letters, bigrams then forming the word, and eventually disambiguating dif-ferent words based on context or prior expectation like word frequency [9]. A machine able to do a similar inference using fMRI data recorded while a subject reads the word should first capture the processing in the early visual areas. That is the problem addressed by this contribution using four letter words. Similar to what was done in [2], one needs to predict letters. However, as we aim at predicting words, the stimulus should contain multiple letters rather than random patterns as in [2]. To be able to predict unseen words, we propose a learning strategy that works with binary attributes as explained below.
Notations: We write vectors in bold, a ∈ Rn, matrices with capital bold letters, A ∈ Rn×n. We denote by kAkF = q
P i,ja
2
ij the `2 Frobenius norm of a matrix. II. THE DECODING OF VISUAL WORDS
We are interested in predicting words presented at fixed positions from fMRI volumes. Let us denote the target variable to be predicted as y ∈ Y and the data as x ∈ RP, where P is the number of voxels in the fMRI volume. Each x corresponds to one stimulus presentation. A training set with N volumes then forms a matrix X ∈ RN ×P.
Prediction in a space Y formed by words is challenging especially if one wants to be able to predict words not present in the training set. If one denotes the predictive function f : RP → Y, f is obtained by minimizing the empirical risk: min f 1 N N X i=1 L(yi, f (xi)) + λ Ω(f ), λ ≥ 0 (1)
where the parameter λ balances the data fit and the regular-ization Ω(f ). To go further we need a model for f and to define a loss function L.
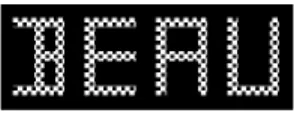
Figure 1. A four letter word as displayed on the screen during the experiment. Each letter is assembled from 12 lines (6 horizontal and 6 vertical).
To render the problem tractable we propose to describe a word by a set of binary attributes starting with visual descriptors. By displaying words as in Fig. 1, each letter is characterized by a set of lines. Discarding letters using diagonal lines (e.g. R), 12 lines suffice. The visual percept of a four letter word can then be described by 48 binary attributes. We thus cast the problem of word prediction as K = 48 binary classification problems with shared data. The space Y now equals {0, 1}K.
A natural idea is then to try to predict each binary variable independently, which boils down to minimizing a hamming loss which in practice can be achieved using a convex upper bound such as K independent hinge or logistic loss functions. If one denotes fk the function predicting for attribute k, 1 ≤ k ≤ K and if we further assume a linear model, as classically done with fMRI data, it leads to fk(x) = xTwk, which can be estimated with:
( ˆwk)k= argmin (wk) k 1 N N X i=1 K X k=1 L(yi, xT i w k)+λ Ω(W), λ ≥ 0 (2) where W ∈ RP ×K.
We use a logistic loss as in [10], [11] as it gives not only a prediction of which class an observation is associated with, but also a probability for the prediction. Given an fMRI volume, the predictive framework gives the probability of each attribute composing a word, p(yik|xi). By further assuming independence of each attribute, which is clearly a coarse model approximation, it leads to a probabilistic output for a full word y ∈ {0, 1}K:
p(y|xi) = K Y k=1
p(yki|xi) . (3)
This procedure provides a means to rank possible candidate words given the data. In order to go further and take into account the correlation structure between the different attributes, we also investigated a two-steps approach where a second logistic regression model was fitted on a new set of variable formed by XW ∈ RN ×K. This approach can be seen as a hierarchical decoder able to capture some cor-relation between attributes in order to obtain more reliable probability estimates in Eq. (3). Result with both models are detailed in the following section.
III. RESULTS
Before detailing results we present the experimental setup.
Paradigm: Each word was presented on the screen for 3 s at a flickering frequency of 15 Hz. A 5 s rest interval was inserted between each word presentation. The subject was asked to fixate a colored cross at the center of the screen. Each session comprised 46 words including 6 verbs. To ensure that subjects were reading, they were asked to report with a button press when a verb was presented on the screen. Repetitions corresponding to verbs were then removed from the analysis. Six sessions were recorded, leading to 240 different words used in the analysis. A partial retinotopic mapping using rotating wedges was performed to get a phase map able to delineate low level visual areas [12].
MRI acquisition: MRI data were recorded on 3 sub-jects with a 3 Tesla Siemens Magnetom TrioTim scanner. An echo-planar imaging (EPI) scan was used to acquire functional images over the entire occipital lobe and along the temporal lobe (TR, 2400 ms; TE, 30 ms; flip angle, 81◦; FOV, 192×192 mm; voxel size, 1.5×1.5×2 mm; 26 slices). Data preprocessing: Data were corrected for motion artifacts. Volumes were not normalized, although SPM8 was used to segment tissues on an anatomical T1 image and to compute a normalization transform. Using this normal-ization, the Harvard-Oxford (HO) probabilistic atlas was warped back into subject-space and used to restrict the analysis. Analysis was done in the Lateral Occipital Cortex superior division, Lateral Occipital Cortex inferior division, Supracalcarine Cortex and Occipital Pole. The analysis was then further restricted by intersecting the HO areas with the estimated mask of the gray matter (threshold at probability > 10%). This lead to analyses on approximately P = 35 000 voxels on average across subjects. Volumes were slightly smoothed (FWHM=3mm).
Data exploration with retinotopy and univariate statis-tics: Retinotopic mapping was computed for each subject on the volume. For visualization purposes the phase map was projected to the cortical mesh using FreeSurfer. The flattened portion of the occipital cortex for subject 3 is presented in Fig. 2. One can observe the primary visual cortices corresponding to the largest clusters of active vertices along the calcarine fissure.
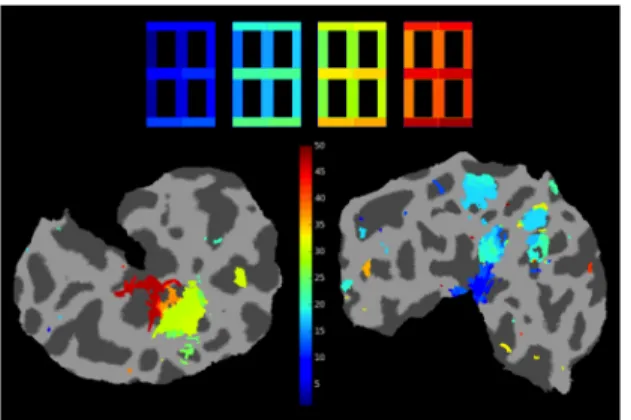
Supervised learning was performed on coefficients ob-tained by a standard GLM with one regressor per word presentation as well as regressors for motion and drifts with a cutoff frequency of 128 s. This resulted in one volume per word. Before running the decoding procedure, a T-test was used to detect the voxels capturing the effect of each attribute. By assigning to each voxel with a p-value below 0.001 for at least one attribute the index of the attribute leading to the smallest p-value, it is possible to map each voxel to one attribute, in the present case, one line among the 48 forming a word. Results are presented in Fig. 3. We observe activations mainly in V1 with the expected symmetry between left (resp. right) visual field and right (resp. left) hemisphere. This procedure recovers the
retino-Figure 2. Retinotopic phase maps of subject 3 projected onto the flattened cortical mantel of the occipital lobe (left and right hemispheres). The cut in the mantel corresponds the calcarine fissure along the medial wall. The colormap represent the polar angle of the visual field, shifted by −π/2 and constrained to the [−π, π] interval.
Figure 3. The 48 visual bars displayed with a color code (blue to red from left to right) with corresponding voxels yielding the maximum responses (threshold on T-test p < 0.001). Results were projected on the flattened cortical mantel around the calcarine fissure (left and right hemispheres).
topic organization (Fig. 2) confirming a good fixation by the subject. One also observe that the lines at the periphery of the visual field yield smaller cortical activation than foveal regions. This is known as the cortical magnification factor of V1. It also suggests that a weaker fMRI signal is expected from peripheral lines, which is confirmed by further analysis using supervised learning. Note that these observations are reproducible across the 3 subjects.
Decoding results: The ultimate goal of this work is to identify the word presented to the subject in the scanner. Before addressing this hard problem, we first investigate if one can predict reliably the presence or absence of a line on the screen. To do this, we use logistic regression with a leave-one-session-out cross-validation (6 folds where each fold is a session). For computational reasons, all logistic models were fit after a univariate T-test to select the 100 most informative voxels within the training sessions. A value of 100 voxels was set as an upper bound on the expected brain volume involved in the prediction of each attribute. To control for overfitting, regularization was a squared `2 norm: Ω(W) = kWk2
F. All computations were performed using the scikit-learn package [13]. One of the challenges when working on real words is that each line does not
Figure 4. Prediction scores for each visual bar (S3). As lines have different class balance (some appear more often then others) the classification scores are converted to p-values assuming each prediction is drawn from a Bernoulli distribution with appropriate parameter. What is represented here is − log 10(pvalue) meaning that red corresponds to p-values below 0.01.
Figure 5. Word prediction scores using a ranking metric for the 3 subjects.
appear on the screen half of the time. In other words, the classes are unbalanced and the number of occurrences is different for each line. This makes classification accuracy impossible to compare between lines. To alleviate this dif-ficulty, we propose to convert the classification scores to p-values. Assuming each prediction is drawn from a Bernoulli distribution with parameter 0 < p < 1, which corresponds to the class balance, it is possible to associate a p-value to a classification score. Prediction p-values for subject 3 are presented in Fig. 4. We can observe, that lines at the center of the screen are much more reliably predicted than lines at the periphery. This is consistent with data shown in Fig. 3. The cortical magnification factor affects the fMRI spatial resolution at the periphery of the visual field.
Prediction of words: Following Eq. (3), from the prob-abilities obtained by the logistic regression models for each line, one can compute the likelihood of a word given the data. The likelihood can then be used to rank words in a corpus. Results in terms of ranking are presented in Fig. 5. Given a rank k, this plot shows the percentage of time the true word was in the first k words. To quantify the overall performance of the method, we compute an Area under the curve (AUC)index, which would be at 0.5 should the algorithm perform at chance level. Using a Bernoulli distribution as above, it is also possible to assign a p-value to a ranking score as illustrated in Fig. 5. From this result one can observe that our prediction algorithm performs significantly above chance. Results with the 2-level logistic
Figure 6. Word prediction scores using a ranking metric for the 3 subjects using a 2-level logistic model. AUC obtained consistently increase with respect to the single logistic model.
subj. 1 subj. 2 subj. 3 2-words out score 95% 92% 93%
Table I
PREDICTION SCORES WITH A2WORDS OUT VALIDATION PROCEDURE AS IN[7]. CHANCE LEVEL IS AT50%.
regression model, aiming at capturing correlation between visual attributes, are reported in Fig. 6. It can be observed that this hierarchical model consistently improve the results on the 3 subjects.
To further assess the statistical significance of our pre-diction, we used a similar testing scenario as in [7]. The procedure consists in removing two words from the training set and testing if the algorithm trained on the remaining words can predict which fMRI volume corresponds to which of the two left out words. Results are presented in Table I.
IV. CONCLUSION
In this work we have shown that it is possible to predict the visual percept induced by a complex stimulus, such as a four letter word, using fMRI data. Experimental results con-firmed well known neuroscience findings about the retino-topic organization of the primary visual areas. This turned out to be an issue when working with multi-letter words as peripheral letters were not very accurately predicted by V1. Working with multiple letters is nevertheless required when training an algorithm to extract relevant information from fMRI data during the reading process. Modeling correlations between predicted targets using a hierarchical predictive model achieves better prediction scores. More elaborate attributes about the word such as the semantic content as investigated in [7], [14] will be used in further work to improve prediction.
ACKNOWLEDGMENT
This work was supported by the ANR grant ViMAGINE 08-BLAN-0250-02 and ANR grant IRMGroup, ANR-10-BLAN-0126-02.
REFERENCES
[1] B. Thirion, E. Duchesnay, E. Hubbard, J. Dubois, J.-B. Poline, D. Lebihan, and S. Dehaene, “Inverse retinotopy: Inferring the visual content of images from brain activation patterns,” NeuroImage, vol. 33, p. 1104, 2006.
[2] Y. Miyawaki, H. Uchida, O. Yamashita, M. Sato, Y. Morito, H. Tanabe, N. Sadato, and Y. Kamitani, “Visual image recon-struction from human brain activity using a combination of multiscale local image decoders.” Neuron, vol. 60, no. 5, pp. 915–29, 2008.
[3] T. M. Mitchell, R. Hutchinson, R. S. Niculescu, F. Pereira, X. Wang, M. Just, and S. Newman, “Learning to decode cog-nitive states from brain images,” Machine Learning, vol. 57, p. 145, 2004.
[4] Y. Kamitani and F. Tong, “Decoding the visual and subjective contents of the human brain,” Nature neuroscience, vol. 8, p. 679, 2005.
[5] R. Poldrack, “Can cognitive processes be inferred from neu-roimaging data?” Trends in cognitive sciences, vol. 10, p. 59, 2006.
[6] J. V. Haxby, M. I. Gobbini, M. L. Furey, A. Ishai, J. L. Schouten, and P. Pietrini, “Distributed and Overlapping Rep-resentations of Faces and Objects in Ventral Temporal Cor-tex,” Science, vol. 293, p. 2425, 2001.
[7] T. M. Mitchell, S. V. Shinkareva, A. Carlson, K.-M. Chang, V. L. Malave, R. A. Mason, and M. A. Just, “Predicting Human Brain Activity Associated with the Meanings of Nouns,” Science, vol. 320, p. 1191, 2008.
[8] M. Palatucci, D. Pomerleau, G. Hinton, and T. Mitchell, “Zero-shot learning with semantic output codes,” in NIPS, vol. 22, 2009, pp. 1410–1418.
[9] S. Dehaene, L. Cohen, M. Sigman, and F. Vinckier, “The neu-ral code for written words: a proposal,” Trends in Cognitive Sciences, vol. 9, no. 7, pp. 335 – 341, 2005.
[10] S. Ryali, K. Supekar, D. Abrams, and V. Menon, “Sparse logistic regression for whole-brain classification of fMRI data,” NeuroImage, vol. 51, p. 752, 2010.
[11] V. Michel, A. Gramfort, G. Varoquaux, E. Eger, and B. Thirion, “Total variation regularization for fMRI-based prediction of behaviour.” IEEE Transactions on Medical Imaging, vol. 30, p. 1328, 2011.
[12] M. Sereno, A. Dale, J. Reppas, and Kwong, “Borders of mul-tiple visual areas in human revealed by functional magnetic resonance imaging.” Science, p. 889, 1995.
[13] F. Pedregosa, G. Varoquaux, A. Gramfort et al., “Scikit-learn: Machine Learning in Python,” Journal of Machine Learning Research, vol. 12, p. 2825, 2011.
[14] F. Pereira, G. Detre, and M. Botvinick, “Generating text from functional brain images,” Frontiers in Human Neuroscience, vol. 5, no. 72, 2011.