HAL Id: hal-01213079
https://hal.archives-ouvertes.fr/hal-01213079v2
Submitted on 26 Oct 2015
HAL is a multi-disciplinary open access
archive for the deposit and dissemination of
sci-entific research documents, whether they are
pub-lished or not. The documents may come from
teaching and research institutions in France or
abroad, or from public or private research centers.
L’archive ouverte pluridisciplinaire HAL, est
destinée au dépôt et à la diffusion de documents
scientifiques de niveau recherche, publiés ou non,
émanant des établissements d’enseignement et de
recherche français ou étrangers, des laboratoires
publics ou privés.
Impact of cross-reef water fluxes on lagoon dynamics: a
simple parameterization for coral lagoon circulation
model, with application to the Ouano Lagoon, New
Caledonia
Cristele Chevalier, Damien Sous, Jean Luc Devenon, Marc Pagano, Gilles
Rougier, Jean Blanchot
To cite this version:
Cristele Chevalier, Damien Sous, Jean Luc Devenon, Marc Pagano, Gilles Rougier, et al.. Impact
of cross-reef water fluxes on lagoon dynamics: a simple parameterization for coral lagoon circulation
model, with application to the Ouano Lagoon, New Caledonia. Ocean Dynamics, Springer Verlag,
2015, pp.1-26. �10.1007/s10236-015-0879-x�. �hal-01213079v2�
Noname manuscript No.
(will be inserted by the editor)
Impact of cross-reef water fluxes on lagoon dynamics : a simple
parameterization for coral lagoon circulation model, with application to the
Ouano lagoon, New Caledonia
Cristele Chevalier · Damien Sous · Jean-Luc Devenon · Marc Pagano · Gilles Rougier · Jean Blanchot
the date of receipt and acceptance should be inserted later
Abstract This manuscript presents a combined experimental and numerical study of the impact of
cross-reef fluxes on coral cross-reef lagoon dynamics. The selected field site is the Ouano lagoon (New Caledonia island, France) in the South Western Pacific Ocean. Measurements of wave transformation above the reef and current profiles through passages and reef openings have been carried out during a three months survey. Data analysis reveals the preponderant roles played by both tides and waves on the lagoon dynamics. Based on field data, a simple parameterization of cross-reef fluxes is implemented in a coastal lagoon circulation model and a satisfactory agreement is found between parameterized model and field results. The model is thus used as a numerical experimental tool in order to analyse the cross-reef flows possible influence on a narrow lagoon dynamics. The results highlight the importance of cross-reef fluxes induced by wave breaking over the reef barrier on the whole lagoon circulation and water properties.
Keywords Coral reef lagoon·Lagoon hydrodynamics ·Cross-reef fluxes·Circulation model ·Channel
lagoon
1 Introduction
Mostly present in intertropical regions, coral reef lagoon systems provide a unique habitat for a wide variety of living organisms. The lagoon biodiversity is dependent on the health of the whole food chain, in particular on plankton composition and abundance [1], and is then largely reliant on the water quality of the whole system. As a living organism, the reef itself (health, size and growth) is also particularly sensitive to the quality of surrounding marine waters, the aeration and mixing processes and the richness in nutrients [2, 3].
The quality of the reef-lagoon system waters and their bio-chemical properties are strongly dependent on circulation patterns and on water renewal time, which are mainly determined by flows through passages and reef openings and over the coral reef [4, 5]. These exchange flows between open ocean and lagoon are controlled by a set of external parameters, including tides, waves, winds, rainfalls and river discharges which spatio-temporal variations eventually rule the lagoon circulation. The relative contributions of reef and passages to the ocean-lagoon exchanges are also determined by geometrical considerations on bathymetry as the ratio between vertical cross-sections above the immersed reef flat and through the passages. Whereas the flow through passage and reef opening is weakly dependent on the water level, the flow above the reef barrier may be strongly depend on tidal fluctuations. At high tide, flows across the reef can be at least as great as flows through the passages and may even dominate in the extreme case of a shallow lagoon compared to the tidal range, see e.g. the Bamburi lagoon, Kenya, which is exposed to tidal oscillations up to 3m and where the maximal depth is less than 10m and even inferior to 3m over a large part of the lagoon [6]. Conversely, flows across the reef become almost negligible at low tide when the reef is slightly submerged or totally exposed.
A significant amount of research works have been dedicated to the understanding of small-scale hy-drodynamics in and over coral reefs thanks to field measurements [7–14], laboratory experiments [15–17], analytical approaches [18, 2] or modeling studies [19], see Monismith [20] for a review. Cross-reef fluxes Aix-Marseille Universite, Universite de Toulon, CNRS/INSU, IRD, MIO, UM 110, 13288, Marseille, Cedex 09, France
have been observed to be primarily driven by the combined effects of tidal oscillations and, when sig-nificant, wave breaking over the reef flat [7]. The relative contributions of wave and tides on cross-reef exchanges are determined by both reef structure (size, submersion, roughness) and local hydrodynamic conditions [10, 17]. Thus, the understanding of reef hydrodynamics is of primary importance for estimating the cross-reef fluxes which affect the whole lagoon circulation and, consequently, the water renewal and biodiversity of the reef-lagoon system. Moreover, coral reefs themselves appear as fascinating examples of coupled bio-hydrodynamic feedback systems permanently evolving toward a dynamic equilibrium: the coral growth affects the hydrodynamics (turbulence, mixing, fluxes, nutrient transport and deposit) which partly controls the coral reef living conditions.
The knowledge of the cross-reef water fluxes and their impact on lagoon dynamics as well as their implementation in coastal circulation models are key issues for the estimation of flushing time and prediction of biological resilience of the complete reef/lagoon system. However, due to the toughness of measuring and analysing hydrodynamics at such a wide range of spatio-temporal scales, the cross-reef effects on the lagoon dynamics remain difficult to analyse and model at the whole lagoon scale. Tidally modulated wave-driven flows above reef barriers have been the main focus of several field studies [8, 10, 21, 7]. They all show that the tidal evolution of water depth over the reef top has a strong influence on the wave-induced phenomena. Analytical models proposed by Hearn [10] or Symonds et al. [8] relate the wave-driven current above the reef to the depth at the breakpoint and the water depth over the reef flat. Once these relationships have been calibrated thanks to a site-dependent empirical coefficient, a correct agreement has been found with field measurements in moderate wave conditions [7]. It should be noted that the calculation of the depth at the breaking point requires both a good knowledge of the external bathymetry and the definition of a breaking criteria. Contributions of cross-reef fluxes versus passages flows have been compared in micro-tidal conditions [22, 13], but few studies have evaluated the flows through reef passages and across the reef in macro or meso-tidal lagoons where the tidally induced flows across the reef are likely to be greater [23]. Studies of water exchanges between meso-tidal lagoons and open sea often focus on flows through reef passages only, as for the Noumea lagoon in New Caledonia [24, 25].
The long-term aim of our study is the characterization of the ecological and hydrodynamical functioning of a channel lagoon (see section 2.1 for details). The Ouano lagoon (New Caledonia) has been selected as a representative channel reef-lagoon system both exposed to Southern and Pacific Oceans swells and meso-tides range. As demonstrated by our field results (see section 3.3), meso-tides and incoming offshore waves are the main forcings of the lagoon circulation and exchanges with the open ocean (through reef openings and above reef) and adjacent lagoon systems (through passages). The main objective of the present work is to improve, by the use of both field experiments and numerical modeling, our understanding of the role played by the cross-reef hydrodynamics on the circulation pattern at the whole lagoon scale. The field instrumentation is designed to analyse the exchanges processes while the numerical model is used as a tool for data interpretation and physical processes characterization. The latter does not aim, at this step, to provide a realistic description of the lagoon dynamics or to be used as an operational model. The adopted approach is, (i), to use a set of field measurements at strategic locations, i.e. at the lagoon boundaries, to analyse the response of ocean-lagoon exchanges to the variations of external forcings, (ii), to propose a simple parameterization of cross-reef fluxes based on the experimental results and, (iii), to implement and to test the relevancy of such parameterization in a coastal lagoon circulation numerical model used here as a numerical experimental tool in order to analyse the possible cross-reef flows influence on a narrow lagoon dynamics for which these effects are expected to have a major influence.
This article first describes the study area, the experimental strategy and the model. The field measure-ments section presents the main in-situ features of lagoon hydrodynamics. The next section is dedicated to the numerical study of the impact of cross-reef fluxes on the lagoon dynamics. Finally, the last section gives some conclusions and prospects, in particular concerning further numerical developments and combined hydro-biological research works.
2 Field site and methods
2.1 Field site
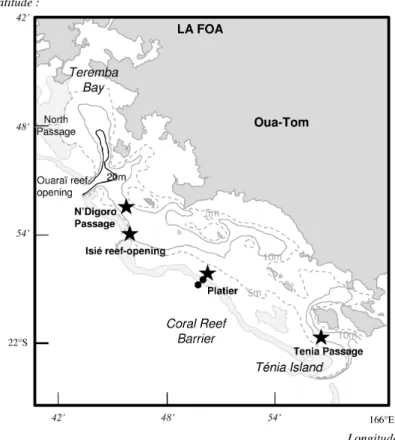
The Ouano lagoon, southwest New Caledonia, is used as an example of a coastal weakly-anthropized narrow lagoon (Fig. 1). Aiming to analyse the combined influence of waves and tides on the lagoon circulation, this site was specifically selected because it is both exposed to south pacific long swell waves and to meso-tidal fluctuations.
Fig. 1 Top view of the Ouano lagoon system. Black dots and stars represent pressure sensors and velocity profilers locations, respectively.
The Ouano lagoon can be classified as a channel lagoon, as often observed in high islands of tropical oceans. In their conceptual form, the channel lagoons are characterized by a shallow and narrow geometry and are free of any significant bathymetric sill observed in bowl-shaped lagoons. This particular structure promotes strong flushing currents forced by tides and waves and, consequently, rather short water renewal time.
The Ouano lagoon is approximately 30 km long, 10 km wide and 10 m deep. Its volume is about 2.1 109
m3
. The lagoon is separated from the Pacific Ocean by a coral reef which is about 33 km long and varies from 6.3 to 10.1 km in width and it is directly opened to ocean through two reef-openings. The southern is about 1 km wide and 10-20m deep (theIsi´ereef opening) while the northern is the deepest, down to -60m and 1.5 km wide. The lagoon is connected to northern and southern lagoons by two passages, one toward north and one toward south. The northern passage is about 5m deep while the south passage (the T´enia
passage) is 10-15 m deep. At high tide, the coral reef barrier is fully submerged, whereas at low tide it can be partly emerged depending on tide and wave conditions.
To facilitate the field experiment, the field study area is restricted to a nearly complete lagoon system extending from the T´enia passage to the N’Digoro passage where the lagoon topography is rather simple with a limited number of openings (see Fig. 1). In this part of the Ouano lagoon, the reef barrier is 25 km long and only opened at the Isi´e reef opening. The total volume of the considered portion of the lagoon is then 1.3 109
m3
.
2.2 Field experiment and methods
The aim of the instrumental deployment is to characterize the exchange processes between the Ouano lagoon and the open ocean through reef openings (Isi´e site), above the barrier (Platier site) and with adjacent lagoons through T´enia and N’Digoro passages, with a specific focus on the response to offshore wave forcing. The instruments are thus located at the boundaries of the restricted lagoon system extending from the T´enia passage to the N’Digoro passage (see Fig. 1). The field measurement campaign has been
carried out during the 2013 winter austral season from August 28 to December 4. Four current profilers (ADCP) were deployed during the experiment to provide data on temporal variability of current velocity and direction along vertical profiles. Three Acoustic Doppler Current Profilers (ADCP) were deployed (Fig. 1) in lagoon passages (N’Digoro and T´enia) and reef-opening (Isi´e). An additional profiler was deployed in shallower area at the onshore end of the reef flat (the Platiersite) to measure the cross-reef exchanges between lagoon and ocean. Mooring depths and profilers parameters are summarized in table 9. Note that instruments are mounted in heavily weighted cages or support brackets resting on the ground. Each presented mooring depth corresponds to the height of the water column above the sensor averaged over the whole acquisition duration.
Wave dynamics across the reef barrier was measured thanks to two high-frequency autonomous pressure sensors (OSSI Wave Gauge) laid on the bottom (with additional weight). The first one, called theOcean
site, is located over the reef outside slope (14.40±0.015m deep) while the second one, called theReefsite, is at the landward end of the reef (1.13 ±0.015m deep). Linear theory is used to estimate free surface oscillations from pressure measurements at the bottom. The mean water level,η, is obtained from a 30-min averaging of the 5Hz signal. The incoming significant wave heightHsis computed from the bottom pressure
measurements at the reef outside Oceansensor. Note that wave direction can not be extracted from such single pressure measurement point. Offshore wave data, includingHww3
s significant wave height,Tpww3 the
peak period andθww3
the mean wave direction were computed by WAVEWATCH III model version 4.04. For a complete description of offshore wave computations, the reader is referred to the IFREMER wave hindcast runs for the IOWAGA project ([26]). Meteorological data (wind, pressure and humidity) during the field experiments were provided by the Tontuta airport station located over the same part of New Caledonia coastline, about 25km southwest of the Ouano lagoon and 16m over ground, and thus considered to be representative of the main wind features over the studied site.
Due to the overturning of the Platier ADCP during energetic conditions, most of data presented here is restricted to the August 28 - November 6 period. Such duration remains sufficient to cover a wide range of wave and tidal conditions.
All measured currents are projected along the main flow axis (see Section 3.2) to obtain the main
and transversecomponents calledU and V respectively. For the sake of simplicity, currents are considered
positive (negative) when entering (leaving) the lagoon. The related flux is defined as the product of the depth-averaged main velocity by the local mean water depth:Q=U H.
2.3 Numerical modelisation
2.3.1 The numerical tool : ROMS
The Ouano numerical modelling was performed with the ROMS (Regional Ocean Modeling System) three dimensional dynamic model [27]. This free-surface ocean model solves the Navier-Stokes equations associ-ated with the classical Boussinesq and hydrostatic pressure hypotheses. The sub-grid scale parameterization uses the concept of turbulent viscosity and diffusivity. Here, the Smagorinsky parametrization has been used for horizontal mixing and a LMD-KPP closure parameterization [28] has been used for the vertical mixing. Similar to other oceanic models (as POM, [29]), ROMS is a split-explicit model, where short time steps are used to advance the surface elevation and barotropic momentum according to the CFL stability condition and the full 3D equations are solved separately with higher time steps. Furthermore, ROMS employs a special 2D averaging procedure for barotropic mode, which satisfies the 3D continuity equation exactly in a finite-volume/finite-time-step sense and guarantees exact volume-conservation and consistency preservation for the 3D.
2.3.2 Bathymetry and discretization
Due to the absence of refined local bathymetric data for the studied lagoon, the bathymetry used here is an interpolation of the 131 000 depth soundings performed by the Service Hydrographique et Oc´eanographique de la Marine (SHOM/MOP) over the whole New Caledonia lagoon between 1960 and 1985. The measure-ments horizontal resolution is not constant over the lagoon, varying for a few tens of meters to several hundreds of meters in the hard-to-access regions. As the initial aim of the SHOM’s soundings was to provide navigation maps, some areas of the Ouano lagoon are poorly discretized in particular in shallow near-reef regions, in the La Foa bay or in the northern part of the lagoon. The interpolation of the SHOM’s soundings, accounting for the data density, has been carried out using the UNIRAS software library from
Advanced Visual Systems. Whereas finer and complete bathymetric measurements of the Ouano lagoon should be performed in a more operational context of numerical modeling, the present bathymetry appears sufficiently accurate to run our schematic model for process studies.
Spatial discretization is based on the finite differences using an Arakawa-C grid combined with topography-following coordinate in the vertical direction (σcoordinate) discretized into 10 vertical levels with surface refinement. The study area was discretized horizontally using a uniform mesh of 108×192 cells of about 250 m resolution. This is generally of the same order of precision than the soundings resolution. The reef barrier extends thus over 2 to 4 meshes. A tricky issue is the characterization of very shallow regions, in particular the shoreline and the reef barrier itself. Shoreline and coral reef limits are determined thanks to the New Caledonia government lagoon map [30]. A flat bathymetry is imposed over the reef barrier, which do not represent the very complex and rough structure of the real reef. The vertical elevation of the reef flat is imposed from in-situ observations: the reef is just emerged during low waters of extreme spring tide. The topography between the reef center and the lagoon has been slightly smoothed to represent the transitional region from the reef flat to the lagoon sand bottom which is poorly documented by the bathymetric soundings.
Passage cross-sectional areas are estimated from the present bathymetry to compute exchanged volumes. For the N’Digoro, Platier, Isi´e and T´enia sites, they are about 2.09.104
, 3.53.104
, 1.15.104
and 2.85.104
m2
, respectively.
The extension of outside open ocean domain is set to be large enough to avoid the influence of boundary conditions (see next section). A threshold for maximal depth is imposed at 50m in order to minimize time steps constraints by depth.
The time step is constrained by the CFL condition. For the no-wave reference case, it is mainly deter-mined by the tidal wave celerity in the open ocean domain. When wave-induced fluxes are imposed on the reef barrier (see below), the time step is first limited by the velocity over the reef which can sometimes increase above 1m.s−1 in particular during model spinup. In the present study, the time step varies from
4s for theReferenceand Wallsimulation to 2s for the 1.2m wave case simulation. Further numerical work will certainly allow to optimize these values.
2.3.3 Boundary conditions and external forcings
The model domain is a rectangular area of about 26×48 km, including the Ouano lagoon. It is oriented following the main coastline direction. Hence, the north-east boundary is the land whereas the south-west boundary is the offshore boundary, about 25 km far from the coast. The lateral boundaries are located southward the T´enia Passage and northward the north passage.
Tides at open boundaries are calculated with ADCIRC (ADvanced CIRCulation model, [31]) over the New Caledonia region on a fine unstructured grid (from 500 to 25 m in shallow water). Only one tide component is imposed here, the M2 wave. As suggested by Bourret et al. [32] who studied the influence of open boundary conditions on coastal circulation, tidal forcing was specified at the offshore (south-west) boundary with a Neuman condition while water level at lateral boundaries (north-west and south-east) has been determined with a Chapman condition [33]. Velocities are deduced from a Characteristic Method [34] in the offshore boundary and with a Flather condition [35] in the lateral boundaries.
As the present study focuses on the role played by wave-induced fluxes on the lagoon dynamics, the effects of stratification, river inputs and atmospheric forcings (thermal fluxes, rainfall, wind, pressure gra-dients) have been neglected in the present numerical simulations.
At the free surface, the wind stress is neglected and so is the vertical shear of horizontal velocity. At the bottom, the bottom stress is classically prescribed with a quadratic law formulation controlled byCd
the bottom drag coefficient and −U→b the bottom velocity near the bottom, i.e at the center of the bottom
mesh [36] :
− →τ
b=ρCdk−U→bk.−U→b (1)
where −→τb is the bed shear stress.
The drag coefficient is kept constant as the vertical resolution is not sufficient to resolve the bottom boundary layer [29]. However, in order to characterize the difference of bottom structure and characteristic roughness heights, two values are used. For the sandy regions of the domain, the classical valueCd= 0.0025
is used [29]. Over the reef, strong roughness effects of coral reef on boundary layer and friction processes are expected [20]. A set of calibration tests on the M2 tide component have been performed to determine the most relevant reef bottom drag coefficient (see section 4.1.1). The value Cd = 0.01 is used, which is
2.3.4 Initial conditions for the hydrodynamic simulation
Velocities and water level were set to zero at the beginning of the simulation. About 4 days are required to spinup the model and cancel the influence of initial conditions. Most of simulation lasted for 40 days and only the 20 last days have been used for numerical data analysis.
2.3.5 The test cases
As explained in introduction, the simulations are used as a process-study tool to understand the impact of cross-reef fluxes on channel lagoon dynamics and not to provide an operational model of the Ouano lagoon. Our main aim being to discriminate the role played by tides and variable wave forcing on the exchange fluxes through passages and openings and over the reef barrier, all other external inputs (wind, rainfall, etc) are neglected (see section 2.3.3). By the same token, only one tide component is considered (M2 tide). In order to point out the influence of wave-induced cross-reef water fluxes, three schematic types of simulations have been carried out:
– TheReferencesimulation. In this simulation, the reef is simply considered as flat portion of the bathymetry, raised to a constant given elevation (see section 2.3.2) and characterized by an increased drag coefficient (see section 2.3.3). No wave forcing is considered.
– A Wallsimulation. In this simulation, the coral barrier has been considered as an impervious barrier inhibiting any flow above the barrier. This case is compared to theReferencesimulation in order to test the effect of water exchanges above the reef on the overall lagoon dynamics in the absence of wave.
– The Wave simulations. They are based on the Reference simulation for which wave are supposed to break on the reef. Wave height are kept constant during each simulation and varies from simulation to another from 0.1m to 1.2m. Water fluxes induced by wave breaking on the reef are parameterized in the model using the empirical law determined from in-situ measurements (see section 3.4)
2.3.6 Numerical product: Origin and age of lagoon water
Several research works have been dedicated to the numerical characterization of lagoon waters renewal time, see e.g. [4, 37–41]. In our case, we use the age as a relevant quantity to estimate the dynamics and history of lagoon waters defined by De Brye et al. [40] as ”the age of a water parcel located at point x
and timetis the time elapsed since the water parcel entered the domain of interest”. The age is calculated inside our computational domain divided in three areas:
– The domain of interest : the lagoon area extending from the mainland shoreline to the coral reef barrier and from the T´enia passage to the North passage
– The ocean area, out of the reef barrier
– The neighboring lagoons (south-east and north-west)
The age is a Lagrangian concept; however, as suggested by De Brye et al [40], it can be estimated from an Eulerian approach (see [40], eqs. 1-3). Using this method, both original location and age of lagoon water can be determined. Note that the lagoon renewal time water could be estimated as the moment when the whole water mass contained inside the lagoon has an external origin. However, in the present paper, a focus is made on the above-mentioned quantities (age and origin) to characterize the lagoon renewal dynamics (see sec. 4.3). As constant forcing (waves and tides) is applied for each simulation, the computation of age and origin of lagoon water shows an asymptotic behaviour. The simulations are thus set to last until all lagoon water is renewed (until few hundred days for some simulation cases) and asymptotic values reached by both age and origin are extracted and analysed, see section 4.3.
3 Field measurements results
The overall objective of the field part of our work is to provide a set of in-situ measurements to identify the forcing agents of the lagoon dynamics and to understand their coupled influences. We first focus on the wave transformation over the reef and then describe the main trends observed at the measurement sites in terms of levels and currents.
23 Sep 13 Oct 02 Nov 0 1 2 3 Hs (m)
Reef outside measurement WW3 model predictions
23 Sep 13 Oct 02 Nov 0 5 10 15 20 Tp (m)
Reef outside measurement WW3 model predictions
23 Sep 13 Oct 02 Nov 100 150 200 250 300 Wave direction ( o) WW3 model predictions
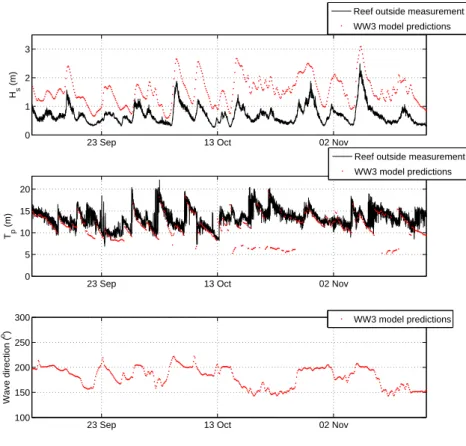
Fig. 2 Wave features during the studied period. Top plot: comparison between significant wave heights measured at the Ocean sensor (black line) and provided by WW3 model (red dots). Middle plot: comparison between significant wave heights measured at the Ocean sensor (black line) and provided by WW3 model (red dots). Bottom plot: Wave direction provided by WW3 model.
3.1 Wave dynamics
The characterization of wave propagation and transformation above the reef barrier is of great importance to understand the energy and mass transfers from open ocean to lagoon. Wave measurements performed at the Ocean site (see Fig. 2) are typical of long swell waves, with significant wave height ranging from 0.4 to 2.3m and most of measured peak period ranging from 10 to 20s. Several energetic swell events are observed during whichHsremains higher than 1.2m for several hours or days. In-situ wave measurements
are compared with WW3 numerical model estimations [26], see Fig. 2. The significant wave heights com-parison (top plot) shows that, even if a strong correlation exists (correlation coefficient 85%), the numerical estimations systematically overestimate the value measured at the reef outside slope: the ratio numerical and measured data ranges from 1.1 to 5.1 with a mean value around 2.4. As observed when comparing the overestimation factor with the predicted wave direction, this trend may partly be attributed to refraction effects: the best agreement between model and measurements is obtained for normally incident wave (the mean reef angle is nearly 210o). Further field measurements have to be performed to better understand
such discrepancy between model and observations and characterize the wave transformation on the reef outside slope including bottom friction and reflection processes.
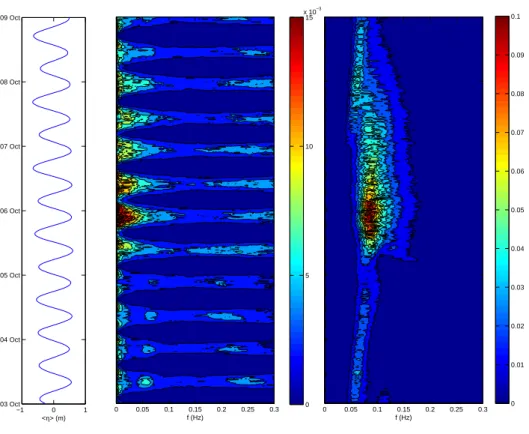
A representative 6-day time period from Oct. 3 to Oct. 9 is selected to emphasize the wave transformation above the reef. Figure 3 compares the time evolution of the spectral density of energy for the Reef and Ocean sensors, according to the corresponding 30-min averaged water level.
Wave dynamics at the outside reef (Ocean site, right plot) is focused in the gravity band. Most of the energy (>95%) is typical of long swell waves, with corresponding wave periods between 8 and 22s, and very weak energy for high frequencies. A significant swell event, with significant wave height two times higher than the average height over the whole experiment, is observed to hit the reef barrier on Oct. 5 and slowly decay on the following days. No tide dependency is observed. The Reef sensor (Fig. 3, middle plot) reveals radically different features. The wave dynamics over the reef is strongly controlled by the
−1 0 1 03 Oct 04 Oct 05 Oct 06 Oct 07 Oct 08 Oct 09 Oct <η> (m) f (Hz) 0 0.05 0.1 0.15 0.2 0.25 0.3 0 5 10 15 x 10−3 f (Hz) 0 0.05 0.1 0.15 0.2 0.25 0.3 0 0.01 0.02 0.03 0.04 0.05 0.06 0.07 0.08 0.09 0.1
Fig. 3 Wave transformation above the reef barrier. Left plot: 30-min averaged water level. Middle plot: Spectral Energy Density at the Reef sensor in m2
.Hz−1. Right plot: Spectral Energy Density at the Ocean sensor in m2
.Hz−1. Note that, as strong energy dissipation occurs during wave breaking and propagation over the reef, the spectral densities of energy at the Ocean and Reef sensors show quite different ranges (nearly one order of magnitude). Different scales are thus used for the sake of visual commodity.
tide level: the higher the mean level is, the stronger the wave energy is. A large part of the wave energy (around 45% forHs<0.5m and up to 85 % at the swell peakHs= 1.7m) is here distributed in the band
0< f <0.05Hz. This highlights the strong energy transfer toward long infragravity waves during swell wave
breaking above the reef as described by Pomeroy et al. [14]. Some short wave energy is also observed in the band 0.15< f <0.3Hz. Estimation of wind-generated waves using the typical lagoon length-scale [42] and wind measurements from the Tontouta airport station 25km southward from the Ouano lagoon) provides wind wave frequency from 0.4 to 0.8Hz, which is much higher than the frequencies observed here. The most probable source for the observed free surface motion in the 0.15< f < 0.3Hz band is the generation of higher harmonics (i.e. secondary waves) as the incoming gravity swell propagates over the reef [43].
It is also noted that small and very long swell waves observed the first two days at the Ocean sensor are more prone to propagate above the reef than shorter but much higher waves observed from Oct. 5 to Oct. 8. For such large swell events, the strong energy peak in the swell gravity band at the reef outside is nearly absent on the reef. As explained above, the incoming energy has been mostly transferred toward low frequency infragravity motions in that case. Additional field measurements are necessary to better understand the wave transformation above the reef barrier in the continuity of the works recently engaged [7, 14]. This will require a high resolution measurements both in time and horizontal direction along the selected cross-reef transect from the shoaling zone above the outside slope up to the inner part of the reef in order to, (i), discriminate the roles played of reflection, dissipation and harmonic transfers and, (ii), improve the definition of breaking threshold which is of primary importance for the estimation of wave-induced fluxes (see section 3.4).
Main angle Umax Umin U |U | Vmax Vmin V |V | |V | |U | N’Digoro 327 0.29 -0.63 -0.11 0.14 0.11 -0.13 0.001 0.014 0.09 T´enia 123 0.39 -0.44 -0.03 0.1 0.13 -0.2 0.003 0.015 0.15 Platier 10 0.44 0.07 -0.07 0.07 0.19 -0.19 0.006 0.036 0.5 Isi´e 265 0.7 -0.6 -0.06 0.21 0.23 -0.14 0.02 0.04 0.19
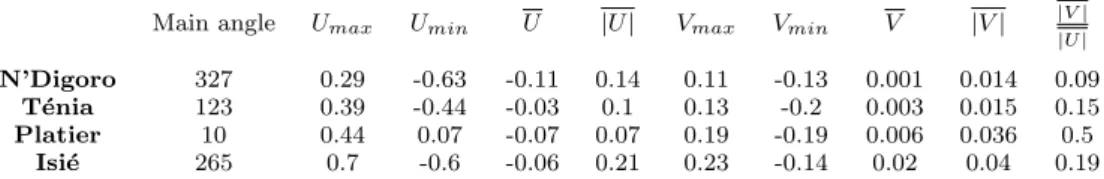
Table 1 Depth-averaged velocity statistics for the four measurement sites (m.s−1): maximal value, minimal value, mean value and mean value of the magnitude for both main and transverse components and ratio between the mean values of magnitude.
3.2 Levels and currents
As expected for meso-tidal lagoon, free surface motions are characterized by a semi-diurnal fluctuation with an amplitude varying from 0.2 to 0.7m during the neap and spring tides and the water level is generally the same at all moorings location.
Velocity profiles showed a quite small vertical variability (less than 5 cm.s−1 on average from up to bottom velocity), thus the averaged values are considered as representative. Statistics for depth-averaged velocities are shown in table 1. Let us first focus on the hydrodynamics within passages and openings. The depth-averaged currents in the passages and reef opening have been observed to follow a main direction, either in- or outward. As illustrated by the dispersal ellipses (Figure 4), these main directions are 123o, 327o and 265o for the T´enia, N’Digoro and Isi´e sites, respectively. The dominance of the main
component is demonstrated by the ratio between temporally averaged values of the magnitudes of both velocity components |V |/|U | (see table 1, last column). This ratio ranges between 0.09 and 0.19, which indicates a strong dominance of the main component for the T´enia, N’Digoro and Isi´e sites. The usual tide-related oscillations with in- and out-flows are observed at each mooring. As highlighted by the dispersal ellipses asymmetry and the negative mean values of the main component, the tide-averaged dominant trend for T´enia, Isi´e and N’Digoro sites is an outflow leaving the lagoon. However, in- and outflows are rather well balanced for Isi´e and T´enia, inducing weak (outflow) time-averaged velocities at these locations (around 5cm.s−1) whereas maximal outward flow at the N’Digoro site is about two times greater than the inward
current and the mean velocity is above 10cm.s−1. The Isi´e mooring shows the greater velocities both in
instantaneous and averaged values, reaching up to 0.7 and 0.21 m.s−1, respectively. The mean current
values are lower in N’Digoro (|U |= 0.14m.s−1) and T´enia (|U |= 0.07m.s−1).
The current at the Platier site is also along main direction, but the transverse component is here generally more important than in other sites (|V |/|U | = 0.5). The mean value for main component is positive revealing a dominant inflow tendency (93% of the sequence). The depth-averaged velocity mainly ranged from about 0 to 0.2m.s−1(89% of the collected data). The currents at the Platier site appear to be
strongly related to the external wave forcing. Rare but high instantaneous entering current larger than 0.3
m.s−1are observed during large wave episodes (Hs>1.5m, which occurs about 1.5 % of the time) whereas
weak velocity fluctuations around zero (|U | <0.05m.s−1) are observed during calm periods (Hs <0.5m
with occurrence frequency about 26 %).
3.3 Dynamics of the reef-lagoon system
Usually, water circulation within lagoons is mainly controlled by fluxes through passages, reef opening and above the immersed part of the coral barrier in response to external forcings, such as tides, waves, wind, etc [7, 17, 44, 45]. In the considered lagoon, the main driver is the tide, as demonstrated for instance by the dispersal ellipses (Fig. 4) or the periodic oscillations of velocities observed in Fig. 5. In order to identify the relative importance of the other forcings on the lagoon circulation, velocity data have been bandpass filtered to remove the influence of the M2 and S2 tidal components. Correlations between tidal-filtered depth-averaged velocity and external parameters are shown in table 2. We only consider here the effects of incoming wave height Hs and peak period Tp, the wave angle θww3 and the wind magnitude W and
directionθw. Rainfalls have been sparse on the studied period: only ten rainy days with cumulated rainfall
on the total campaign about 70mm and a maximal daily value about 12mm. The effect of rain is thus neglected. Wind can also be expected to affect the lagoon-reef hydrodynamics, depending on the local wind intensity. Wind measurements performed at the nearby Tontouta airport station revealed the typical wind pattern observed during the experiments. Trade winds are modulated by thermal breeze and guided by
Fig. 4 Dispersal ellipses for the four mooring sites (black dots represent the zero values and scale is given by the 1m.s−1 arrow)
.
Designation N’Digoro T´enia Platier Isi´e
Hs 57 21 80 62
Tp 1 19 15 5
θww3 7 50 30 4
W 21 30 1 19
θw 11 10 6 14
Table 2 Correlation (in %) between tidal-filtered velocity and external parameters at the four measurement sites. Hsand Tp are the significant wave height and wave period measured at the Ocean sensor, θww3 is the offshore wave direction computed by WW3 model and W and θware the wind magnitude and direction measured at the Tontouta airport station
the mountainous topography of New Caledonia. Winds are minimal during nights (lower than 1 m/s) and nearly offshore (north-west to north). They increase during the day in the range 3-6 m/s while clockwise rotating and blowing from the east, then south and finally west before slowing down in late afternoon.
Table 2 shows that, apart from the tide effect, the incoming wave height is the principal external pa-rameter affecting the lagoon dynamics in the studied period. As expected, this wave effect is overwhelming at the Platier site which is directly exposed to wave breaking induced water fluxes. The wave height is also well correlated (>50%) to the tidal-filtered dynamics at the N’Digoro and Isi´e sites. Other correlation coef-ficients are too small to infer a clear relationship between measured currents and other external parameters at Platier, N’Digoro and Isi´e sites. Velocity measurements at the T´enia site reveal a different behavior. It is not dominated by incoming wave height effect, but shows significant dependence to wave direction and, more weakly, to wind magnitude.
In our following attempt to parameterize wave effect on the lagoon dynamics, the choice is made to focus on the significant wave height which is, apart from the tide, the dominant external driver of the velocity in three out of four of the studied sites. The role of incoming wave direction is neglected, but it probably deserves detailed consideration in further improvement of the wave effect parameterization. The direct influence of the wind stress is also neglected, as it was in other lagoon studies [46, 47, 13] in similar wind conditions, but should also be considered as a secondary forcing in realistic numerical approach, which is not the aim of the present paper.
3.3.1 Tidal influence
The power spectrum estimated by periodogram analysis [48] of the amplitude of water level variation confirmed the prevalence of the semi-diurnal and diurnal tides M2, S2 and K1 which determine about 97% of the signal. The tidal range varied slightly inside the lagoon and there was a weak phase lag of few minutes (above the error [48] between each station in table 10).
The tide also determines, but in a lesser extent, the magnitude and direction of the currents in the lagoon. Spectral analysis [49, 50] of the velocity measured at the moorings confirmed the dominant role played by semi-diurnal and diurnal components M2, S2 and K1 on the velocities and also revealed the presence of quarter-diurnal component (M4). Their influence is really dominant for the current through the Isi´e reef opening where the tidal current represents about 93% of the total current, but also in T´enia and N’Digoro passages where tidal currents about 66% of the magnitude of the observed instantaneous currents, see table 10. At the Platier site, this tidal influence is less visible.
Whereas the intermittent permeability of the barrier tends to cancel out the phase lag between the cross-reef current and the sea surface height, currents at moorings in the reef openings and passages are driven by the difference in water level inside and outside the lagoon. At Isi´e, N’Digoro and T´enia sites, depth-averaged velocities were seen to be nearly in quadrature with the water level: The phase lag ranged from 2.5 to 3.5 hours for the M2 tide (table 10) with an off-shore to in-shore progression, for the M2 component wave of tidal flow. The flood starts at reef opening, then is observed in N’Digoro passage and finally, few minutes later, at T´enia. Hence, the induced tide inside the lagoon was, a forced almost standing wave, with few minutes of phase lag.
The lagoon is observed to fill (resp. empty) with the flood (ebb) tidal cycle through both passages and reef opening. About 30 % of the tidal fluxes transits, each tide, through Isi´e reef opening; 20 % through N’Digoro passage and above the reef, but only 2 % through T´enia Passage. These proportions slightly varies with tide amplitude. One notes that, in comparison with neap tides, the part of the exchanged flux at N’Digoro with respect to the total flux increases during spring tides of about 20% while its counterparts in Platier and Isi´e sites decrease of about 5%.
The lagoon volume ranged from about 1.2 to 1.5 109
m3
and from 1.3 to 1.4 109
m3
during spring and neap tides, respectively. Hence, using the tidal prism method [51], the tidal-prism flushing time can be estimated at 2 days during spring tide but only 8 days during neap tide.
3.3.2 Tidally-averaged dynamics
Depth-averaged velocity measurements can be averaged in time over the successive tidal cycles to remove the influence of tide oscillations on the water fluxes. Applied on the Platier profiler data, this tide-averaging reveals the relationship between cross-reef current and wave forcing (with a correlation of 0.81, see section 3.4 for further analysis of cross-reef fluxes). Averaged on the campaign, the mean cross-reef current is estimated to 0.07m.s−1. As it takes place all over the reef flat, this flux plays a significant role in the total
exchanges between lagoon and open sea. Indeed, integrated all along the reef this inflow represents about 40% of the lagoon volume each day. Such input is compensated by strong exchanged volume in Isi´e reef opening (about 0.5.108
m3
a day) and passages (2.108
m3
and 0.8.108
m3
a day through N’Digoro and T´enia passages, respectively). The wave-driven cross-reef exchanges are enhanced during strong wave activity, as the one observed the October, 5-6 (see next section). During this event, the tidally-averaged velocity above the reef can reach about 0.15 m.s−1, and induces an exchange of about 11.108m3 a day , which is about
85% of the volume of the lagoon in one day.
3.3.3 Lagoon circulation: a coupled tide-surface-wave dynamics
As explained above, tides and waves are by far the dominant drivers of the studied lagoon circulation. To highlight their coupled influence, two 24-h measurements periods are presented in Fig. 5. The first period (left plots) lasts from Oct. 3, 23:00 to Oct. 4 23:00 while the second period (right plots) lasts from Oct. 5, 12:00 to Oct. 6 12:00. Both show a nearly similar tidal range (0.6m) but quite different significant wave heights (0.3m and 1.2m). Top and bottom plots represent the flux at the four measurements sites and the 30-min averaged sea surface level measured at the Ocean sensor, respectively. The red dots in bottom plots indicate if the breaking criterion threshold is reached.
During moderate wave conditions (Fig. 5, left plots), one first notes that the fluxes is maximal in the Isi´e reef opening, which is directly connected to the open ocean, whereas the smallest flux is observed for the Platier site which measures the cross-reef current. The temporal evolution of flux highlights both phase
12:00 16:48 21:36 02:24 07:12 12:00 −10 −5 0 5 10 Q (m 2/s) Date=5−6 Oct, Hs=1.2 m Cross−reef N Digoro passage Tenia passage Isie passage 12:00 16:48 21:36 02:24 07:12 12:00 −0.6 −0.4 −0.2 0 0.2 0.4 0.6 η (m) No wave breaking Expected wave breaking 23:00 03:48 08:36 13:24 18:12 23:00 −10 −5 0 5 10 Q (m 2/s) Date=3−4 Oct, Hs=0.3 m Cross−reef N Digoro passage Tenia passage Isie passage 23:00 03:48 08:36 13:24 18:12 23:00 −0.6 −0.4 −0.2 0 0.2 0.4 0.6 η (m) No wave breaking Expected wave breaking
Fig. 5 Comparison between calm and strong wave events on the left and right plots, respectively. Top plots depict the fluxes calculated from depth-averaged velocity at each site while bottom plots shows the mean water level fluctuations with estimation of wave-breaking occurrence (red dots) using ad-hoc breaking criterion.
shifts and differences in tidal dynamics at the studied sites. At the Isi´e passage, the flow reversals around the tide apices are much less smooth than at the other sites which show the typical sin-like evolution of tidal flows. An important observation is that, for these calm wave conditions, fluxes at the N’Digoro passage are nearly symmetric (similar flood and ebb magnitudes), while the Isi´e passage shows a more pronounced inflow. This trend is even clearer at the T´enia site for which small inflows are observed only during the first part of the rising tide.
When the reef barrier is exposed to stronger wave energy (Fig. 5, right plot), the overall scheme appears to be similar, in terms of phases and oscillation magnitude, but a dramatic shift is observed toward an emptying tendency through each passage. Through N’Digoro and T´enia passages, the flux is systematically directed toward the open ocean, even at rising tide, while at the Isi´e reef opening, the outflow becomes clearly dominant. These observations should be related to the significant cross-reef inflow occurring above the barrier. The offshore wave energy is here sufficient to produce a permanent wave breaking all along the tidal oscillations. The related induced current drives water into the lagoon all over the reef barrier which finally forces a nearly generalized outflow toward the passages.
This again demonstrates the major role played by the wave-induced current into the water masses dynamics at the lagoon scale.
3.4 Cross-reef Fluxes
In most of existing research works on cross-reef fluxes [8, 7, 10], the flux calculation generally requires the description of wave transformation during shoaling and breaking processes and, in particular, to compute the wave height at the breaking point. Such quantity can be obtained using linear shoaling theory and breaking criterion [7] but this would require a high-resolution (meter scale) knowledge of the bathymetry in cross-reef direction and can hardly be generalized all along the reef. A more global criterion is, then, expected. The choice is made here to only relate the flux to easily available external parameters. Preliminary analysis demonstrated that the depth-averaged current is primarily dependent on the water depth above the reef and on the incoming significant wave height which were chosen to be the main governing external parameters.
A simple breaking criterion based on the ratio between the incident significant wave height Hs and
the depth over the reef flat H is defined: when Hs/H > 0.7 waves are expected to break over the reef
non-−0.5 0 0.5 −0.4 −0.2 0 0.2 0.4 0.6 0.8 1 1.2 η (m) Q/Hs (m/s) Full data −0.5 0 0.5 −0.4 −0.2 0 0.2 0.4 0.6 0.8 1 1.2 η (m) Q/Hs (m/s)
Breaking waves only Linear fit
05 Sep 06 Sep 07 Sep 08 Sep 09 Sep 10 Sep 11 Sep 12 Sep 13 Sep 14 Sep 15 Sep −0.2 0 0.2 0.4 0.6 0.8 1 1.2 Q (m 2 /s)
Measured cross−reef flux Parameterized cross−reef flux
Fig. 6 Cross-reef flux parameterization. The top plots depicts the evolution of the cross-reef flux divided by the significant wave height Q/Hs with respect to the mean water level η. Full data is shown in top left plot while and the data where breaking is expected is show in top right plot. Bottom plot represents for a ten days time period the comparison of measured and calculated fluxes. The discontinuities in calculated flux correspond to the non-breaking periods. Positive velocity values correspond to inward current entering the lagoon.
breaking conditions clearly appears in the cross-reef current (Fig. 6, top plots). At high tide, in wave breaking conditions, the flux tends to be relatively high, whereas it is weak or negative (offshore directed) when no breaking occurred.
This selected breaking threshold uses the same value that the one proposed by Sysmonds et al [8] although their criterion is based on the wave height calculated at the breaking point, not the incoming significant wave height measured in 14.4m depth as in our case. In the continuity of field measurement works recently engaged [7–14], further high (horizontal) resolution experiments should be carried out to provide a finer characterization of wave transformation over the reef barrier. This requires to deploy high-frequency (wave-scale) instruments from the outside slope up to the lagoon to better understand shoaling, reflection, wave breaking, dissipation and harmonic transfers with a sufficient horizontal resolution to capture surf zone processes which shift with tides and incoming wave height. Additional measurements should include other locations along the reef to estimate the longshore variability of the observed processes. A particular attention must be paid on the estimation on breaking threshold, which has been here indirectly characterized using the dependence of the cross-reef current to the Hs/H ratio. Nonetheless, it should be emphasized
that, in nature, the initiation of breaking for real wave spectrum over a complex bathymetry such as coral reef is not an sudden process, but rather a progressive transition from partial breaking to a fully saturated surf zone. The triggering for the activation of wave breaking induced flux in the model, described later on, should be a smooth process and not drastically sensitive to the exact value of breaking threshold. Note also that, aiming to implement the cross-reef flux parameterization in a lagoon circulation numerical model, a constant bed elevation value is used to average the very complex bathymetry of coral reef barrier.
AmpM odel(m) AmpM eas. (m) PhaseM odel(o) PhaseM eas.(o) Corr. (%) Error
N’Digoro 0.40 0.38 272 272 100 2.10−4
Isie 0.40 0.36 272 272 100 6.10−4
Reef 0.39 0.40 270 272 100 2.10−4
T´enia 0.40 0.41 272 272 100 0.5.10−4
Table 3 Comparison between model computations (Reference simulation) and measurements for the M2 tidal component of water level at each mooring. Tidal amplitude and phase, correlation and mean squared error.
MagnM odel(m/s) MagnM eas. (m/s) PhaseM odel(o) PhaseM eas. (o) Corr. (%) Error
N’Digoro 0.03 0.08 82 198 -44 5.0.10−3
Isie 0.25 0.29 173 166 99 1.5.10−3
Reef 0.07 0.03 64 269 -90 4.4.10−3
T´enia 0.13 0.09 165 203 78 3.2.10−3
Table 4 Comparison between model computations (Reference simulation) and measurements for the M2 tidal component of velocity at each mooring: Current amplitude and phase, correlation and mean squared error.
Under wave breaking conditions (Fig. 6, right plot), the flux tends to be a monotonically increasing function of the water level,η, and, even if a rather large variability is observed, a fitted linear relationship may be obtained:
Q=Hs(A ∗ η+B) (2)
whereA= 0.48s−1 andB= 0.36m.s−1 are empirically-determined coefficients by least-square method.
As illustrated in figure 6 where measured and parametrized cross-reef velocity are presented during a period with both high (Sept. 5-8) and low (Sept. 12-14) energy events, this empirical linear relationship provide a quite fair representation of the order of magnitude and main tendencies of the cross-reef flux even if the extreme values at the tide reversals can be underestimated. The correlation coefficient between the linear fit and the measured data in breaking conditions is 0.74. As expected, such agreement is slightly lower than the correlation obtained, for instance, by Bonneton et al. [7] which account for more physical considerations in their cross-reef fluxes parameterization (see also [10, 8]). However, their analysis requires the computation of internal parameters of the system, such as the wave setup or wave height at the breaking point, which necessitates a detailed knowledge of the bathymetry (see details above). The present results suggest that, in the context of lagoon circulation studies, our simple parameterization in terms of the sole external parameters provides a crude, but easy-to-use description of the cross-reef fluxes and that the benefits of using finer fluxes estimation may be offset by the need to measure the bathymetry at a sufficient resolution to compute wave features up to the breaking point using linear wave theory [7] and the cost of additional computations.
4 Impact of the cross-reef dynamics
4.1 Numerical developments
4.1.1 Validation of the Reference simulation
TheReferencesimulation is first used to validate our numerical choices, in particular in terms of boundary
conditions and bottom drag coefficients (see section 2.3.3), and then to simulate the tidal propagation within the Ouano lagoon. Recalling that numerical simulations are used here as a tool for process study and not as a fully realistic model of the Ouano lagoon, the validation has to be regarded as a verification of the model ability to simulate the tidal dynamics. The analysis focuses on the M2 tide component, in terms of amplitude, phase and related currents at each of the selected moorings. Tables 3 and 4 show the comparison between numerical results for theReferencesimulation and in-situ tidal components extracted over the whole field data (see section 3.3.1 and table 10) for the water level fluctuations and tidal-induced currents, respectively.
A very good agreement is noted for the tidal free surface dynamics (table 3) both in terms of amplitude, correlation and phase. The simulation of tidal currents shown in table 4 is less accurate and calls for comments. Currents magnitude and phase are rather well reproduced by the model at the Isi´e and T´enia
Fig. 7 Numerical lagoon dynamics for the Reference case, only tide forcing is considered. Velocity (direction and intensity) during (a) high water, (b) the ebb (high water +3h), (low water) and (d) during the flood (low water + 3h)
sites, which is also highlighted by the good correlation coefficients between simulated and measured data. At N’Digoro and Platier sites, the simulated currents are clearly out of phase and even nearly in opposition of phase for the Platier site. This phase lags are largely attributed to the role played by the wave-driven component of the cross-reef fluxes which are nearly always present during the field measurements and affect the whole lagoon dynamics (see below) but are not taken into account in theReference simulation. Part of the discrepancy between simulated and measured tidal currents in the N’Digoro passage can also be explained by the fact that this mooring is located in an area with a high spatial variability of current and the spatial resolution of the topography is not enough accurate to precisely reproduce the measured velocity in such a sheared flow at the exact location. Note also that, for the calm wave case, a quarter-diurnal wave at the T´enia site was observed both in numerical and measured data.
The model provides a good representation of the expected periodic filling-emptying cycles of the lagoon induced by the tidal oscillations, see correlations in tables 3 and 4. In most of the lagoon, the currents
reach their maximums during flow and ebb and nearly vanish during slack water, see Fig. 7. Note that, due to the reduced passage section (depth <3m), strong currents are observed in the strait of La Foa bay. In the studied area (see description in section 2.1), the most intense flows are observed in the main channels of the lagoons. The simulated flow pattern does not show a circulation cell but rather nearly symmetric filling/emptying processes between the south (T´enia passage) and north (Isi´e openings) connections. The impact of such flow structure in the lagoon and the presence of a nearly ”dead” zone in the lagoon center on the water renewal dynamics will be further analysed in section 4.3.
4.1.2 Implementation of cross-reef fluxes
The parameterization of cross-reef fluxes presented in section 3.4 is used to take into account the combined wave and tide driven fluxes above the reef in the numerical model.
In the lagoon numerical model, the depth D over the reef flat is computed at each time step (taking account the water-level and the bathymetry) to determine if incoming waves are expected to break or not on the reef part of the mesh grid. If it does, i.e. forHs/H >0.7, the cross-reef flux at reef mesh where waves
are expected to break is approximated according to the above-mentioned linear adjustment. This value is then imposed to the flux at the corresponding reef mesh cells in the model. WhenHs/H <0.7, the fluxes
are assumed to be purely driven by tidal oscillations. In this case, no forcing is imposed and the model computation is freely running at this cell.
Note that the water level at the outside reef border grid points is adjusted to compensate the wave-induced flux imposed on the reef. Furthermore, a ramp is applied to ensure a smooth transition between breaking and non breaking states. The imposed fluxF is thus defined as:
F =Fw+1− tanh(r)
2 Fc (3)
whereris the transition parameter,Fcis the freely calculated flux andFwthe parameterized flux including
wave effects given by
Fw=Hs(Aη+B)1 +
tanh(r)
2 (4)
The transition parameter is defined asr=α(Hs
D − Bc) where αis the ramp steepness (chosen here to be
0.5) andBc= 0.7 is the breaking threshold, see section 3.4 for details.
4.1.3 Analysis of the implementation of cross-reef fluxes
The purpose of this section is to demonstrate how the implementation of cross-reef fluxes improves the numerical description of tide propagation and currents. A more comprehensive analysis of the effect of wave-induced fluxes on the overall lagoon dynamics is proposed in section 4.2.
The comparison betweenReferencesimulation and field measurements carried out in section 4.1.1 is based on the M2 tidal component. It is recalled that the M2 component of in-situ tidal currents is extracted from the whole three-months measurement campaign during which the reef is nearly systematically exposed to swell forcing (see Fig. 2). Wave-breaking induced cross-reef fluxes are expected to affect the lagoon dynamics most of the time (see Fig. 6) and thus to largely explain the differences observed between simulated and measured tidal currents observed in table 4, given that theReferencesimulation does not take into account any wave influence. To test the effect of cross-reef fluxes parameterization, aWavesimulation is performed using the averaged value of significant wave height over the whole field data Hs = 0.66m. The effect
of parameterization is to shift in time the apex of cross-reef fluxes and, in consequence, also shift the timings of velocity maximums in channels and passages. Table 5 shows the influence of this average wave forcing on the model results, in terms of tidal currents magnitude and phase. The comparison between
the Referencesimulation (4) and the Wavesimulation (tab. 4) highlights the general improvement of the
agreement between model and measurements with increased correlations and lower errors. One notes that the phase lag, previously observed between in-situ measurements andReferencesimulation (tab. 4), have been significantly reduced.
Another test of the validity of the proposed parameterization is performed on two wave-cases numerical simulations compared with the selected field measurements presented in Fig. 5. The first simulation is a low wave forcing caseHs=0.3m presented in Fig. 11 (bottom left plot) and to be compared with the low
wave field data shown in Fig. 5, left plots. The second simulation represents a significant wave event with
Hs=1.2m (Fig. 11, bottom right plot) related to the high wave measurements presented in Fig. 5, right
MagnM od.(m/s) MagnM eas. (m/s) PhaseM od.(o) PhaseM eas.(o) Corr. (%) Error
N’Digoro 0.03 0.08 129 198 36 3.1.10−3
Isie 0.27 0.29 184 166 95 4.2.10−3
Platier 0.03 0.03 225 269 72 0.2.10−3
T´enia 0.15 0.09 178 203 91 3.0.10−3
Table 5 Comparison between model computations (Wave case simulation Hs = 0.66m) and measurements for the M2 tidal component of velocity at each mooring. Current amplitude, phase, correlation and mean squared error.
1.2m wave forcing
Case N’Digoro Isi´e T´enia Platier
Ref.simulation 1 82 -55 34
Wavesimulation 92 97 77 67
0.3m wave forcing
Case N’Digoro Isi´e T´enia Platier
Ref.simulation 71 96 35 90
Wavesimulation 83 97 51 91
Table 6 Correlation coefficients (in %) between measured and simulated fluxes over two tidal cycles. The measurements, previously presented in Fig. 5, are compared with Reference and Wave simulations, the latter being forced with the in-situ measured significant wave height.
details in section 4.2, to force water input above the reef barrier and, as a consequence, to enhance outflows in each passages and reef openings (see e.g. Fig. 11, top right plot). One focuses here on the improvements brought by the parameterization in the numerical description of the effect of wave-induced fluxes. It is first recalled that, as only the main tide component is considered (M2 tidal wave), any direct comparison between model and measurement should be interpreted with caution. With this incomplete forcing, the numerical tidal amplitude is lower than the measured one for the selected days and so are the tidal oscillations of cross-reef flux and exchanges through passages and reef-openings. However, accounting for such sources of uncertainties, computation of correlation coefficients between measured and simulated can provide an interesting estimation of the effect of parameterization. The experimental cases presented in section 3.4 (see Fig. 6) are compared withReferenceand correspondingWavesimulations, i.e.Hs= 0.3 and 1.2m for
the low and high wave cases, respectively. The correlation coefficients between numerical and measured fluxes computed over two successive tidal cycles are shown in table 6. One notes the general improvement in the whole lagoon brought by the use of wave-induced flux parameterization in the numerical model. This is particularly significant for the high wave case (Hs= 1.2m) where the wave effect is expected to be
stronger. The greater improvements are observed for the N’Digoro and Platier sites, for which theReference
simulation is clearly no able to simulate the fluxes.
This demonstrates, on one hand, the necessity to account for wave effect when performing hydrodynamic simulations of the reef-lagoon system and, on the other hand, the efficiency of the parameterization to represent the main effect of wave-induced flux on the lagoon circulation. Thus, pointing out the process-study objective of the numerical simulations, the present results indicate that the proposed model with its parameterization of wave-induced fluxes is a relevant tool to analyse the response of the reef-lagoon system to wave forcing.
4.2 Cross-reef fluxes impact on lagoon dynamics
4.2.1 Influence of cross-reef tidal fluxes
The first step of the analysis of the role played by cross-reef water fluxes on the lagoon dynamics is to compare theReferenceand Wallsimulations. No wave effect is considered and the only difference between test cases is the presence of an impervious reef barrier for theWall simulation, so the sole effect of tidal cross-reef fluxes can be analysed. The comparison of mid-tide currents shown in figures 7 (right plots) and 9 shows that, even if the general circulation pattern within the lagoon and around passages and openings is quite similar for both simulations, an overall flow enhancement is observed when considering the reef as an impervious barrier. This trend for stronger currents is also demonstrated in Fig. 8 which compares the simulated fluxes at each sites over two tidal cycles. Along the tidal cycle, one notes that the difference between Referenceand Wallsimulations increases with water level. This trend is expected as the passage
0 5 10 15 20 −8 −6 −4 −2 0 2 4 6 8 t (h) Q (m 2/s) Reference − NDigoro Reference − Isie Reference − Platier Reference − Tenia Wall− Isie Wall − Tenia Wall −NDigoro
Fig. 8 Influence of cross-reef tidal fluxes: comparison between Reference and Wall simulations for simulated fluxes over two successives tidal cycles at each site.
Case N’Digoro Isi´e T´enia Platier
Flood Ref. -2.1 49.9 49.2 9.3 Wall -5.1 64.4 51.6 -Ebb Ref. 5.1 -49.7 -42.7 -20.8 Wall 12.1 -67.2 -52.5 -Total Ref. 3 0.3 6.6 -11.6 Wall 7.1 -2.6 -0.77
-Table 7 Exchanged volumes (in millions of m3
) through N’Digoro and T´enia passages and Isi´e reef opening for the Referenceand Wall simulations. Calculations are performed for flood and ebb tides and for complete tidal cycle.
section above the reef is maximal at high tide. Most of changes in terms of magnitude are observed in the Isi´e site, which is explained by the fact that, in theWallcase, the Isi´e reef opening becomes the only direct connection with open ocean in the studied area. A shift in phase is observed in the N’Digoro site: the internal exchanges processes within the lagoon due to filling at flood tide are delayed in theWallsimulation as the input section for ocean waters is reduced.
The exchanged water volumes are also strongly enhanced by the presence of a wall reef (see table 7), in particular in the Isi´e site (up to 35% during ebb tide) and through the N’Digoro passage (up to 137% during flood tide). This results in a sign inversion of the total volume exchanged at Isi´e and T´enia sites: the volume balance being a net input for theReferencesimulation becomes a net output in theWallcase. In addition, computations of exchanged volume above the barrier for the complete total cycle are 1.8 to 3.9 times the volumes exchanged an the other sites (see table 7). It is thus demonstrated that, the tidal cross-reef flows play a significant role in the lagoon-reef system dynamics and must be taken into account for any hydrodynamic study of the channel lagoons as the one considered here.
4.2.2 Influence of wave breaking induced cross-reef fluxes
This section is dedicated to the numerical study of the impact of wave-induced cross-reef water fluxes on lagoon dynamics. The twoWave simulations (Hs= 0.3 and 1.2m) presented in section 4.1.3 are used to
characterize the effect of swell forcing on the lagoon dynamics. A first qualitative analysis is performed in Fig. 10 which compares the lagoon circulation patterns simulated during flood and ebb tides for both
Wavesimulations. In the low wave (Hs= 0.3m) case (Fig. 10, top plots), the effect of wave breaking, which
only occurs for nearly mid to low tide, is restricted to areas close to the reef barrier. One notes that, at the selected times, the flow over the reef is almost systematically inward and does not reverse during the ebb tide as observed for theReference simulation (Fig. 7, top right plot). More complex vortex-like flow patterns can be observed in the sheared zones surrounding the reef openings (Fig. 10, top left plot). In the high wave case (Fig. 10, bottom plots), the effect of the parameterized wave-induced fluxes above the barrier is much more straightforward. During the ebb tide, the additional fluxes caused by wave breaking all along the reef flat force water inputs above the barrier and, as a consequence, push out water in each of the reef openings and passages. During the flood, the cross-reef fluxes above the barrier participate in the
Fig. 9 Tidal current (during ebb and flood) in case of a wall instead of a reef barrier. Velocity (direction and intensity) during (a) the ebb (high water +3h) and (b) during the flood (low water + 3h)
lagoon filling, reduce the surface gradients between interior lagoon and open ocean and thus weaken the flow through Isi´e and T´enia passages.
Quantitative impact of wave-driven flux parameterization on the lagoon dynamics is shown in Fig. 11 which compares the simulated fluxes through reef opening and passages and over the reef for the
Referencesimulation and both Wavecases. The effect is rather small for the low wave case (Hs = 0.3m)
and mostly observed around low tide for small Hs/H ratio. Maximal outflows observed just after low
tide at Isi´e, T´enia and N’Digoro sites are increased by 12, 21 and 57 % in comparison with theReference
simulation, respectively. The absolute value of cross-reef flows remains very weak both in Referenceand 0.3m Wavesimulations but its integrated effects along the whole barrier is significant on the exchanged volumes (see below). The modifications induced in the 1.2mWavesimulation are much more significant. For such incoming wave height, the breaking threshold is exceeded all along the tidal cycle. This induces, (i), a systematically inward positive flow above the reef, (ii), a permanently outflow leaving the lagoon in the N’Digoro passage and, (iii) a shift toward negative values of tide-related oscillations of fluxes calculated in Isi´e and T´enia sites. The increases of maximal outflow for Isi´e, T´enia and N’Digoro sites in comparison to theReferencesimulation are 71, 104 and 346 % respectively.
An ensemble ofWavesimulations has been performed to quantify the dependency of exchanged volumes between lagoon and open ocean at each site on the incoming wave height. The results, shown for ebb, flood and total tidal cycles in Fig 12, confirm the observations made hereinbefore. One notes first that the parameterization of wave-induced fluxes starts to affect the exchanged volumes from incoming wave height around 0.2m. The main trend when wave forcing increases is an increasing input (positive volume) of water over the reef coupled with an increasing output (negative volume) at other sites. For each site, one notes the presence of threshold in term of wave height from which a reversal in flow pattern is observed. For instance, during the flood, the water inputs observed for the Referencesimulation at Isi´e and T´enia are reversed toward a net output of water aroundHs= 1.6 and 1.2m, respectively. During the ebb, the initial
input (resp. ouput) observed at N’Digoro and Platier sites are reversed into output (resp. input) for Hs
around 0.3m. The observed trends are confirmed when computing the total volumes exchanged over a tidal cycle: the cross-reef fluxes induced by wave breaking over the reef enhance the emptying processes at T´enia, Isi´e and N’Digoro sites.
These exchanged volumes can be compared to the total average volume of the considered lagoon area (1.3.109
m3
). Table 8 shows the relative exchanged volume over a complete tidal cycle for the Reference
Fig. 10 Numerical lagoon dynamics for the 0.3m wave case (top plots) and 1.2m wave case (bottom plots). Velocity (direction and intensity) during ebb (high water +3h, left plots) and during the flood (low water + 3h, right plots)
cross-reef fluxes in the exchanges between inner lagoon and open ocean. By the sole effect of tide (Reference
simulation), the exchanged volumes integrated over a complete tide cycle at each site represent less than 1% of the lagoon volume. As wave height increases, this ratio becomes more and more significant, up to 9.4 and 18.75% for the 1.2mWavesimulation at Isi´e and Platier sites, respectively. For the Referencesimulation, the tide-averaged volumes are moving into the lagoon at Isi´e, N’Digoro and T´enia sites and toward the ocean above the barrier at the Platier site. For theWavesimulations, the directions are totally reversed: inflow over the reef barrier and outflows at other sites. The direction as well as the order of magnitude of exchanged volumes are in much better agreement with estimations from in-situ measurements (see section 3.3.2) when considering wave effect in the model. The major contribution of wave-induced fluxes implies important consequences on the age of lagoon waters which are analysed in the next section.
In addition, it has been observed that the tidal dynamics inside the lagoon is also affected by the wave-driven fluxes above the barrier. Indeed, although amplitude of the tidal current in the lagoon are weakly