HAL Id: hal-01460397
https://hal.archives-ouvertes.fr/hal-01460397
Submitted on 3 Feb 2021
HAL is a multi-disciplinary open access
archive for the deposit and dissemination of
sci-entific research documents, whether they are
pub-lished or not. The documents may come from
teaching and research institutions in France or
abroad, or from public or private research centers.
L’archive ouverte pluridisciplinaire HAL, est
destinée au dépôt et à la diffusion de documents
scientifiques de niveau recherche, publiés ou non,
émanant des établissements d’enseignement et de
recherche français ou étrangers, des laboratoires
publics ou privés.
CLIMATIC IMPORTANCE OF THE MODULATION
OF THE 100-KYR CYCLE INFERRED FROM 16-MY
LONG MIOCENE RECORDS
L Beaufort
To cite this version:
L Beaufort. CLIMATIC IMPORTANCE OF THE MODULATION OF THE 100-KYR CYCLE
IN-FERRED FROM 16-MY LONG MIOCENE RECORDS. Paleoceanography, American Geophysical
Union, 1994, 9 (6), pp.821-834. �10.1029/94PA02115�. �hal-01460397�
PALEOCEANOGRAPHY, VOL. 9, NO. 6, PAGES 821-834, DECEMBER 1994
Climatic importance of the modulation of the 100 kyr
cycle inferred from 16 ln.y. long Miocene records
Luc Beaufort
Laboratoire de G6ologie du Quatemaire, CNRS-Luminy, Marseille, France
Abstract. The variations of the amplitude of the 100 kyr cycle are not yet clearly
understood. Although the timing of the appearance of these cycles in the Pleistocene
is well established, very little is known about the occurrence of such cycles and their evolution in most of the Neogene. Two detailed and continuous 16 m.y. long
Miocene records of paleoceanographic significance are analyzed in order to study
the dynamics of the 100 kyr cycle. One record results from counts of the relative
abundance of the calcareous nannoplankton Coccolithus pelagicus in about 1000
samples taken in the Neogene section recovered from Ocean Drilling Program site 747 (southem Indian Ocean). This record, in which the chronologic resolution is ~17 kyr, is interpreted as reflecting migrations of the Antarctic polar front through
time. The record of the wet-bulk density in the same section, which is interpreted as
reflecting variations of paleoproductivity constitutes the second 16 m.y. record. It has a chronologic resolution of 3.5 kyr. The two series reveal the presence of
100 kyr cycle during the Miocene. This cycle is not stable through time and vary similarly in the two series. The amplitude of the 100 kyr cycle fluctuates quasi- periodically with primary periods close to 2.38, 1.14, and 0.8 m.y., equivalent to
those of the modulation of the orbital parameters (obliquity and eccentricity). In
addition, the amplitude of the 100 kyr cycle is stronger during cooler times. The
interactions between climate and modulation of the eccentricity or the obliquity
cycles are good candidates to explain that change in amplitude. It is concluded that
the long term modulation
of the orbital parameter
has a significant influence on
global climate.
Introduction
In the astronomical theory of climate the 100 kyr
cycle (all cycles in the frequency band comprised between
90 and 140 kyr, usually related to the eccentricity system)
occupies the most intriguing place. Although it is the do-
minant cycle recorded by late pleistocene paleoclimatic
proxies [Hays et al., 1976a], it is difficult to explain it in
terms of a direct response to the forcing of the eccentricity.
It has been ascribed to nonlinear feedbacks resulting from
different time constants of the decay and growth of ice
sheets [lmbrie and lrnbrie, 1980], as well as ice
sheet/bedrock dynamics [Oelermans, 1980; Pollard, 1983],
to interaction of different components of the climate sys-
tem [Saltzman, 1987] and to asymmetry of the obliquity
Copyright 1994 by the American Geophysical Union.
Paper number 94PA02115.
0883-8305/94/94PA-02115510.00
cycles [Liu, 1992]. lmbrie et al. [1993] review most of the
possible causes of the presence of the 100 kyr cycle in the
Pleistocene and identify massive northern hemisphere ice
sheets as responsible of that prominent response of the
Earth climate in this frequency band. Most intriguing is the fact that the 100 kyr cycle is not stable through time: it is recorded for the past 0.75 m.y. but not between 0.75
and 1.25 Ma [Pisias and Moore, 1981; Ruddiman et al.,
1986, 1989]; it is expressed in series between 1.6 and 2.1
Ma [Raytoo et al., 1989] and between 4.9 and 5.75 Ma
[Beaufort and Aubry, 1990] but not between 2.1 and 2.75
Ma [Raytoo et al., 1989] and between 5.75 and 6.3 Ma [Beaufort and Aubry, 1990]. Park and Maasch [1993]
found evidence that it did not disappear truly from 1.25 to
0.75 Ma but was instead of lower amplitude than during
the late Pleistocene. The 100 kyr cycle had also been found
in various records from presumably nonglacial periods like
the Cretaceous [e.g., Herbert and Fischer, 1986]. The ques-
tion of why its amplitude varied through time remains un-
solved. The appearance of this cycle in the late Pleistocene
has been ascribed to the large increase in ice volume related
822 BEAUFORT: MODULATION OF THE 100 KYR CYCLE
[ 1992] and to late Neogene uplift in Asia and America by
Raytoo et al. [ 1989] and by Ruddiman and Raytoo [ 1988].
Neither mechanism can, however, explain the apparently
episodic appearance of the 100 kyr cycle.
In order to understand how the amplitude of this cycle
has varied through time, it is necessary to establish a pre-
cise history of their variations through the study of several
million years continuous records. In this study I analyze
two derailed 16 m.y. long records (one paleontologic and
one sedimentologic) of paleoceanographic significance,
which serve to describe for the first time the modulation
(variation of the amplitude) of the 100 kyr cycle over a
long period of time.
Setting and Material
The thick Neogene section recovered from Ocean Drilling Program site 747 on Kerguelen Plateau (southern Indian Ocean) (Figure 1) offers the rare qualities
(continuity and highly derailed chronology ) required for
long time series analysis. A precise chronologic
framework for most of the Miocene section was obtained
through the integration of an excellent paleomagnetic
record [Heider et al., 1992] with biostratigraphic data
(foraminifera, diatoms, and radiolarians) [Schlich et al., 1989]. The most recent age estimates of the magnetic
reversals by Cande and Kent [1992] are used here in order
to update the chronology. This continuous 16 m.y.
sequence spans the interval between 8.8 Ma (Chron C4A)
and 24.7 Ma (Chron C7) with a remarkably constant
sedimentation rate of about 5 m/m.y. (Figure 2). The
diversity of the calcareous nannofossil assemblages is
extremely low. Coccolithus pelagicus, and a few species
belonging to the genus Reticulofenestra (R. minutula, R.
pseudoumbilica, R. fioridana, and R. perplexa) represent
more than 98% of the Miocene assemblages. The first re-
cord corresponds to the counts made by Beaufort and Aubry
[1992] of the ratio betw•n C. pelagicus and the rest of
the assemblages in 936 samples taken at 10 cm sampling
interval corresponding to a chronologic resolution of about
17 kyr (Figure 3). The second is the record of the wet bulk
density determined by the gamma ray attenuation porosity
evaluator (GRAPE), which was measured during leg 120
[Schlich et al., 1992] at a sample spacing of 2 cm corres-
ponding to a chronologic resolution of 3.4 kyr (Figure 3).
ODP site 747 was not doubled HPC, and it is not possible
to make a composite depth scale for these cores. The gap
between the nine cores studied here cannot be estimated.
Any gaps are interpreted to be relatively small because of
the linearity of the sedimentation rate (Figure 2).
Statistical Technics
The statistical techniques used in this paper are stan-
dard procedures based on the Fourier transform, which per-
mits an estimation of the power density spectrum of
Figure 1. Location of Ocean Drilling Program site 747.
The polar front (or Antarctic convergence) is a pronounced
feature of the Antarctic Ocean, located North of the site.
This modern type of circumpolar circulation around Antarctica began prior the Miocene [e.g., Wright et al.
1992a] but the position of the front fluctuated latitudinally
in response to climatic variations [e.g.: Hays et al.,
1976b].
series, the coherency and phase between two series, and filtering of the series at given frequencies (band pass
filtering). The programs used belong to a package written
by D. Paillard (CFR, GiftYvette, France) in a large part inspired from routines of SPECMAP programs and Numerical Recipes [Press et al., 1986]. Spectral estimates
of these records are made using both Blackman-Tukey and
maximum entropy algorithms [e.g., Jenkins and Watts,
40 • 8o • •oo •20 •40
...
Eterggren
et
al.
(1985) ...,,•.-
' '½
23 21 19 17 15 13 11 9 Age (Ma)Figure 2. Sedimentation rate curve at ODP site 747. The
triangles represent the magnetic reversals [Heider et al.,
1992]. The magnetochronology is that of Cande and Kent
[1992] (solid line); for comparison, the sedimentation rate
curve based on the magnetochronology of Berggren et al.
BEAUFORT- MODULATION OF THE 100 KYR CYCLE 823 10 12 •14 (i) 16 18 20 22 24 • >' Wet-bulk
= .E C.pe/agicus (%)
• •
density
(g/cm3) o
o• c•
O 10 30 50 70 90 1.88 1.76
1.65
•l•l•l•l•l•l•l•l•l• ... , .... , .... • .... • .... :.:.:.:.:.:.:.:.:. - _• ...I
--- O
-- •
- ••
-
,Oli•
oceneFigure
3. (Left) Relative
abundance
(%) of Coccolithus
pelagicus
in Miocene
sediments
at ODP site
747,
estimated
from
the
counts
of more
than
200 specimens
in each
of the
936 samples.
(Right)
Wet-
bulk density measured by GRAPE [Schlich et al., 1989]. To be readable the curve was smoothed with
a ten
point
running
average
(the
original
data
set
had
been
used
elsewhere
in this
study).(Left
column)
Magnetic
polarity
log
from
site
747 [Heider
et al., 1992]
(shaded
areas
indicate
noninterpretable
data).
1968, Press et al., 1986]. The maximum 'entropy method
gives
very high resolution
spectra
which
help to precisely
estimate frequencies peaks. With this latter method, however, there is no test for evaluating the significance of
the peaks. Also, an abundance
of spurious
peaks
may be
found when too high an order of resolution is chosen
[Press et al., 1986]. These authors recommend the use of
this algorithm in conjunction with more conservative
methods. The B lackman-Tukey technique is used for this purpose with the maximum entropy because it is usually considered statistically robust, allowing an estimation of
the significance of peaks; it is often used by
paleoclimatologists. The phases and coherencies between series are calculated by Cross-Blackman-Tukey.
A large part of the analysis is also based on band-pass
filtering. The method consists of a convolution with a
Gaussian window. Usually, the two ends of the filtered se-
ries are lost but by using
a cyclic
convolution
it is pos-
sible to recover these lost parts and to present them in the
figures;
however,
because
of uncertainty,
the recovered
parts are not used further in spectral analysis. For compa- rison, other programs and filtering technics have been used
on paleoceanographic time series (recursive filtering and
program of SPECMAP). They produce very similar re-
suits.
The envelopes of the filtered series have been derived
by connecting
the absolute
values
of the maxima
(upper
envelope) and the minima (lower envelope) of the band- pass filtered records. The results obtained with the Hilbert
transform
were compared
with those
obtained
by connec-
ting of maxima and minima. The two methodologies for calculating the envelope produce analogous results.
Significance of the Selected Records
The Coccolithus
pelagicus record
is interpreted
in
terms
of water
mass
movements.
The cold water
species
C. pelagicus
[Mcintyre,
1967;
Braarud,
1979;
Haq, 1980]
was the dominant species in water located south of a front
regarded
as a Miocene
equivalent
of the present
polar
front
(Figure 1), whereas Reticulofenestra pseudoumbilica and
824
BEAUFORT:
MODULATION
OF THE 100 KYR CYCLE
sensitive [Haq, 1980], dominated the more temperate nor-
them waters. Fluctuations in the percentage of C. pelagi-
cus at ODP site 747 (Figure 3) reflect movements of the
southern water mass over this site as well as over nearby
ODP sites 751 and 748, located 300 to 400 km to the south, sites where the abundance increases in C. pelagicus
happened
slightly
before
those
at site 747 and with a
stronger
amplitude
[Beaufort,
1992
also
unpublished
data].
Pleistocene polar front movements in the Antarctic Ocean were linked to climatic variations and indirectly to Antarctic ice volume, and migrations of this front have been recorded between glacial and interglacial stages
(reaching
7 ø in latitude)
[e.g.,
Hays et al., 1976b;
Howard
and Prell, 1992].The wet-bulk density is closely related to the
carbonate content of pelagic sediments and reflects
differences
in packing
between
carbonate
and
non-carbonate
particles
[Herbert
and Mayer, 1991].
A good
correlation
was found between dry- and wet-bulk density and carbonate content in sediment from the nearby ODP site 751
[Howard, 1992; Rack and Palmer-Julson, 1992]. The
variations in carbonate percent in leg 120 sediments (and
hence
physical
properties
fluctuations)
reflect
changing
carbonate
productivity
and dilution
by biogenic
silica
[Howard, 1992; Rack and Palmer-Julson, 1992], the
sediment being composed primarily of calcareous
nannofossils and diatoms. Carbonate variations at site 747 cannot result from dissolution because this site was drilled
by 1695 m of water
depth
well above
the lysocline
and
also because the coccoliths do not present any trace of dissolution. Because the diatoms are known to prefer
nutrient-rich waters in contrast to the calcareous
nannoplankton,
the site 747 wet-bulk density
record
represents
a proxy of paleofertility.
Relations
between
oceanic
productivity
and
climate
in the vicinity
of site
747
during
the Miocene
exist
but are complex
because
changes
in oceanic
productivity
reflect
changes
in global
producti-
vity as well as changes
in ocean
circulation,
but also
local
movements of water masses in the vicinity of a conver-
gence
zone [Beaufort,
1992].
The intricate
climatic
mea-
ning
of this
record
is problematic
but because
of its higher
temporal
resolution,
it can serve
for the validation
of spec-
tral characteristics found in the C. pelagicus record, espe-
cially concerning sample aliasing.
The 100 Kyr Cycle
Spectral
analysis
of both records
(both Blackman-
Tukey
and
maximum
entropy
were
used)
shows
significant
power
rising
at periods
which
closely
correspond
to the
major
terms
of the eccentricity
cycles
(95, 124,404
kyr)
[Berger
and
Loutre,
1991]
(Figure
4 and
5). As the chrono-
logic
resolution
in the wet-bulk
density
record
is 3.4 kyr
(which
is far from 20 kyr), the 100 kyr cycle
found
in the
series cannot result from sample aliasing [Jenkins and Watts, 1968] in the precession frequency band. These re- sults are robust and not dependent on the chronological model used: the same periods were found using the
Berggren
et al. [1985] time scale
[Beaufort
and Aubry,
100 -- - - 80- - - •.. - •:a - -- 20-i •384 ky
Blackman-Tukey
::"
111
ky --- Maximum
Entropy
•..•__480
ky
ky
.94ky
- BW
, , , , I • ' ' ' I ' ' ' '•1 ' ' ' ' I"' '• ' I ' ' ' '
0.005 0.01 0.015 0.02 0.025 Frequency (Cycle. ky -l) 0 0.03 25000 20000 . 15000 b•10000
•
,•' 5000Figure
4. Periodograms
of the entire
series
of abundance
in C. pelagicus
(series
shown
in Figure
2). (Solid
line)
Blackman-Tukey
spectral
analysis
with a prewhitening
of
0.6. (Dashed
line) Maximum
entropy
spectrum
(without
prewhitening).
These
two
independent
methods
of spectral
analysis
reveal
the
same
periods
which
enhance
confidence
in the analysis.
B W is bandwidth,
and small
horizontal
bars
within
peaks
are
the lower
bounds
of one-sided
95 %
confidence intervals attached to estimates of peak heights.
1992]
(which
differs
by about
5% from
the magnetochro-
nology
of Cande
and
Kent
[1992]
used
here;
see
Figure
2).
Finally
these
cycles
are stable
and
are found
in different
parts
of the series.
The same
frequencies
occur
between
16.2 and 20 Ma, which
is the longest
stable
interval
of the
C. pelagicus
record
(i.e.,
where
no long-term
variations
affect
the
spectral
analysis)
(Figure
6), but
also
in other
in-
tervals
[Beaufort
and Aubry, 1992]. The periodogram
(Figure
6) shows
the
presence
of significant
peaks
at 122
and
94.7
kyr which
are
equal
to the
predicted
eccentricity
cycles
(123.8
and 94.7 kyr).
The wet-bulk
density
record
is sampled
finely
enough
(3.5 kyr) to test
the presence
of the precession
and
the
obliquity
cycles
in the series.
However,
in our
series
these
cycles
have
an average
depth
length
of about
10 and
20
1.5 8
, •18 kyr
•
Blackman-Tukey
" ... Maximum Entropy 7i 432
kyr
6 =
1.
250
kyr
5 •
• - !(• kyr
2O01
--rl• • -
-',
25
kyr
39
ky
•'
o.d
o:
....
. . .ø
Frequency (cycle/kyr- •)Figure
5. Periodograms
of the wet-bulk
density
series.
(Solid
line) Blackman-Tukey
spectral
analysis.
(Dashed
BEAUFORT: MODULATION OF THE 100 KYR CYCLE 825 350
300
11
445
ky
250
200150
199ky Blackman-Tukey Maximum Entropy 20000 0 o O.Ol o.o15 0.02 0.03 Frequency (cyde. ky 'l) 122 ky - B W / 94.7 ky 0.005 0.025 15000Figure 6. Periodograms of the longest stationary part of
the coccolith series (16.2 to 20 Ma). Same characteristics than in Figure 4 but Blackman-Tukey without
prewithening. Note the presence of a double peak around
100 kyr (at 94.7 and 122 kyr. (Equivalent periodograms
(not shown) were obtained using other parts of the record
with a lower accuracy because of shorter subseries. In rare
cases no eccentricity cycles were found).
cm. Bioturbation and/or small variations of the
sedimentation rate greatly alter the sharpness and the
resolution of the record of these cycles in the site 747
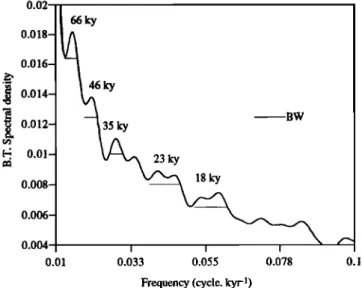
series. Consequently, the peaks in the periodograms in the
high-frequencies band (obliquity and precession) are
extremely weak. For the entire density series a Blackman-
Tukey had been computed with a limited number of lag
(1%) in order to limit the number of spectral estimates in
the high frequency band. The results (Figure 7) show
significant power at 23 and 18 kyr corresponding to
0.02 0.018- 0.016- 0.014-
• 0.012-
0.0•-0'0081
000021
0.01 I I 0.033 O.O55 •BW 0.078 0.1Frequency (cycle. kyr-•)
Figure 7. Periodogram (Blackman-Tukey) of the wet-bulk density record with a reduced number of lags (1% of the series) in order to give a good confidence in the high frequency domain with a sufficient resolution to solve the existence of precession and obliquity signal. Two peaks at 23 and 18 kyr are interpreted to be those of the precession.
precession cycles. The series is filtered with a band-pass
filter
centred
on 1•20
kyr
-1, with
cutting
frequencies
of
1/17 and 1/24 kyr-'. A spectral analysis of the envelope is
then computed which reveal the presence of strong 128 and
114 kyr peaks (Figure 8), which corresponds to the 125
kyr cycle found in the raw data (Figure 5). This
observation correspond to the fact that the eccentricity
cycles modulate the precession cycles [e.g., lmbrie et al.,
1993, Figure 8], and in consequence validate an orbital
imprint in the density series. Also, the increases of the
amplitude of the precession follow those of the eccentricity
as in the Pleistocene [e.g., Park and Maasch, 1993, Figures 11 and 12].
In order to characterize the amplitude variations of the
100 kyr cycle, both records (coccoliths and wet-bulk den-
sity).were filtered with a band pass filter centered on 1/1H
kyr
-1, with
cutting
frequencies
of 1/90
and 1/140
kyr
-1,
and after interpolation of the two records at a constant
time interval of 20 kyr (in the case of the density record all
the measurements belonging to a 20 kyr interval were ave-
raged). It is apparent that the 100 kyr cycle physically
exist in the records (Figure 9) and that the filters respond
even to relatively small amplitude variations. It is also
clear that higher amplitudes of the 100 kyr cycle in the
filtered records correspond also to higher variations in the
original records. The 100 kyr cycles are in phase in the
two records (or with a small non significant lag) (Figure
9c) especially when the cycles have high amplitudes, im-
plying that they respond to the same phenomenon (even
though the original series do not appear to vary in parallel,
at least in the long term).
The envelopes of the filtered series (Figure 10) show
that while the long-term variations of the unprocessed data
appear to be dissimilar, the envelopes of the filtered series
exhibit common features (see below for cross-spectral ana-
lysis tests). Although discrepancies in the amplitude of
• !
736 • Blackman-Tukey
534 kyr ... Maximum Entropy
2
.•
128
kyr
BW
2--i•..
.• 270
k-
r I 114
kyr
0 0.005 0.01 0.015 Freqeuncy (cycle.kyr- l)Figure 8. Periodogram of the envelope of the wet-bulk
density record filtered with band pass filter centered on
1/20 kyr•
1, with cutting
frequencies
of 1/17 and
1/24 kyr ". The presence of a peak at 128 and 114 kyr
show that the precession cycles recorded in the wet-bulk
density record are modulated with period close to 100 kyr
826 BEAUFORT: MODULATION OF THE 100 KYR CYCLE a) lOO lO 60- :,: , ", : . • , ,',•: .
40-
- ø.,.
_20;
o -2o • , , , i , , , , i , , , , i , , , , i , , • , i , , , , i , , , , i , , , , 14.5 15 15.5 16 16.5 17 17.5 18 Age (Ma) -lO 18.5 0.015- 1.90.01
-•
0.005--o--
•_
-o.oox2
1.851.8
•
1.75
,•..
1.7
•
-0.015 I , 1.6 14.• '' I ... 15.0 'l•.• ' ' ' 16.0 '1•.• 'l•; . '1'•.• '1'' 8.0 '18.5 Age 0Via)e)
I•i
I o.o•5
O.Ol'•
i' !: '" ".
'
0.005
o ' ; '! o•
-o.oo5
•
-0.01
.... , -0.015-I
116,,,
•.• , ii
7 .... , ...
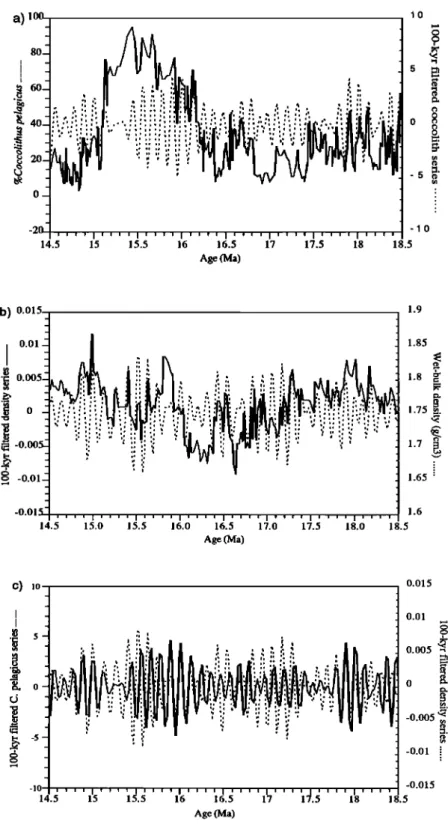
17.5 ll8 18.5 Age 0Via)Figure 9. The 100 kyr cycle in the time domain in a four million years long interval: (a) Comparison
of the percentage of C. pelagicus series and its filtered series with a Gaussian filter centered at 111 kyr
cutting at 90 and 140 kyr. Peaks in the raw data generally correspond to peaks in the filtered series,
pointing to the relative importance of the 100 kyr cycle.(b) Comparison of the density series (each
point correspond to the average of all points contained in 20 kyr intervals) and its filtered series with a
Gaussian filter centered at 111 kyr cutting at 90 and 140 kyr. Peaks in the raw data generally
correspond to peaks in the filtered series, pointing to the relative importance of the 100 kyr cycle. (c)
Comparison of the filtered series of C. pelagicus (solid line) and the filtered density series (dotted line).
BEAUFORT: MODULATION OF THE 100 KYR CYCLE 827 8 '• 4'- Age (Ma) 16 10_ 8 10 12 14 16 18 20 22 24 Age (Ma) 24 - 0.O08 .0 o.oos ,•.• 0.012
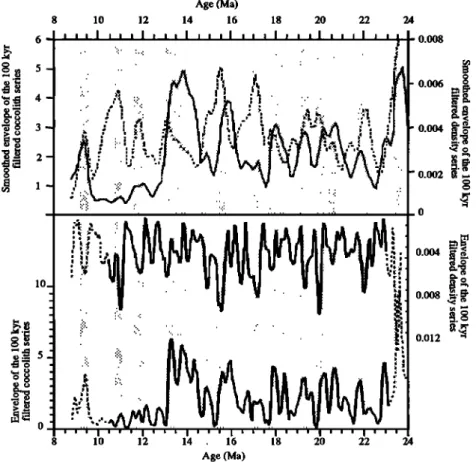
Figure 10. Comparison of the envelope of the 100 kyr filter of the two series: The envelopes of the
111 kyr filter were drawn by connecting the absolute values of the maxima and minima of the filtered
series. Intervals of synchronous high amplitude in the two series are shaded. (Lower graph) The dotted
parts at the two ends of the curves correspond to lost parts of the filters which were recovered by cyclic
convolution. The lower curve is the envelope of the coccolith filter, the upper curve is the envelope of
the
density
filter
(revert
scale).
The
curves
are
mirror
images.
Equivalent
high
frequencies
(--1
m.y.'
1)
are seen in the two curves. (Upper graph) The smoothed envelopes are here consider for comparison of
the longer term similarities. Note that in this uppergraph the density series is not on a revert scale.
some peaks remain, the peaks have the same timing. The amplitude disparities may result from differences in the
original data. For example, the C. pelagicus values are ex-
tremely low between 12.5 and 10 Ma, as are the 100 kyr cycle in this part of this record. In any case the coincidence
of the maxima and minima in these two independent re-
cords whose raw data yield a different pattern, demonstrate
the fact that the 100 kyr cycle varies through time.
The amplitude maxima of the 100 kyr cycle in the filtered C. pelagicus series over the intervals 14-13 Ma,
21.5-20 Ma and 24.2-22.8 Ma correlate with intervals of
high abundance in C. pela•icus and to well-known co-
oling
events
revealed
by 8180 records
(mid-Miocene-co-
oling event between 14-12.6 Ma [Shackleton and Kennett,
1975; Vincent and Killingley, 1985] and
Oligocene/Miocene boundary cooling event at 24 Ma
[Miller and Fairbanks, 1985; Miller et al., 1991].
Amplitude maxima of the 100 kyr cycle correlate with
other
known
high 8180 values.
These
variations
are
global and identified in several Miocene isotopic records
from different oceans and are labeled "Mi" [Miller et al;
1991]. Wright et al. [1992a] identified the Mi events in the
benthic
foraminifera
8180 record
at Site 747. Oxygen
Isotopic Events Mi 1, Mi laa, Mi lb, Mi 2, Mi 3, Mi5,
and Mi6 are synchronous with increases of 100 kyr cycle
amplitudes (Eigure 11): When compared with the relative
increase
of 818-O
(A8180)
for each
8180 peak,
it appears
that
most
of A8180
peaks
(and
consequently
Mi events)
are synchronous of major increases of the 100 kyr cycle
amplitude, but Mi l a and Mi 4 seem not to correspond to
increases of the 100 kyr cycle amplitude. With the coarse
sample
interval
of the 8180 record
(~160
kyr), it is not
possible to use this record directly for the study of the 100 kyr cycle. Estimated Miocene ice volume, inferred from
the
õI80 changes,
fluctuated
between
60 and
90% of the
modem Antarctic ice sheet [Wright et al., 1992b]. All this
indicates
that during
the Miocene
the 100 kyr cycle was
expressed during time of glacial intensifications, just as
they were in the late Pleistocene. However, a major
difference exists between the Miocene and the Pleistocene
glacial environment that is the presence of large northern
hemisphere ice sheet during the Pleistocene. Fluctuations
of the size of the large northern hemisphere ice sheets are
828 BEAUFORT' MODULATION OF THE 100 KYR CYCLE 0.5 1.5 -- 2 • 2.5 • 0.25 0.2
0.15
o.1 0.05 0' 'M[6I
' 'l•'SI
] ] ' I ] [ [ I ' [ [ I [ [ [ I ] ] ] I [ [ [ !
Mil Milaa I I [ I , I, [ , I , I , I , I [ I [ I , I ] [ , I , [ ] [ ] 9 10 11 12 13 14 15 16 17 18 19 20 21 22 23 24 •e (Ma) 1.2 0.4 A 0.2F!l•ure 11. Comparison of the modulation of the 100 kyr cycle and the million year variability of the
$tt•O
record
at ODP Site
747. (Upper)
The $180 record
from
benthic
foraminifera
at site
747 [Wright
et al., 1992a].
(Lower)
Solid
line:
smoothed
A$180
record
obtained
by subtraction
from
the $180
record
of a line going
through
all the
minima
of the
•5180
record
(before
subtraction
the series
were
subsamples with a constant time interval of 50 kyr), dotted line: smoothed and combined 100 kyr
envelope (addition of standardized 100 kyr envelopes of the wet-bulk density and the abundance of C.
pelagicus,).
Mi labels
are
those
of Miller
et al. [1991]
identified
in the
site
747 $180
record
by Wright
et al. [1992a]. Correspondence of most of Mi events and high amplitude of the 100 kyr cycle is
evident.
Pleistocene [lmbrie et al., 1993]. The southern hemisphere
ice sheets should have played the role of their pleistocene
northern counterparts, with fluctuations, large enough (60
to 90%) to induce 100 kyr cycles.
Dynamics of the Modulation of the 100
Kyr Cycle
Spectral analysis were performed on the two envelope
series (which represent the modulation of the eccentricity
cycles in the two series). Frequencies of 2.30, 1.20 and
0.86
m.y.'
1 are
found
in the
C. pelagicus
record
(Figure
12a) and
2.170, 1.615,
1.164,
0.780
m.y-1 and
in the
wet-bulk density record (Figure 12b). From cross-spectral
analysis of the two series it appears that significant cohe-
rency exists at frequencies close to 2.20, 1.30, 0.80, and
0.70
m.y.'
1. The
coherency
confirms
what
I have
called
above similar features between the two records.
From recent and most accurate obliquity and eccentri-
city values [Laskar, 1988; Berger and Loutre, 1991] it is
possible to calculate precisely the modulation terms of
these parameters. The modulation of the eccentricity calcu-
lated from its five most important terms exhibits 10 per- iods. Eight periods fall between 120 and 500 kyr and two periods equal 2.38 m.y. (t3-t5=l/123818-1/130615=t2- t4=1/94782-1/98715). Of the 10 periods of the obliquity
modulation calculated from its five most important terms,
four periods fall between 150 and 190 kyr, three equal 2.38
m.y. (t l-t3 = 1/40392-1/41090= e l-e5 = 1/41090-
1/41811 = e2-e3 = 1/39719-1/40392), two equal 1.19 m.y. (tl-e2 = 1/41090-1/39719 = e3-e5 = 1/40392-
1/41811) and one equals 0.79 m.y. (œ2-œ5 = 1/39719-
1/41811). It should be noted that surprisingly the long terms of the modulation of the obliquity and the
eccentricity are equivalent, a fact that Laskar [1988] finds
as a common feature for the inner planets of the solar
system and corresponds to a strict resonance in the leading
terms of the eccentricity and inclination systems (2E3-2E4
= I3-I4).
The theoretical long-term variations of the Earth's or-
bital parameters cannot be computed for the interval 10-24
BEAUFORT' MODULATION OF THE 100 KYR CYCLE 829 a) 300
• 250
,, ß _• : • 15o --• 100
2300 kyr 0.0003 ... Blaclanan-Tukey • Maximum Entropy ]•[ Bandwidth 120o kyr/ t•'" 860
kyr
0 0.0004 0.0008 0.0012 0.0016 Frequency (cycle/kyr) 4OOO 3500 o o.oo2 o.oo42170 kyr , • • Maxinmm Entrop9
... Blaclrarmn-Tukey 0.0035
0.00025
! ! Bandwidth
0.0030.0002
780,•kyr
625
kyr
0.0025
"
.. ::0.00015
1615 kyr '' •, : :
' ' ',0.002
',
:' '. 1164kyr
--
•5.oo
lO-S
0.0005
0 0 I ' ' ' • 0.0004' ' '0.0008 ' ' 0.0012 , , , • , , , , 0 0.0016 0.002 Frequency (cycle/kyr) c) 3.5 . . 3g'
2.5
• 1.5
1-'.
0.5: 0 4545 kyr ,', , , ': , , : , ß ß , . , , , , , • , 2380 Icyr'1
.:•:
1615
kyr
j
ø' "ø
[ ø'
F'-i---,
0.0004 0.0008 0.0012 0.0016 Frequency (cycle/kyr) • Maximum Entropy ... Blackman-Tukey ] [ Bandwidth 160 140120
80
60 20 0 0.002Figure
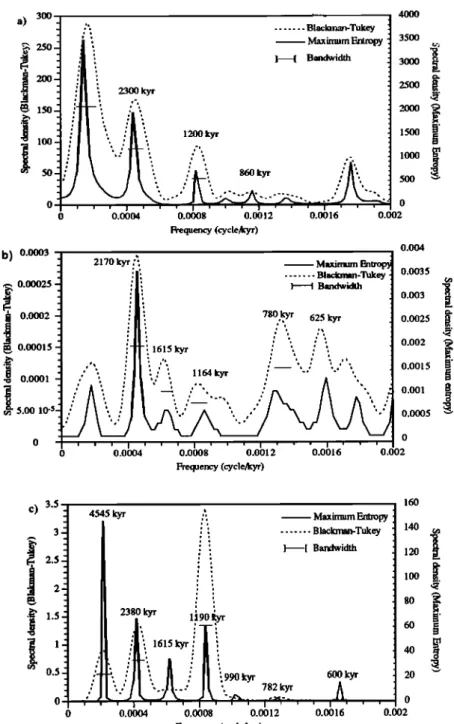
12. Periodograms
(Blackman-Tukey:
solid
line; and maximum
entropy:
dotted
line) of the
modulation
series.
(a) Analysis
of the modulation
of the 100 kyr cycle
in the C. pelagicus
series.
(b)
Analysis
of the modulation
of the 100 kyr cycle
in the density
series.(c)
Analysis
of the modulation
of the obliquity.
in the Miocene with theoretical frequencies, the envelope
(absolute value of minima and maxima of a curve) of the
obliquity
for the last
4.76 Ma is taken
from the estimation
of Berger and Loutre [1991] and replicated down to 24 Ma.
A duration of the 4.76 m.y. is chosen because it corres-
ponds
to the smallest
common
multiple
of the major
mo-
dulating frequencies of the obliquity (i.e. 4.76=2x2.38=4xl.19=6x.79). Also, since these long-term
frequencies
are expected
to be stable
for a time longer
than
24 Ma, the record is assumed to be reiterated identically
every 4.76 m.y.. Spectral analysis were performed after in- terpolation with a 20 kyr spacing. The major modulating frequencies are found as expected (Figure 12c). Cross-spec- tral analysis between the two records from ODP site 747 shows high coherencies at these frequencies, implying a
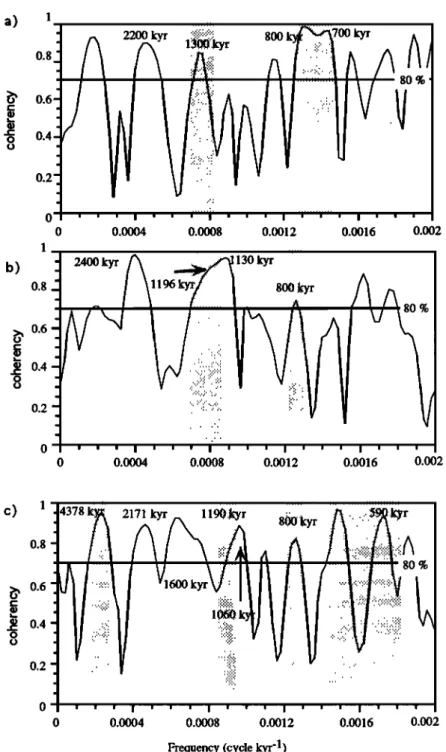
link between the series (Figure 13).
In the three envelope series (coccoliths, density, and
obliquity), the 1190 and 800 kyr cycles are in phase (shaded area in the coherency figures). A physical link
830 BEAUFORT: MODULATION OF THE 100 KYR CYCLE a) 1 0.8 0.6 0.4 0.2 0 0 0.0004 0.0008 0.0012 0.0016 0.002 1
1196
•ii:'
8•i!::!i
,,,
0.8 0.2 0 0 0.0004 0.0008 0.0012 0.0016 0.002 I'l'l'l'l'l'l'('l'"l'l'l'I'l'l'l't'l'l'l'l'l'l'Ic)
1.
0.8• 0.6
• 0.4
0.24378
It./...'
A 21••/•1••••
0 ' " .... ' I 0 0.00041600
kyr•
... :.::::::::: ... :':':':':':' :i:i:i:i:!:i ß ... .:.:.:.:.:.: i:i:!:i:i:i: :.:.:.:.:.:. ' ' I ' ' ' I ' 0.0008 0.0012Frequency (cycle kyr -1)
I I I I
0.0016 0.002
Figure 13. Cross
spectral
analysis
(Blackman-Tukey)
of the envelope
series:
the horizontal
line
represents
the 80% confidence
interval
level;
and
the shaded
area
indicates
the frequencies
at which
the
phase
is close
to zero.
(a) Analysis
of C. pelagicus
versus
the density
envelope
series.
(b) Analysis
of
C. pelagicus versus the obliquity envelope series. (c) Analysis of density versus obliquity envelope series.
2380 kyr cycles are out of phase. Therefore the response is
nonlinear at this frequency. An explanation to this may be
found in the fact that the 800 kyr cycle is weak in the en-
velope of the obliquity and stronger in the envelopes of the
coccolith and density series (this strong 800 kyr cycle can
result from enhancement of the 400 kyr cycle). The com-
bination of the 800 and the 1190 kyr cycles give rise also
to a 2380 kyr cycle. Therefore the original 2380 kyr cycle
may shift in phase due to difference in the strength of the
800 kyr cycle. In Figure 14 the three envelopes were filte-
red at the three frequencies (2.38, 1.19, and 0.79 m.y.).
The resulting filters were added in each series, in order to
reconstruct the ideal variations with these three compo-
nents only. For the envelope of the obliquity the 800 kyr
filter is multiplied arbitrarily by 10 before the computa-
BEAUFORT: MODULATION OF THE 100 KYR CYCLE 831 a) 0.2 24.6
0.
I
:. ,,• • ,,, 24.4
,' t{m ,....• •
i
•
23.8
-0.2 23.6 -0.3 23.4 Age (Ma) b) 0.2 ß 0.1 -0.2 -0.3 ... I ' ' ' 10 12 14 16 18 0.001o.ooo•
• •
o"
-0.0005
, -0.001 20 22 24 Age (Ma) 0.8 0.2 0.6 o 0.1 , 0.4o.
I
o
-•
• -0.2-
•
-0.4.?
-0.2
-0.6 ... -0.310
112 114'
' 116 118 J0
d2
24
Age (Ma)Figure
14. Comparison
of the
combined
terms
of the
obliquity
modulating
system
in the
different
series.
The
envelope
of each
series
is filtered
at 2.38,
1.19,
and
0.79
m.y.
and
for each
series
the
three
filtered
series
are
added
together.
In the
case
of the
obliquity
the
envelope
of the
0.8 m.y.
filter
was
multiplied
by l0 before
addition
in order
to enhance
this
signal.
(a) Comparison
of the
unprocessed
envelope
of the obliquity
system
with
the transformed
obliquity
envelope.
(b) comparison
of the
filtered
density
envelope
versus
the
filtered
and
transformed
obliquity
envelope.
(c) Comparison
of the
filtered
coccolith
envelope
versus
the
filtered
and
transformed
obliquity
envelope.
kyr cycles
have
been
shifted
from
the original
envelope
of
the obliquity, and a good match exists between the three
resulting
series
(Figures
14b
and
14c).
Another
possibility
for coherency
without
phase
at 2380 kyr period,
could
re-
suit from the fact that the obliquity
and the eccentricity
systems
have
both
a modulating
period
of 2380 kyr not in
phase with each other.Interpretations
The periods
of the modulation
of the 100 kyr cycle
recorded
in ODP Site 747 sediments
are equivalent
to the
predicted
values,
suggesting
a forcing
from one of the two
systems (obliquity or eccentricity) or from the two combi- ned.
832 BEAUFORT: MODULATION OF THE 100 KYR CYCLE
1. A control of the eccentricity is the most natural ex-
planation: an increase of the eccentricity would result in
larger 100 kyr cycles recorded in the sediment. However,
this hypothesis is not without problems. Most of the po-
wer of the modulation of the eccentricity cycle is concen-
trated between 120 and 500 kyr, so that the modulation forcing of the 2.38 m.y. cycle is not strong. Also, during
the last million year the amplitude of the eccentricity was
generally lower than between 1 and 2 Ma [Berger and
Loutre, 1991, Figures 4a and 5a]. Thus, the appearance of
100 kyr cycle in the late Pleistocene may not be explained
by an increase of the amplitude of the eccentricity (but this
does not mean that this is not true for the Miocene).
Finally, periods of 1.19 and 0.79 m.y. are not evident in
the eccentricity modulation system (but they are harmonics
of 2.38 m.y.). Thus the presence of strong 403 kyr cycles
which are eccentricity related, at ODP Site 747, argues in
favor of a scenario in which the eccentricity plays a signi-
ticant role.
2. The comparison of the recorded 100 kyr modulation
with the obliquity
system
is particularly
promising.
The
obliquity modulation is especially pronounced on the long term frequency band and yields three major periods. They are all found in the 100 kyr modulation spectrum of the Site 747 series. A good correlation exists between the dif-
ferent modulation curves, especially between the C. pelagi-
cus record and the theoretical obliquity curves (Figure 14).
Cross-spectral analysis shows significant coherency of the two sedimentary series with the obliquity for the modula-
ting periods (Figure 13).
This explanation is also supported by the fact that the amplitude of the obliquity cycle has increased since 0.8 Ma
[Berger
and Loutre, 1991,
Figure
4b] correlatively
to the
amplitude
of the 100 kyr cycle
recorded
by paleoclimatic
markers [?isias and Moore, 1981; Ruddiman et al., 1986,
1989].
Another piece of evidence that shows the importance of the modulation of the obliquity system is the existence of 160 to 200 kyr cycles in several paleoclimatic series (Herbert and Fischer [1986], Briskin and Harrell [1980], Tiwary [1987], among others, including this paper's series shown in Figures 4,5, and 6) from which 100 kyr cycle
were also recorded. Liu [1992] found also a 185 kyr cycle
in the asymmetry of the obliquity cycle. The modulation of the obliquity cycles may explain the presence of these
200 kyr cycles because four of the 10 most important
terms of the modulation of the obliquity fall into this range of frequency, 175 kyr being the major one.
An obliquity related modulation of the 100 kyr cycle may be explained theoretically in two different ways. (1) The first is direct (astronomic) and is related to the new theory of Liu [1992], who has recently shown that an asymmetry in the 41 kyr cycle gives rise to a 100 kyr cycle, which would have a significant effect on the decay and growth of ice sheets. In this case, the 100 kyr cycle would be directly modulated by the periods specific to the obliquity system (to which this 100 kyr cycle belongs).
However, the clear link existing between precession and
eccentricity observed in the wet-bulk density record, in the absence of a strong obliquity signal does not support this
hypothesis. (2) The second is indirect (climatic). The for-
cing of the obliquity on climate has a stronger effect at
high latitudes where ice sheets form. An increase of the
amplitude of the obliquity cycle would favor a long-term
increase of ice-sheets: Pisias et al. [1990] speculated on an
obliquity-linked mechanism enhancing the ice growth.
With larger ice-sheets the nonlinear response of climate on
the 100
kyr
-1 frequency
band
[lmbrie
and
lmbrie,
1980;
lmbrie et al., 1993] would be increased.
3. It is also possible that the obliquity and eccentricity
systems act together in the modulation of the 100 kyr
cycle. The 2.38 m.y. cycle exists in both systems and the
0.79 m.y. cycle is very close to 2x403 kyr.
4. Whatever the modulation mechanism is, internal pro-
cesses such as tectonic uplift and change of topography of
the global ocean (e.g. opening of the Panama Isthmus
[Keigwin, 1978]) which are not cyclic events, could have
more dramatic effects on climate and therefore on the 100 kyr cycle than the modulation. The best evidence for that
is the fact that the 100 kyr cycle is stronger during the
Pleistocene than at any other time in the Neogene. The
modulation could force the timing of the response to such
a strong event. In addition, the forcing of the modulation
would be climatically important in the absence of a pro-
nounced event.
Conclusions
The main conclusion of this study include the following:
1. The presence of the 100 kyr cycle in the climatic re-
cord is not a feature specific of the late Pleistocene. It is
not possible with the two records presented here, to com-
pare the magnitude of the amplitude of the 100 kyr cycle
from the Pleistocene and the Miocene, although it is pro-
bable that the imprint of these cycles was weaker during
the Miocene. As for the late Pleistocene, the Miocene
100 kyr cycle has stronger amplitudes during glacial time
as inferred
from
•5180
records
(Mi events
of Miller et al.,
[1991]). It is therefore suspected that the 100 cycle and the
MI events have a common origin. Theories which account
for the 100 kyr strength in the Pleistocene [e.g., lmbrie
and lmbrie, 1980; Saltzman, 1987; Liu, 1992] are also te-
nable for the Miocene. However, during the Miocene the 100 kyr cycle would have been related to fluctuations of
the southern hemisphere ice sheets.
2. The 100 kyr cycle appears episodically on a million
year scale. The uplift theory of glacial intensification [Ruddiman et al., 1986; Raymo et al., 1989] cannot ac-
count for fluctuations on such short scales but could ac-
count for longer-term glacial increases. Modeling by
Saltzman and Maasch [1990, 1991] and Saltzman and
Verbitsky [1992] shows that a decreasing mean level of atmospheric CO2 would result in the appearance of the
100 kyr cycle in the late Pleistocene. This atmospheric
CO2 lowering was seen as a possible "result of rapidly
uplifted topography" [Saltzman and Maasch, 1991, p. 324], if so, the dynamics of the uplift must be more
BEAUFORT: MODULATION OF THE 100 KYR CYCLE 833
episodic than regular to account for the recurrent 100 kyr
episodes observed here.
3. The amplitude of 100 kyr cycle varies quasi-periodi-
cally with frequencies equivalent to those of the modula-
tion of the orbital parameters (obliquity and eccentricity).
Unless it responds to orbital forcing, tectonics alone can-
not be the leading factor of climatic variations on the mil-
lion year scale. The modulation of orbital parameters may
act as a catalyzer for climates: when the amplitude of the
obliquity and/or the eccentricity cycles exceeds a given
threshold, the chances of glacial initiation are increased.
These long-term variations in the orbital system are super-
imposed on the effect of other important phenomena such
as tectonics (e.g., Asian uplift), and act in synergy with it,
thus regulating the timing of the occurrence of long term
climatic effects. Therefore the study of the modulation of
the 100 kyr cycle should open new horizons on the dating
and the understanding of climate changes on the order of the million years scale.
Acknowledgments. I thank J. Imbrie for helpful discus-
sions and suggestions and M.-P. Aubry for her constant sup-
port and discussions. Reviews by M.-P. Aubry, F. Bassinot,
W.A Berggren, S. D'Hont, T. D. Herbert, Y. Lancelot, J. G.
Ogg, J. Park, E. Vincent, and an anonymous reviewer greatly improved early draft manuscript. This work was supported by
the INSU-DBT Thb•me II program (LGQ contribution N ø
95001).
References
Beaufort, L., Dynamique du nannoplancton calcaire au cours du N6og•ne, Doc. Lab. Geol. Lyon, 121, pp. 141, 1992. Beaufort, L., and M.-P. Aubry, Paleoceanographic implica-
tions of a 17-M.Y. long record of high-latitude Miocene calcareous nannoplankton fluctuations, Proc. Ocean Drilling Program Sci. Results, 120, 539-549, 1992. Beaufort, L., and M.-P. Aubry, Fluctuations in the composi-
tion of late Miocene calcareous nannofossil assemblages as a response to orbital forcing, Paleoceanography, 5,
845-865, 1990.
Berger, A. and M.F. Loutre, Insolation values for the climate of the last 10 million years, Quat. $ci. Rev., 10, 297-317,
1991.
Berggren, W.A., D.V. Kent, and J.A. Van Couvering, Neogene geochronology and chronostratigraphy, in The chronology of the geological record, edited by N.J. Snelling, Geol. Soc. London Spec. Pap. 10, 1985. Braarud, T., The temperature range of the non-motile stage of
Coccolithus pelagicus in the North Atlantic region, Br. Phycol. J., 14, 349-352, 1979.
Briskin, M. and J. Harrell, Time-series analysis of the Pleistocene deep-sea palcoclimatic record, Mar. Geol., 36,
1-22, 1980.
Cande, S.C. and D.V. Kent, A new geomagnetic polarity time- scale for the late Cretaceous and Cenozoic, J. Geophys.
Res., 97, 13.917-13.952, 1992.
Haq, B.U., Biogeographic history of Miocene calcareous nan- noplankton and paleoceanography of the Atlantic ocean, Micropaleontology, 26, 414-443, 1980.
Hays, J.D., J. Imbrie, and N.J. Shackleton, Variations in the Earth's orbit: Pacemaker of the ice ages, Science, 194,
1121-1132, 1976a.
Hays, J.D., J.A. Lozano, N. Shackleton, and G. Irving,
Reconstruction of the Atlantic and Western Indian sectors
of the 18,000 B.P. Antarctic Oceans, in Investigations of the Late Quaternary Paleoceanography and Paleoclimatology, edited by R. M. Cline and J.D. Hays,
Geol. Soc. Am. Mere., 145, 337-372, 1976b.
Heider, F., B. Leidner, and H. Inokuchi, High southern latitude magnetostratigraphy and rock magnetic properties of sediments from sites 747, 749 and 751, Proc. Ocean Drill. Program, Sci. Res., 120, 225-245, 1992.
Herbert, T.D., and A.G. Fischer, Milankovitch climatic origin of mid-Cretaceous black shale rhythms in central Italy, Nature, 321, 739-743, 1986.
Herbert, T.D., and L.A. Mayer, Long climatic time series from sediment physical property measurements, J. Sediment. Pet., 61, 1089-1108, 1991.
Howard, W.R., Carbonate sedimentation during the Miocene and Pliocene on the Southern Kerguelen Plateau (site 751), Proc. Ocean Drill. Program Sci. Res., 120, 1073-1077,
1992.
Howard, W.R., and W.L. Prell, Late Quaternary surface circula- tion of the southern Indian Ocean and its relationship to orbital variations, Paleoceanography, 7, 79-118, 1992. Imbrie, J. and J.Z. Imbrie, Modeling the climate response to
orbital variations, Science, 207, 943-953, 1980.
Imbrie, J., A. Berger, E.A. Boyle, S.C. Clemens, A. Duffy, W.R. Howard, G. Kukla, J. Kutzbach, D.G. Martison, A.
Mcintyre, A.C. Mix, B. Molfino, J.J. Morley, L.C.
Peterson, N.G. Pisias, W.L. Prell, M.E. Raymo, N.J. Shackleton, and J.R. Toggweiler, On the structure and ori- gin of major glaciation cycles, 2, The 100,000 -year cycle, Paleoceanography, 8, 699-736, 1993.
Jenkins, G.M., and D.G. Watts, Spectral Analysis and Its Applications, 525 pp., Holden-Day, San Francisco, Calif.,
1968.
Keigwin, L.D., Pliocene closing of the Isthmus of Panama, based on biostratigraphic evidence from nearby Pacific Ocean and Caribbean Sea cores, Geology, 6, 630-634,
1978.
Laskar, J., Secular evolution of the solar system over 10 mil- lion years, Astron. Astrophys., 198, 341-362, 1988. Liu, H.-S., Frequency variations of the Earth's obliquity and
the 100-kyr ice-age cycles, Nature, 358, 397-399, 1992. Mcintyre, A., Coccoliths as palcoclimatic indicators of
Pleistocene glaciation, Science, 158, 1314-1317, 1967. Miller, K.G., and R.G. Fairbanks, Oligocene to Miocene car-
bon isotope cycles and abyssal circulation changes, in The Carbon Cycle and Atmospheric C02: Natural Variations Archean to Present, Geophys.Monogr. Ser. Vol. 32, edited by E.T. Sundquist and W.S. Broecker, pp. 469-486, AGU, Washington, D.C., 1985.
Miller, K.G., J.D. Wright, and A.N. Brower, Oligocene to Miocene stable isotope stratigraphy and planktonic fora- minifer biostratigraphy of the Sierra Leone Rise (DSDP site 366 and ODP site 667), Proc. Ocean Drill. Program, Sci.
Res., 108, 279-294, 1989.
Miller, K.G., J.D. Wright, and R.G. Fairbanks, Unlocking the icehouse: Oligocene-Miocene oxygen isotope, eustasy and margin erosion, J. Geophys. Res., 96, 6829-6848,
1991.
Oelermans, J., Model experiments on the 100,000-yr glacial cycle, Nature, 287, 430-432, 1980.
Park, J., and K. Maasch, Plio-Pleistocene time evolution of the 100-kyr cycle in marine paleoclimate records, J. Geophys. Res., 98, 447-461, 1993.
![Figure 2. Sedimentation rate curve at ODP site 747. The triangles represent the magnetic reversals [Heider et al., 1992]](https://thumb-eu.123doks.com/thumbv2/123doknet/13687492.432125/3.889.456.809.724.997/figure-sedimentation-curve-triangles-represent-magnetic-reversals-heider.webp)