HAL Id: hal-02333098
https://hal.archives-ouvertes.fr/hal-02333098
Submitted on 25 Oct 2019HAL is a multi-disciplinary open access archive for the deposit and dissemination of sci-entific research documents, whether they are pub-lished or not. The documents may come from teaching and research institutions in France or abroad, or from public or private research centers.
L’archive ouverte pluridisciplinaire HAL, est destinée au dépôt et à la diffusion de documents scientifiques de niveau recherche, publiés ou non, émanant des établissements d’enseignement et de recherche français ou étrangers, des laboratoires publics ou privés.
endemic Corsicanpine forests
Adrien Taudiere, Jean-Michel Bellanger, Christopher Carcaillet, Laetitia
Hugot, Finn Kjellberg, Aarón Lecanda, Annick Lesne, Pierre-Arthur Moreau,
Karin Scharmann, Sebastian Leidel, et al.
To cite this version:
Adrien Taudiere, Jean-Michel Bellanger, Christopher Carcaillet, Laetitia Hugot, Finn Kjellberg, et al.. Diversity of foliar endophytic ascomycetes in the endemic Corsicanpine forests. Fungal Ecology, Elsevier, 2018, 36, pp.128-140. �10.1016/j.funeco.2018.07.008�. �hal-02333098�
Diversity of foliar endophytic ascomycetes in the endemic Corsican pine forests
Adrien Taudiere a, b, *, Jean-Michel Bellanger a, Christopher Carcaillet b, c, Laetitia Hugot d, Finn Kjellberg a, Aaron Lecanda e, Annick Lesne f, g, Pierre-Arthur Moreau h, Karin
Scharmann e, Sebastian Leidel e, Franck Richard a, *
a UMR 5175 CEFE CNRS - Université de Montpellier - Universite Paul Valery Montpellier 3 - EPHE e IRD - INSERM, Campus CNRS, 1919 Route de Mende, Montpellier, F-34293, France
b Ecole Pratique des Hautes Etudes (EPHE) & Paris Research University, Paris, France c Laboratoire d'Ecologie des Hydrosystèmes Naturels et Anthropisés (UMR5023 CNRS), Universite Lyon 1, Villeurbanne Cedex, France
d Conservatoire Botanique National de Corse, Route d’Aleria, Corte, 20250, France e Max Planck Research Group for RNA Biology, Max Planck Institute for Molecular Biomedicine, Von-Esmarch-Strasse 54, 48149, Muenster, Germany
Sorbonne Universite, CNRS, Laboratoire de Physique Theorique de la Matière Condensée, LPTMC, Paris, F-75252, France
g Institut de Génétique Mol éculaire de Montpellier, University of Montpellier, CNRS, Montpellier, France
h Département de Botanique, Faculté des Sciences Pharmaceutiques et Biologiques, Université Lille - Nord de France B. P. 83, 59006, Lille, Cedex, France
Keywords: Foliar endophyte, Fungi, Community ecology, Metabarcoding, Cyclaneusma minus, Pinus nigra subsp. Laricio, Mediterranean, Endemism, Environmental sequencing
Abstract
Plant leaves host species rich communities of foliar endophytic fungi (FEF). Compared to the other compartments of the plant microbiome, FEF diversity is poorly known. Here we
document the communities of FEF associated with the endemic Corsican pine Pinus nigra subsp. laricio at three sites across its natural range and examine the effect of forest site, tree age and light exposure on FEF composition. Metabarcoding using next-generation sequencing provided 8,243,608 Ascomycota ITS2 sequences clustered into 642 FEF operational
taxonomic units (OTUs). FEF communities did not differ in species richness across sites and tree cohorts, but differed in composition among forest patches and according to tree age. FEF community composition did not correlate with needle location (shade vs full light). Results are robust against the various options of the bioinformatic pipeline specifically developed. This study provides the first picture of FEF diversity in a Mediterranean island and underlines the complementarity of forest massifs for fungal conservation.
1. Introduction
Understanding the full complexity of plants as chimeric structures involving micro and macro-organisms is a critical issue in ecology (Partida-Martinez and Heil, 2011; Vandenkoornhuyse et al., 2015). In particular, while leaves support the entire food web in forest ecosystems, they also represent a key location for interactions between plants and their microbiomes. The phyllosphere microbiome d the community of all microorganisms living on the surface of leaves (epiphytes) or inside (endophytes) d is mainly composed of fungi and bacteria (Christian et al., 2015; Hardoim et al., 2015). These microorganisms are an essential component of the plant extended phenotype (Partida-Martínez and Heil, 2011). They influence plant growth and survival (Friesen et al., 2011; Porras-Alfaro and Bayman, 2011), and mediate plant functional traits (Friesen et al., 2011).
Endophytic microorganisms sensu lato encompass mutualistic (endophytes sensu stricto), pathogenic and commensal bacteria and fungi (Hardoim et al., 2015). Foliar endophytic fungi (FEF) include Basidio- and Chytridiomycetes but are mainly composed of Ascomycota (Table 1, Kembel and Mueller, 2014). Despite their ecological importance, very little is known about the ecology of FEF. In our study, we consider as endophytic all fungi that are present inside apparently sound leaf tissues, without requiring a measurable effect on plant phenotype (endophyte sensu lato; see Hardoim et al., 2015).
The functioning of plants and their associated microorganisms d the holobiont d depends on FEF community composition (Hardoim et al., 2015; Vandenkoornhuyse et al., 2015). FEF provide the plant with protection against various pathogens, herbivory and abiotic stress such
as drought (Porras-Alfaro and Bayman, 2011; Christian et al., 2015). For example, the presence of the fungal endophyte Colletotrichum tropicale reduces the defoliation of Cucumis sativus by leaf-cutting ants (Estrada et al., 2013). These positive interactions between plants and FEF have inspired a wide range of laboratory tests in a quest for new biologically active molecules (e.g. for antitumoral, antibacterial, fungicide activities; reviewed in Kaul et al., 2012 and Mishra et al., 2014) and ambitious industrial developments (e.g. insecticide production; Mousa and Raizada, 2013). In ecology, endophytes are promising model organisms to get a more comprehensive understanding of plant functioning (Vandenkoornhuyse et al., 2015) and to test ecological concepts (Meyer and Leveau, 2012). Moreover, they represent a considerable and largely under-explored microbiota critical for ecosystem functioning (Friesen et al., 2011; Yuan and Chen, 2014; Hardoim et al., 2015).
Previous work has provided some insights into the determinants and the scale of variations in FEF community composition based on culturing mycelium isolates and DNA sequencing, including next-generation sequencing. In a multi-host study (51 host species) in a tropical rainforest, Kembel and Mueller (2014) found that the taxonomic identity of the trees might explain more than half of the variation in composition of FEF communities. Within a tree species, other factors are likely to act, including biotic factors such as host genotype (Balint et al., 2013 , 2015 on populations of Populus balsamifera across USA). Abiotic factors such as altitude (Siddique and Unterseher, 2016) or temperature, as determined by slope orientation, have also been shown to correlate with the composition of FEF communities (Koide et al., 2017). Within individual trees, the composition of FEF communities has been shown to be structured according to (i) the distance between leaves, as FEF communities are more similar between spatially close leaves than between more distant ones (Cordier et al., 2012, on Fagus sylvatica), and (ii) the age of leaves, with old leaves displaying higher FEF diversity than young ones (Helander et al., 1994; Millberg et al., 2015). So far, only a few studies (Table 1) have documented FEF diversity patterns and community variations at different scales, from leaves to forests at the regional scale (Millberg et al., 2015; Oono et al., 2015, 2017; Nguyen et al., 2016; Koide et al., 2017).
Corsican pine (Pinus nigra subsp. laricio) is the emblematic tree species of the fourth largest Mediterranean island. Corsican pine forests are listed among the ecosystems whose conservation is a priority in the European Union Council Directive 92/43/EEC. This Corso-Calabrian-Sicilian-endemic pine dominates mountain landscapes in Corsica between 1200 and 1800 m of altitude (Jeanmonod and Gamisans, 2007). During the last two decades, P. nigra subsp. laricio forests have suffered large wildfires of anthropogenic origin and intensive management of forest timber that together dramatically affected their structure and the associated diversity (e.g. birds, Moneglia et al., 2009). After a long-history of high human pressure on this ecosystem, only a few old-growth stands remain across the Corsica island. The current situation raises conservation concerns as the oldest trees of this very long-lived species host the endemic Corsican nuthatch (Moneglia et al., 2009), but also a remarkable diversity of saproxylic fungi associated with oldgrowth forest, some of which may be relicts from the last
glaciation (Norstedt et al., 2001). However, we have no prediction as to whether these old trees also host a remarkable microbiome in terms of foliar endophytic fungi.
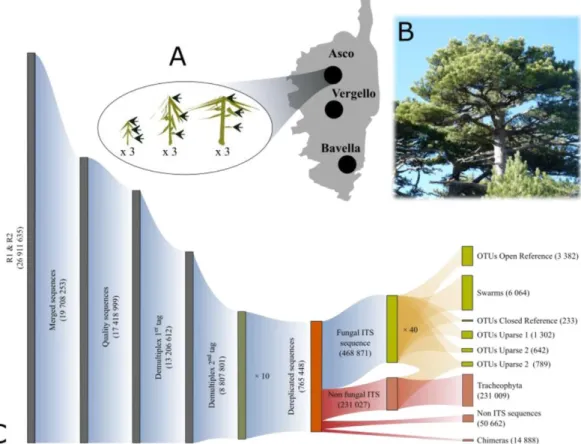
The main objective of our study was to explore the diversity of ascomycete FEF associated with the Corsican pine and the variation in FEF community composition across the lifetime and natural range in Corsica of this long-lived pine species. The available literature prompted us to test (i) whether variation in light exposure and host age correlates with variation in FEF community species richness and diversity, (ii) whether old trees are reservoirs of FEF species, hosting a higher species richness than young trees, and (iii) given the narrow natural range of Corsican pine and the high dispersion capabilities of Ascomycota, whether FEF communities were homogeneous among sites at the same altitude. To answer these questions, we devised a sampling protocol in three old-growth stands distributed across the central mountains of the island and at roughly the same altitude, from the northernmost (Asco) to the southernmost (Bavella) location of its natural range in Corsica. At each of these three sites, we selected individuals varying in age from saplings to several-hundred-year-old trees. For each of them, we explored the composition of FEF communities at three levels of light exposure corresponding to three elevation levels in the tree (Fig. 1A), via a metabarcoding approach using nextgeneration sequencing of environmental samples.
2. Materials and methods 2.1. Sampling procedure
In Corsica, the Corsican black pine (P. nigra subsp. laricio) forms around 16,000 ha of pure woodlands (Moneglia et al., 2009). Across the island, this very long-lived tree species persists in a few oldgrowth stands characterized by unevenly aged individuals (Gamisans and Marzocchi, 1996; Norstedt et al., 2001). In these forests, scattered several-hundred-year-old individuals, some over 400 years-old (Norstedt et al., 2001), dominate a dense understory composed of various cohorts of pines, from deep shade seedlings to mature canopy trees.
In May 2013, we selected three old-growth stands of Corsican pines (forests of Asco [42.3991ºN; 8.9187ºE; 1520 m a.s.l.], Verghello [42.1935ºN; 9.0883ºE; 1390 m a.s.l.] and Bavella [41.7928ºN; 9.2199ºE; 1230 m a.s.l.]; Asco and Bavella are located 70 km apart, Fig. 1A). In each stand, we selected nine individuals including three >250 y-old trees (Fig. 1B, hereafter called old, reaching on average 22, 40 and 18 m high at Asco, Verghello and Bavella, respectively), three 70e130 y-old trees (reaching approximately the same height as the older trees) and three 10e15 y-old trees (young, Fig. 1A), all located at a minimum distance of 50 m from each other. None of the sampled trees was in the shadow of another tree. For each of the 27 selected trees, 1 y-old needles were collected in three contrasting light exposure conditions: (i) full shade understory branches at low elevation in the tree, hereafter called “low”, (ii) tree half-height branches, called “intermediate” and (iii) full light canopy branches, called “high”. In total, we collected 81 needle samples. Each sample consisted of 30 needles collected on three
distinct branches on one year-old shoots, devoid of visible pathogen damage or lichen colonization.
Collected needles were placed in zip-lock plastic bags, transferred a few days later to the laboratory, and prepared for further DNA analysis. In most recent FEF studies, the leaf surface was sterilized before DNA extraction or isolation methods (Table 1) but some older studies mixed epiphytic and endophytic organisms (see Rastogi et al., 2013 for a review on phyllosphere microbiome). To limit contamination by phylloplane fungi and prevent the sequencing of laboratory contaminants, our needle samples were washed for 1 min in diluted bleach (1% final chlorine), then rinsed in deionized water, dried on absorbent paper and assembled as bundles of 30 units. We did not test how effective this treatment was, so it is possible that the samples still contained some phylloplane fungi. Whether the latter should be considered as contaminants or instead as real but so far undetected, fungal endophytes, remains questionable and would deserve a dedicated study. Half-a-centimeter sections were then excised in the middle of each bundle and transferred into 2 mL Eppendorf vials. Samples were frozen in dry ice and pulverized in a Retsch TissueLyser II Ball Mill Homogenizer. One mL of pre-heated (65 C) QIAGEN buffer AP1 (DNeasy Plant Mini Kit©) was then added to each tube and manual grinding with disposable pestles was performed. Tubes were further incubated at 65 C for 2 h, with frequent shaking, to complete homogenization. Total DNA was extracted by adding 0.35 mL CTAB-RNAse buffer (2% CTAB,1% PVP40,1.4 M NaCl, 20 mM EDTA, 0.1 M Tris-HCl pH8, 20 units RNase A) and incubating vials at 37 C for 30 min. Protein and lipid precipitation was achieved by adding 0.5 mL QIAGEN buffer AP2 (DNeasy Plant Mini Kit©), on ice, for 5 min, followed by centrifugation at 8000 g for 10 min. DNAcontaining supernatants were then transferred to new tubes and extracted twice with 1 mL chloroform, to eliminate organic compounds susceptible of inhibiting the DNA polymerase (mostly resin polyphenols). Finally, DNA was precipitated from aqueous fractions with isopropanol, washed twice with 75% ethanol and resuspended in 50 mLTE buffer (50 mM Tris-HCl pH8, 0.5 mM EDTA). Because FEF communities are dominated by Ascomycota, we designed a pair of primers specific for this division (Fw: TTGAACGCACATTGCGCC, Rev: ATCCCTACCTGATCCGAG). We built DNA libraries of Internal Transcribed Spacer 2 (ITS2) by using these primers and Q5 DNA Polymerase (NEB). PCR products were quantified using a Qubit fluorometer (Thermo Fisher). Equal amounts of each sample of DNA were pooled and a sequencing library generated using the NEBNext® Ultra™ DNA Library Prep Kit for Illumina® (NEB), according to the manufacturer's instructions. Sequencing was performed on a MiSeq platform using (2 300 bp) paired-end reads.
2.3. Bioinformatic analysis
The detailed workflow from raw sequences to operational taxonomic unit (hereafter OTU) tables and taxonomic inferences is presented in Figure S1. The associated script is provided in supplementary materials S2. We developed our own bioinformatic pipeline (Figure S1) to take
into account the specificity of our sampling (e.g. the use of new primers specific to Ascomycota) and to assess how different strategies regarding clustering method (Supplementary data SM S3 e S8) and taxonomic assignment (Supplementary data SM 9) affected our conclusions. In short, R1 and R2 sequences were merged using QIIME (join_paired_ends.py command; Caporaso et al., 2010), quality filtered using sickle (single se command, quality threshold -q set to 33), demultiplexed (through a script provided in Balint et al., 2014) and dereplicated. FastQC (Andrews, 2010) quality profiles before and after quality filtering are given in Figures S10 and S11. Chimeras where removed using USEARCH (uchime_ref command; Edgar et al., 2011) with UNITE (Koljalg et al., 2013~ ) as the reference database (dynamic v.7 release of 01-08-2015, which includes numerous endophytic taxa since the work by Nilsson et al., 2014). ITS2 sequences supposed to be non-fungal were removed from the dataset using the ITSx software (Bengtsson-Palme et al., 2013). From the 26,911,635 unmerged sequences, we obtained 468,871 unique fungal ITS2 sequences (Figs. 1C and S1) of length 196.4 ± 6.9 bp (mean ± sd). The nature of the supposedly non-fungal sequences was analyzed separately to understand if they corresponded to annotation errors, amplification artefacts or lack of specificity of the primers.
Fig. 1. (A) Schematic overview of the sampling scheme: at each site on the Corsica island, needles were collected at three elevation levels in the tree (proxy of light exposures) on three young, three mature and three old individual trees. (B) Canopy of centuries-old Corsican pine (Pinus nigra subsp. laricio). (C) Number of sequences/OTUs across the bioinformatic pipeline.
Blue, red and orange ribbons indicate analyzed sequences, discarded sequences and clustering stage, respectively. The detailed pipeline is available in figure S1. “UPARSE 1” strategy retains unique sequences whereas “UPARSE 2” discards all unique sequences before OTU clustering
We used five different clustering methods to define OTUs, namely QIIME closed reference, QIIME open reference, UPARSE including unique sequences (hereafter UPARSE 1), UPARSE discarding unique sequences (hereafter UPARSE 2), and Swarm (Caporaso et al., 2010; Edgar, 2013; Mahe et al., 2015 ). The aim of the clustering step is to merge into one cluster all the sequences belonging to the same putative species (OTU). This step allows reducing the complexity of the sequence dataset and subsequent matching against reference databases. Here we present the results obtained using UPARSE 2 (without unique sequences, 97% identity threshold), a robust and conservative clustering method (Edgar, 2013). The analyses performed using the four other methods produced qualitatively similar results and are presented in the supplementary material (Supplementary data SM 3, 5e8). Each OTUrepresentative sequence was taxonomically assigned in the UNITE database (QIIME release 7.0 dynamic) using RDP classifier (Wang et al., 2007), through the assign_taxonomy.py function available in QIIME (bootstrap threshold 80% as recommended by Claesson et al., 2009). However, we took into account the well-known difficulty of translating ITS-based OTUs into species (Blaalid et al., 2013) by adopting a conservative naming strategy: species names resulting from BLAST analysis were conditionally attributed to a “confer to” (i.e. using “cf.”) name from the reference sequences in UNITE. Comparison of the retained method with three other ones (BLAST, Mothur and UCLUST) is presented in the supplementary material (Supplementary data SM 9). Then, an OTU table was assembled using the function usearch_global (USEARCH). Finally, OTUs were assigned to a putative functional guild (e.g. lichenized) and a trophic mode (e.g. saprotrophic) where possible, using FUNGuild (Nguyen et al., 2015). Statistical analyses of OTU communities were performed using R 3.2.4 (R Core Team, 2016) through the phyloseq package 1.12.2 (McMurdie and Holmes, 2013). In the subsequent analysis, we removed from the dataset samples for which less than 20,000 sequences were obtained, reducing our sample size from 81 to 72. OTUs represented by less than five sequences were also removed, following the recommendations by Brown et al. (2015). We provide a dynamic report script (SM 3) that allows rerunning all the analyses using different filtering parameters, namely the minimum number of sequences per sample, the minimum number of samples per OTU and the minimum number of sequences per OTU.
2.4. Statistical analyses of FEF diversity
The diversity of the community detected within a sample (alpha-diversity) was measured using the unifying notation of Hill numbers (qH; Hill,1973) given by the equation qH(p)¼(Pi
pqi )1/(1q) where pi is the relative abundance of species i. in the community. We used Hill
(inverse of Simpson's concentration index). Hill numbers provide a series of diversity indexes presenting an intuitive meaning as, when all species are equally frequent within a community, the value of the index is equal to the number of species (Jost, 2006). For q ¼ 0, all taxa are counted equally, independently of their abundance so that 0H is equal to the number of species
within a community. For q ¼ 1 or 2, heterogeneity of abundance among species within a community will result in a reduced diversity value comparative to the value of 0H for the same
community. The contribution of rare species to qH decreases as q increases. Using the three indices 0H, 1H and 2H allowed us to dissect the respective contribution of rare and common species to diversity variations.
Hill numbers were calculated using the R package vegan 2.3e4 (Oksanen et al., 2016). The effect of potentially statistically significant explanatory variables on Hill numbers was tested using linear models, ANOVAs and post hoc Tukey HSD tests. We applied the method developed by Balint et al. (2015) to control for differences in sequence number among samples: the square root of the number of reads was the first predictor of diversity metrics used in the linear models. Tukey HSD tests were used to compare Hill numbers between sampling modalities (namely site, tree age, light exposure). OTU accumulation curves were computed using the function rarefy from the package vegan (R script is available in Supplementary data SM 3). Accumulation curves were generated using the dataset including singleton sequences (UPARSE 1, Supplementary data SM 5) to avoid the intrinsic bias due to an artificial elimination of all rare OTUs in reduced datasets.
To explore shifts in community composition among samples, we partitioned the variance between explanatory variables (site, tree age, light exposure and their interactions) using a PERMANOVA on the Bray-Curtis index of dissimilarity (Anderson, 2001). Finally, differences in OTU abundance distributions between samples and between sampling modalities were tested using the DESeq2 package (v. 1.8.2; Love et al., 2014).
3. Results
3.1. Impact of clustering methods on FEF diversity
In total, we found between 251 and 9325 OTUs (without singletons) depending on the clustering method (Table 2) despite using identical filtering parameters (number of sequences per sample 20,000 and number of sequences per OTU 5). Nevertheless, the patterns of within- and among-sample diversity did not depend on the clustering method (Supplementary data SM S3 e S8). FEF are poorly represented in sequence databases. As a consequence, the closed reference clustering method removed too much information to be useful as it retains only sequences that match one of the sequences belonging to a reference collection (Table 2). We hereafter report the detailed results for the most conservative de
novo clustering method, UPARSE without unique sequences. We adopted this conservative choice because a high number of OTUs defined using less conservative clustering methods were assigned by the RDP classifier to the same species.
ITSx recognized a number of sequences as vascular plant sequences (231,009 unique sequences). These were mainly wrongly annotated sequences in the database as the primers used were specific to Ascomycota. Indeed the most abundant of these sequences were assigned without ambiguity to fungal sequences in the UNITE database (100% identity). Out of a total of 789 OTUs detected using UPARSE without unique sequences, 33 (4%), representing 5516 sequences (0.7% of the sequences) were assigned to the genus Pinus. Upon deeper examination, all these sequences turned out to be chimeric between Pinus ITS and ascomycete ITS. The Pinus ITS portion was the one directly amplified by the forward primer, i.e. the one located in the most conserved 5.8S rDNA gene. Including or excluding the sequences assigned to vascular plants by ITSx in the dataset did not affect our conclusions (Fig. 1, Table 2, Supplementary data SM 4). We chose the conservative option of presenting here the results using the dataset in which all the sequences of dubious assignment according to ITSx were excluded. Hence, we report the detailed results for UPARSE without unique sequences and after removing sequences assigned to vascular plants by ITSx.
Table 2
Number of OTUs and associated sequences obtained by various clustering algorithms.
Out of the 662 OTUs found using UPARSE, 20 (accounting for 21,986 sequences, 3% of the total number of sequences) were discarded because either they were present only in samples for which less than 20,000 sequences were obtained (8 OTUs; 21,948 sequences in total) or because they were represented by less than 5 reads (12 OTUs; 38 sequences). After this filtering step, a total of 8,243,608 sequences representing 642 OTUs were assigned to 72 samples (9 samples with less than 20,000 sequences were excluded from the 81 collected samples before analysis). The taxonomic distribution of sequences and OTUs is available online (Supplementary data SM 9).
3.2. Composition of FEF communities of Pinus nigra subsp. laricio
OTUs Sequences OTUs Sequences OTUs Sequences Qiime Open reference 4373 8,398,038 4150 8,397,815 3382 8,373,567
Closed reference 256 6,473,782 251 6,473,777 233 6,460,489 Swarm -d 1 15,479 8,419,809 9325 8,413,655 6064 8,382,948 Uparse -minsize 1 1667 8,335,341 1477 8,335,151 1302 8,312,594
The quality of the assignment, as assessed by the bootstrap procedure from the RDP classifier, did not correlate with the number of sequences representing an OTU (Spearman correlation test: rho ¼ 0.019; p-value ¼ 0.628, Figure S12). Hence, the least abundant fungal species in our data set were not underrepresented in the UNITE database (Figures S12-13).
The species rich community of FEF associated with P. nigra subsp. laricio (642 OTUs, Figs. 1 and 2) was dominated by Dothideomycetes (26.9% of OTUs, 37.8% of sequences) and Leotiomycetes (10.9% of OTUs, 39.7% of sequences). The most represented OTU (2,226,714 sequences, 27% of sequences, Fig. 2) was assigned to Cyclaneusma minus (Leotiomycetes) and is the only OTU present in all 72 retained samples.
Out of 183 OTUs represented by more than 1000 sequences (Figure S14), 61 were assigned to Dothideomycetes, 24 to Leotiomycetes, 17 to Lecanoromycetes, 16 to Eurotiomycetes, 4 to Sordariomycetes, 1 to Tremellomycetes, and the 60 remaining OTUs could not be assigned at the class taxonomic rank. Among the five most abundant FEF species, two were dominant in pines in general (Sieber, 2007, Table 3). Despite the sequencing depth (8,243,608 usable sequences, see Table 1 for comparison with other studies), rarefied species accumulation curves clearly support the hypothesis of underestimated diversity, for all tested factors (Fig. 3A, Supplementary data SM 3), consistent with previous studies (Zimmerman and Vitousek, 2012; Yang et al., 2016), indicating that 72 samples and 8,243,608 sequences were probably not enough to capture all the diversity of FEF inhabiting Corsican pine needles.
Fig. 2. Endophytic association patterns between FEF OTUs and Corsican pine (age site) cohorts: site and host age structure FEF communities. The positions of nodes were obtained using the force Atlas 2 algorithms (Jacomy et al., 2014) in the Gephi software (Bastian et al., 2009). Big symbols each represent a set of three pine individuals of the same age (represented by the number of nested symbols) at the same site (represented by the shape and color, see the top left inset). Small circles represent fungal OTUs. Size and color of the circles indicate, respectively, the number of sequences and the class of OTUs (see the top right inset). The color (intensity of blue, see the color bar) of a link between an OTU and a (age site) cohort is .
proportional to the number of sequences for this OTU in this cohort (link weight). C. m.: Cyclaneusma minus
3.3. Assignment of FEF diversity of Pinus nigra subsp. laricio to ecological guilds
Only 29% of the OTUs (n ¼ 186, representing 18% of the sequences) were taxonomically assigned to genera of known ecological strategy according to the FUNGuild database (Figure S15). The large majority of these OTUs were classified as saprotrophic (15.6% of the OTUs, accounting for 12% of the sequences), plant parasites (7.1% of the OTUs, accounting for 4.7% of the sequences) or lichenized fungi (3.8% of the OTUs, accounting for 1.1% of the sequences). The remaining 456 OTUs (71%) are either not assigned to a genus by RDP classifier (344 OTUs, 54%) or assigned to a genus whose ecology is not recorded in FUNGuild (122 OTUs,17%).
3.4. Diversity of fungal endophytes across sites, age of trees and light exposure
The number of OTUs per sample, including sequence singletons (bioinformatic strategy UPARSE 1), averaged 295 ± 94 (mean ± sd;
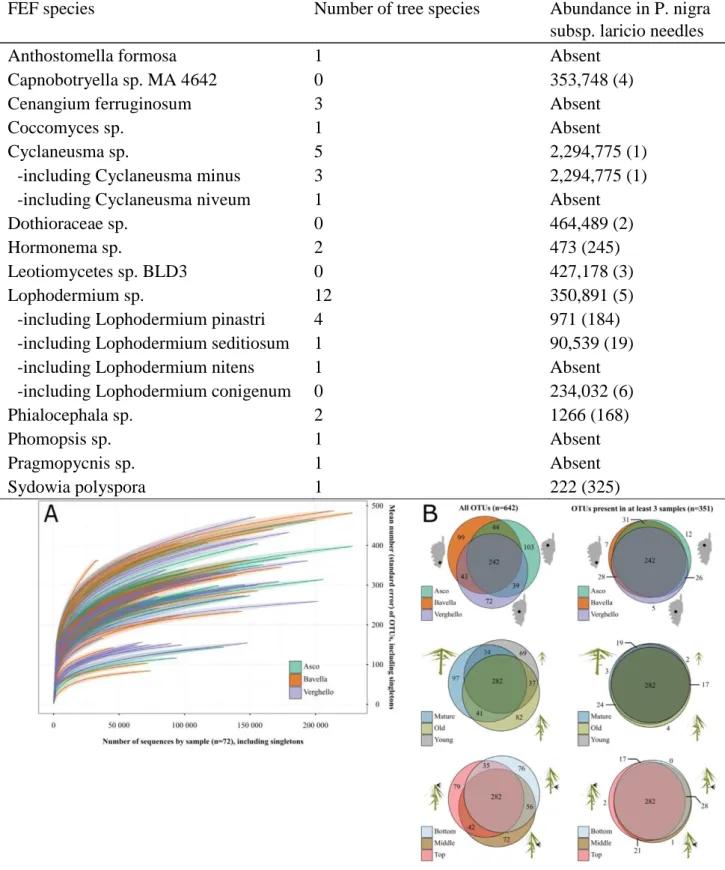
Table 3 Correspondence between the dominant FEF species in the literature and in Pinus nigra subsp. laricio needles. The number of tree species is the number of plants in which each FEF species was recorded as dominant in the review by Sieber (2007). Abundance of species in P. nigra subsp. laricio needles indicates for each species the number of reads in the present analysis with the rank in the community in parentheses.
Fig. 3A). Considering only OTUs represented by more than 5 sequences, the number of endophytic fungal OTUs per sample averaged 108 ± 38. In comparison, the mean observed
FEF species Number of tree species Abundance in P. nigra subsp. laricio needles Anthostomella formosa 1 Absent
Capnobotryella sp. MA 4642 0 353,748 (4) Cenangium ferruginosum 3 Absent
Coccomyces sp. 1 Absent
Cyclaneusma sp. 5 2,294,775 (1) -including Cyclaneusma minus 3 2,294,775 (1) -including Cyclaneusma niveum 1 Absent Dothioraceae sp. 0 464,489 (2)
Hormonema sp. 2 473 (245)
Leotiomycetes sp. BLD3 0 427,178 (3) Lophodermium sp. 12 350,891 (5)
-including Lophodermium pinastri 4 971 (184) -including Lophodermium seditiosum 1 90,539 (19) -including Lophodermium nitens 1 Absent -including Lophodermium conigenum 0 234,032 (6) Phialocephala sp. 2 1266 (168)
Phomopsis sp. 1 Absent
Pragmopycnis sp. 1 Absent
richness per Corsican pine individual (obtained by merging the three samples collected on the individual) averaged 171 ± 43 (data not shown). Individual samples from Asco, Verghello and Bavella sites harbored on average respectively 109 ± 36, 98 ± 37 and 115 ± 39 OTUs (Fig. 4, top panel, Hill number with q ¼ 0). Samples collected in young, mature and old trees, harbored respectively 100 ± 45, 118 ± 28 and 105 ± 36 OTUs (Fig. 4, top panel, for detailed information).
Values of community diversity decreased strongly from index 0He1H and 2H, demonstrating that only a few species had high relative abundances. The
Fig. 3. (A) OTU accumulation curves of the 72 samples. Accumulation curves represent the dataset with singletons (bioinformatic strategy UPARSE 1). Colors indicate sites. Shaded areas indicate two times the estimated standard errors. (B) Effect of site, tree age and light exposure on FEF beta-diversity. Venn diagrams represent the number of shared OTUs between samples for each variable (site, age and elevation in the tree) considering all OTUs (on the left, total number of OTUs: n ¼ 642) or discarding OTUs present in less than three samples (on the right, total number of OTUs: n ¼ 351). Centers and areas of circles were computed using the R package venneuler.
ANOVA on qH values indicated a significant effect of tree age on species richness (0H) and a significant effect of site on diversities 1H and 2H (Table S18). Young trees had significantly lower 0H values than the two other age classes, a result that is explained by the significantly lower value for young trees compared to mature and old trees in Verghello (post hoc Tukey HSD test). Tukey HSD tests evidenced a significantly lower value of 1H at Bavella compared to the two sites while post hoc Tukey HSD tests for the Simpson diversity (Hill number 2H) evidenced a significant decrease from north to south, with significantly different values for all pairwise comparisons (post hoc Tukey HSD test: p-adjust <0.05, Fig. 4 and Table S19 for details.
Fig. 4. Effect of site and tree age on alpha diversity, measured by Hill numbers 0H, 1H and
2H: the site of Asco harbors more diverse FEF communities than Verghello than Bavella.
Black, blue and green colors describe the endophytic communities of young, mature and old trees, respectively. The number of samples by site (n) is indicated below site names.
Different letters (a, b and c) above the panels indicate significant differences (Tukey HSD tests) between the three sites after accounting for differences in sampling size (linear model result in Table S 19), p < 0.05. Neither host age nor light exposure had an impact on
diversity (Tukey HSD tests for the three Hill numbers; p-adjust > 0.05).
3.5. FEF community differentiation among modalities in Pinus nigra subsp. laricio
The number of OTUs shared between modalities was remarkably similar for the three tested modalities (Fig. 3B). In all, 242 OTUs out of 642 (38%, Fig. 3B) were present at all sites, 282 OTUs (44%) are shared by the three plant cohorts (young, mature, old-growth) and 282 OTUs are found at the three light exposure conditions (low, intermediate, high). When considering
only OTUs detected in three samples or more, i.e. when removing OTUs that are too infrequent to be detected for the different modalities even if they would have been detected by more intensive sampling, the similarity in OTU composition among treatments was 67% for among site comparisons (242 out of 351 OTUs, and 80% for modalities height within tree and tree age (282 out of 351 OTUs, Fig. 3B).
The PERMANOVA on Bray-Curtis dissimilarities in the composition of FEF communities showed a remarkable grouping of all samples (Fig. 5). Nevertheless there was an obvious (Fig. 5) and significant effect of site (explaining 13.8% of the variance; Table 4, Fig. 2), an effect of host age (explaining 3.9% of variance; Table 4) and their interaction (explaining 9% of variance, Table 4 and Figure S16). Fig. 5 illustrates the difference in community composition among sites, but also at Verghello a difference between young trees on one hand and mature and old trees on the other hand that was also detected for OTU richness (0H). The PERMANOVA detected no effect of light exposure on FEF community composition (Table 4). Considering only frequent OTUs (present in more than 30 samples), removing the hyper-abundant C. minus, or using a presence/absence OTU occurrence table (i.e. not taking into account the number of sequences) yielded very similar PERMANOVA results (Supplementary data SM 3, see also Table S16 for the analysis including the individual tree level). Consequently, both frequent and rare species contributed to the combined effects of site and host age on FEF composition. The number of sequences of 61 OTUs (9.5% of total OTUs) significantly differed among sites (R package DESeq2, Supplementary data SM 3, Figure S17).
OTU assignment to species should be interpreted with caution. The OTUs we identified to species level were scattered throughout the Ascomycota phylogeny (Fig. 6). Each fungal class present in this phylogeny (Dothideomycetes, Eurotiomycetes, Lecanoromycetes, Leotiomycetes and Sordariomycetes) contained at least one frequent (present in a high number of samples) and abundant (high
Fig. 5. Effect of site and tree age on beta diversity. Projection of the non-metric
multidimensional scaling (stresssent OTUs, colors illustrate sites and symbols illustrate tree age. The signi¼ 0.21) of fungal communities. Grey points represent significance of these
effects were assessed by a PERMANOVA (Table 4). See appendix S3 for alternative multivariate analysis.
number of sequences) OTU in Corsican pine needles (Capnobotryella sp. MA 4642, Aspergillus cf. amstelodami, Pseudevernia cf. furfuracea, Lophodermium cf. conigenum and Zalerion cf. arboricola, respectively). Finally, species that were frequent and abundant at one site were also frequent and abundant at the two other sites. Only three OTUs identified to a putative species (Aureobasidium cf. pullulans, Capnobotryella sp. MA 4642 and L. cf. conigenum, Fig. 6) had significantly different relative abundances among sites. Nevertheless, these species were frequent and abundant at all sites. Thus, some abundant species were more abundant at one site but none is site-specific.
4. Discussion
We show that the species composition of FEF communities in the endemic Corsican pine in its natural range varies among sites and to a lesser extent among age classes with a significant interaction between these two factors. We did not evidence any effect of light exposure. The communities varied in Effect of site, host age and light exposure on FEF composition (PERMANOVA). Results with a significant p-value are in bold, p <0.05.species richness, with a reduced diversity in young trees, and showed a decrease in equitability of relative species abundances from north to south among the three sites.
4.1. A high FEF diversity in Corsican pine forests
The present study evidences that P. nigra subsp. laricio is associated with rich FEF communities in its natural range. Despite our highly conservative choices when devising our bioinformatic pipeline (Figure S1, Table 2), the number of detected OTUs in Corsican pine needles is higher than in all previous studies. Whenusing the same clustering methods (UCLUST) and filtering parameters as in previous studies, the FEF diversity detected in P. nigra subsp. laricio forests surpassed those from P. balsamifera (2825 vs 2022; Balint et al., 2015), Pinus monticola (4150 vs 1358; Bullington and Larkin, 2015), F. sylvatica (3214 vs 414; Siddique and Unterseher, 2016) and Eucalyptus grandis (4150 vs 2415; Kemler et al., 2013) forests. The exceptional richness of FEF communities documented here was most probably the result of an exceptional sequencing effort, confirming the conclusion of incomplete sampling in previous studies.
Interestingly, more than eight million sequences (at least twice the number obtained in previous studies; Table 1) and 72 samples (~2160 needles) were not sufficient to capture all the diversity of Ascomycota FEF in the Corsican pine (Fig. 3A, Supplementary data SM 3). This is remarkable when considering (i) the homogeneous study material (healthy needles of a single host species), (ii) the limited differences in community composition among sites and (iii) the limited resolution of ITS alone, which underestimates OTU richness (Gazis et al., 2016). Thus,
our study confirms that NGS often fails to saturate accumulation curves of fungal communities both in soils (see for instance Baptista et al., 2015) and phyllospheres (Kembel and Mueller, 2014). However, lack of saturation does not preclude drawing a set of conclusions from our dataset.
OTU assignment to species should be interpreted with caution. Nevertheless the obtained species assignments make sense. For instance, our results show Corsican pine harbors FEFs known as specialists of pine species (e.g. Lophodermium pinastri). Indeed, the FEF communities we found in Corsican pine needles encompass 5 of the 10 FEF species identified in the review by Sieber (2007) as dominant pine symbionts (Table 3). However, while some were abundant and frequent across samples, some were only present sporadically in our dataset (Table 3). For instance, we found Phialocephala sp. in only four samples (1266 sequences) whereas it dominates the FEF communities associated with Pinus densiflora and Pinus thunbergii densiflora (Sieber, 2007). The two most abundant FEF species associated with the Corsican pine, C. minus and Lophodermiumare widespread species that often dominate FEF communities hosted by various gymnosperms including pines (Sieber, 2007). Hence, despite the highly specialized ecology and very limited range of P. nigra subsp. laricio, its main associates, as far as can be estimated by numbers of reads, are interaction generalist fungi with cosmopolitan distributions.
4.2. FEF communities are little affected by host age
In the uneven-aged forest stands that we studied, Corsican pines of various ages harbored almost the same FEF species diversity: young, mature and old trees host similar numbers of FEF OTUs (Fig. 4) and host FEF communities of only slightly different compositions (Fig. 3B). This result is in marked contrast with a study in Pinus taeda forests (Oono et al., 2015). In even-aged stands, 2 y-old seedlings harbored more than twice as many FEF OTUs as adult
Df Sums of squares Mean of Squares Pseudo F-statistics R2 Pr (>F) Site 2 1.9928 0.99639 5.7795 0.13599 0.0001 Age 3 0.5816 0.29082 1.6869 0.03969 0.0164 Light exposure 3 0.4931 0.24653 1.4300 0.03365 0.0637 Site:Age 4 1.3357 0.33394 1.9370 0.09115 0.0003 Site:Light 4 0.6550 0.16375 0.9498 0.04470 0.5740 Age:Light 4 0.6390 0.15975 0.9266 0.04360 0.6303 Site:Age:Light 8 1.1991 0.14988 0.8694 0.08182 0.8295 Residuals 45 7.7580 0.17240 0.52940 Total 71 14.6543 1.0000
Fig. 6. Distribution of the number of sequences of FEF species at the three study sites and across the phylogeny of Ascomycota: abundant species are scattered in the fungal phylogeny and they are abundant in all three study sites. Each line corresponds to one FEF species combining all OTUs identified with the species name (summing the number of sequences). Thus, only the 82 OTUs taxonomically assigned to 59 species names are represented, accounting for 3.3 million sequences (39.8%). Species for which over 10,000 sequences were obtained are named. Stars indicate OTUs whose abundance significantly differed among sites (DESeq2 package). The number of sequences of OTUs in each sample is represented by the diameter of the circle. Abundance values greater than 10,000 sequences in a sample are indicated by bold contour. Colors indicate fungal classes. The three columns correspond to the three sites, namely Asco, Bavella and Verghello. The phylogeny was built using taxonomy of the UNITE database (Koljalg et al., 2013~ ) and the Open Tree of Life (Hinchliff et al., 2015). Note that branch length is not informative
trees, and the two plant cohorts shared only 14.4% of the total FEF diversity (Oono et al., 2015). This is strikingly different from our results, which revealed that 80% of OTUs present in more than 3 samples (n ¼ 351) were shared by young, mature and old P. nigra subsp. laricio (n ¼ 282; Fig. 3B). We may suggest that with respect to FEF colonization, our 10e15 y-old saplings can already be considered as adult trees, while 2 y-old seedlings are still immature.
Nevertheless we observed an effect of tree age on FEF community composition (MANOVA on Bray-Curtis dissimilarities) and species richness (0H values). These two effects seem to mainly result from a reduced species richness of the FEF community collected from young trees at Verghello.
In our study system, there was a clear site-effect on FEF community composition that could be explained by local founder effect, which could result from local inter-cohort spore transfer, as detected in some other studies (Koide et al., 2017; Oono et al., 2017). Alternatively, we cannot exclude that part of the among-site variation could be explained by variation in ecological conditions. Indeed we detected a north-south reduction in 1H and 2H, suggesting geographically structured increase in the heterogeneity of species abundances. Further studies should investigate variation in the composition of FEF communities depending on whether the forest is facing north or south, as previous studies on other pines have shown that this factor affects FEF community composition (Koide et al., 2017).
4.3. Cyclaneusma minus strongly dominates Pinus nigra subsp. laricio FEF communities
In the studied ecosystem, C. minus accounts for 27% of the total number of sequences (Fig. 2). This species is dominant in the three plant cohorts (with respectively 27.5%, 32.5% and 26.3% of sequences on young, mature and old Corsican pines), for all light exposure conditions (with respectively 28%, 32.1% and 26.1% of sequences in full shade, partial shade and full light conditions) and whatever the site (with respectively 18.4%, 23.8% and 42.9% of sequences at Asco, Verghello and Bavella sites; Supplementary data SM 3). This result supports previous research reporting C. minus to be a dominant species within pine needles (Sieber, 2007). In some situations, this species has been shown to be a fungal pathogen on Pinus spp. (Watt et al., 2012). In our study, we selected only healthy needles after visual inspection for DNA extraction and sequencing. The generalized presence and abundance of this species in leaf tissues without apparent symptoms at the sampling date suggests that C. minus is generally not a pathogen, and that pathogenicity could be mediated by particular environmental conditions (Sieber, 2007; Hardoim et al., 2015). More generally, we have limited confidence in the assignment of our FEF species to ecological guilds as our species were little represented in the FUNGuild database and as functional assignment of such species is difficult.
In Corsica, distinct mountainous valleys support complementary conservation stakes related to local endemism and population fragmentation, as documented for vascular plants (Jeanmonod and Gamisans, 2007), gastropods (Nitz et al., 2010) and fishes (Berrebi, 2015). Nevertheless, the current study suggests that the Corsican pine's most abundant FEF are widespread common species. This result suggests that the most abundant FEFs are highly efficient dispersers and are not strict host specialists. This property may also extend to other fungi associated with P. nigra laricio. Indeed, the high conservation value of the Corsican pine forests for polypore species seems to depend more on the old-growth status of the forests than on the plant species. These results suggest that in fungi high dispersal and specialization at host genus or group of species results in limited endemism. Conservation may rather involve the more difficult task of maintaining rare forest conditions in the Mediterranean, such as old-growth forest stands that are particularly prone to fire.
Acknowledgement
This study was funded by the Conservatoire Botanique National de Corse. We are grateful to the Parc Naturel Regional de Corse (PNRC) for its logistical support and the Office de l’Environnement de la Corse for its financial assistance. We particularly thank Rene Eymerie, Christian Casanova and Dominique Tondini from the PNRC for their precious help during needle sampling expeditions and the Max Planck-Genome-Centre Koln for technical support during li-€ brary preparation. Sample preparation, DNA extraction and ITS2 PCR amplification were achieved at the Genetic Markers in Ecology facility (M.-P. Dubois) of the Centre for Evolutionary and Functional Ecology (CEFE) of Montpellier. All experiments performed in this study comply with the current laws of France.
Supplementary data
Supplementary data related to this article can be found at https://doi.org/10.1016/j.funeco.2018.07.008.
References
Abdelfattah, A., Li Destri Nicosia, M.G., Cacciola, S.O., Droby, S., Schena, L., 2015. Metabarcoding analysis of fungal diversity in the phyllosphere and carposphere of olive (Olea europaea). PLoS One 10, e0131069. https://doi.org/10.1371/ journal.pone.0131069. Anderson, M.J., 2001. A new method for non-parametric multivariate analysis of variance.
Austral Ecol. 26, 32e46. https://doi.org/10.1111/j.14429993.2001.01070.pp.x. Andrews, S., 2010. FastQC: a Quality Control Tool for High Throughput Sequence Data. Balint, M., Bartha, L., O'Hara, R.B., Olson, M.S., Otte, J., Pfenninger, M., Robertson, A.L.,
Tiffin, P., Schmitt, I., 2015. Relocation, high-latitude warming and host genetic identity shape the foliar fungal microbiome of poplars. Mol. Ecol. 24, 235e248. https://doi.org/10.1111/mec.13018.
Balint, M., Schmidt, P.-A., Sharma, R., Thines, M., Schmitt, I., 2014. An Illumina metabarcoding pipeline for fungi. Ecol Evol 4, 2642e2653. https://doi.org/ 10.1002/ece3.1107.
Balint, M., Tif fin, P., Hallstrom, B., O'Hara, R.B., Olson, M.S., Fankhauser, J.D.,€ Piepenbring, M., Piepenbring, I., 2013. Host genotype shapes the foliar fungal microbiome of balsam poplar (Populus balsamifera). PLoS One 8, e53987. https://doi.org/10.1371/journal.pone.0053987.
Bastian, M., Heymann, S., Jacomy, M., 2009. Gephi: an open source software for exploring and manipulating networks. Icwsm 8 (2009), 361e362.
Baptista, P., Reis, F., Pereira, E., Tavares, R.M., Santos, P.M., Richard, F., Selosse, M.A., Lino-Neto, T., 2015. Soil DNA pyrosequencing and fruitbody surveys reveal contrasting diversity for various fungal ecological guilds in chestnut orchards. Environ. Microbiol. Rep 7, 946e954. https://doi.org/10.1111/1758-2229.12336.
Bengtsson-Palme, J., Ryberg, M., Hartmann, M., Branco, S., Wang, Z., Godhe, A., et al., 2013. Improved software detection and extraction of ITS1 and ITS2 from ribosomal ITS sequences of fungi and other Eukaryotes for analysis of environmental sequencing data. Methods Ecol Evol 4, 914e919. https://doi.org/10.1111/ 2041-210X.12073.
Berrebi, P., 2015. Three brown trout Salmo trutta lineages in Corsica described through allozyme variation. J. Fish. Biol. 86, 60e73.
Blaalid, R., Kumar, S., Nilsson, R.H., Abarenkov, K., Kirk, P.M., Kauserud, H., 2013. ITS1 versus ITS2 as DNA metabarcodes for fungi. Molecular Ecology Resources 13 (2), 218e224. https://doi.org/10.1111/1755-0998.12065.
Brown, S.P., Veach, A.M., Rigdon-Huss, A.R., Grond, K., Lickteig, S.K., Lothamer, K., Oliver, A.K., Jumpponen, A., 2015. Scraping the bottom of the barrel: are rare high throughput sequences artifacts? Fungal Eco. 13, 221e225. https://doi.org/ 10.1016/j.funeco.2014.08.006. Bullington, L.S., Larkin, B.G., 2015. Using direct amplification and next-generation sequencing technology to explore foliar endophyte communities in experimentally inoculated western white pines. Fungal. Eco 17, 170e178. https:// doi.org/10.1016/j.funeco.2015.07.005. Caporaso, J.G., Kuczynski, J., Stombaugh, J., Bittinger, K., Bushman, F.D., Costello, E.K., et
al., 2010. QIIME allows analysis of high-throughput community sequencing data. Nat. Methods 7, 335e336. https://doi.org/10.1038/nmeth.f.303.
Christian, N., Whitaker, B.K., Clay, K., 2015. Microbiomes: unifying animal and plant systems through the lens of community ecology theory. Front. Microbiol. 6 https://doi.org/10.3389/fmicb.2015.00869.
Claesson, M.J., O'Sullivan, O., Wang, Q., Nikkila, J., Marchesi, J.R., Smidt, H., de€ Vos, W.M., Ross, R.P., Toole, P.W., 2009. Comparative analysis of pyrosequencing and a phylogenetic microarray for exploring microbial community structures in the human distal intestine. PLoS One 4, e6669. https://doi.org/10.1371/ journal.pone.0006669.
Coince, A., Cordier, T., Lengelle, J., Defossez, E., Vacher, C., Robin, C., Bu ee, M., Marçais, B., 2014. Leaf and root-associated fungal assemblages do not follow similar elevational diversity patterns. PLoS One 9, e100668. https://doi.org/ 10.1371/journal.pone.0100668.
Cordier, T., Robin, C., Capdevielle, X., Desprez-Loustau, M.-L., Vacher, C., 2012. Spatial variability of phyllosphere fungal assemblages: genetic distance predominates over geographic distance in a European beech stand (Fagus sylvatica). Fungal. Eco 5, 509e520. https://doi.org/10.1016/j.funeco.2011.12.004.
Edgar, R.C., 2013. UPARSE: highly accurate OTU sequences from microbial amplicon reads. Nat. Methods 10, 996e998. https://doi.org/10.1038/nmeth.2604.
Edgar, R.C., Haas, B.J., Clemente, J.C., Quince, C., Knight, R., 2011. UCHIME improves sensitivity and speed of chimera detection. Bioinformatics 27, 2194e2200. https://doi.org/10.1093/bioinformatics/btr381.
Estrada, C., Wcislo, W.T., Van Bael, S.A., 2013. Symbiotic fungi alter plant chemistry that discourages leaf-cutting ants. New Phytol. 198, 241e251. https://doi.org/ 10.1111/nph.12140. Friesen, M.L., Porter, S.S., Stark, S.C., von Wettberg, E.J., Sachs, J.L., MartinezRomero, E., 2011. Microbially mediated plant functional traits. Annu. Rev. Ecol. Evol. Systemat. 42, 23e46. https://doi.org/10.1146/annurev-ecolsys-102710145039.
Gamisans, J., Marzocchi, J.-F., 1996. La flore endemique de la Corse. Edisud. Aix-enProvence 208.
Gazis, R., Chaverri, P., 2015. Wild trees in the Amazon basin harbor a great diversity of beneficial endosymbiotic fungi: is this evidence of protective mutualism? Fungal Eco. 17, 18e29. https://doi.org/10.1016/j.funeco.2015.04.001.
Gazis, R., Kuo, A., Riley, R., LaButti, K., Lipzen, A., Lin, J., et al., 2016. The genome of Xylona heveae provides a window into fungal endophytism. Fungal. Biol. 120, 26e42. https://doi.org/10.1016/j.funbio.2015.10.002.
Hardoim, P.R., van Overbeek, L.S., Berg, G., Pirttil€a, A.M., Compant, S., Campisano, A., Doring, M., Sessitsch, A., 2015. The hidden world within plants: ecological and€ evolutionary considerations for defining functioning of microbial endophytes. Microbiol. Mol. Biol. Rev. 79, 293e320. https://doi.org/10.1128/MMBR.0005014.
Helander, M.L., Sieber, T.N., Petrini, O., Neuvonen, S., 1994. Endophytic fungi in Scots pine needles: spatial variation and consequences of simulated acid rain. Can. J. Bot. 72, 1108e1113. https://doi.org/10.1139/b94-135.
Hill, M.O., 1973. Diversity and evenness: a unifying notation and its consequences. Ecology 54, 427e432. https://doi.org/10.2307/1934352.
Jacomy, M., Venturini, T., Heymann, S., Bastian, M., 2014. ForceAtlas2, a continuous graph layout algorithm for handy network visualization designed for the Gephi software. PloS One 9 (6), e98679.
Jeanmonod, D., Gamisans, J., 2007. Flora Corsica. Aix-en-Provence 1057. France: EdiSud. Jost, L., 2006. Entropy and diversity. Oikos 113, 363e375. https://doi.org/10.1111/
j.2006.0030-1299.14714.x.
Jumpponen, A., Jones, K.L., 2009. Massively parallel 454 sequencing indicates hyperdiverse fungal communities in temperate Quercus macrocarpa phyllosphere. New Phytol. 184, 438e448. https://doi.org/10.1111/j.14698137.2009.02990.x.
Kaul, S., Gupta, S., Ahmed, M., Dhar, M.K., 2012. Endophytic fungi from medicinal plants: a treasure hunt for bioactive metabolites. Phytochemistry Rev. 11, 487e505. https://doi.org/10.1007/s11101-012-9260-6.
Kembel, S.W., Mueller, R.C., 2014. Plant traits and taxonomy drive host associations in tropical phyllosphere fungal communities. Botany 92, 303e311. https:// doi.org/10.1139/cjb-2013-0194.
Kemler, M., Garnas, J., Wingfield, M.J., Gryzenhout, M., Pillay, K.-A., Slippers, B., 2013. Ion Torrent PGM as tool for fungal community analysis: a case study of endophytes in Eucalyptus grandis reveals high taxonomic diversity. PLoS One 8, e81718. https://doi.org/10.1371/journal.pone.0081718.
Koide, R.T., Ricks, K.D., Davis, E.R., 2017. Climate and dispersal influence the structure of leaf fungal endophyte communities of Quercus gambelii in the eastern
GreatBasin,USA.Fungal. Eco. 30, 19e28. https://doi.org/10.1016/ j.funeco.2017.08.002.
Koljalg, U., Nilsson, R.H., Abarenkov, K., Tedersoo, L., Taylor, A.F.S., Bahram, M., et al.,~ 2013. Towards a unified paradigm for sequence-based identification of fungi. Mol. Ecol. 22, 5271e5277. https://doi.org/10.1111/mec.12481.
Love, M.I., Huber, W., Anders, S., 2014. Moderated estimation of fold change and dispersion for RNA-seq data with DESeq2. Genome Biol. 15, 550. https://doi.org/ 10.1186/s13059-014-0550-8.
Mahe, F., Rognes, T., Quince, C., de Vargas, C., Dunthorn, M., 2015. Swarm v2: highly- scalable and high-resolution amplicon clustering. PeerJ 3. https://doi.org/ 10.7717/peerj.1420.
McMurdie, P.J., Holmes, S., 2013. Phyloseq: an R package for reproducible interactive analysis and graphics of microbiome census data. PLoS One 8, e61217. https:// doi.org/10.1371/journal.pone.0061217.
Meyer, K.M., Leveau, J.H.J., 2012. Microbiology of the phyllosphere: a playground for testing ecological concepts. Oecologia 168, 621e629. https://doi.org/10.1007/ s00442-011-2138-2. Millberg, H., Boberg, J., Stenlid, J., 2015. Changes in fungal community of Scots pine (Pinus
sylvestris) needles along a latitudinal gradient in Sweden. Fungal Eco. 17, 126e139. https://doi.org/10.1016/j.funeco.2015.05.012.
Mishra, Y., Singh, A., Batra, A., Sharma, M.M., 2014. Understanding the biodiversity and biological applications of endophytic fungi: a Review. J. Microb. Biochem. Technol. 2014 https://doi.org/10.4172/1948-5948.S8-004.
Moneglia, P., Besnard, A., Thibault, J.C., Prodon, R., 2009. Habitat selection of the Corsican Nuthatch (Sitta whiteheadi) after a fire. J. Ornithol. 150 (3), 577. https:// doi.org/10.4172/1948-5948.S8-004.
Mousa, W.K., Raizada, M.N., 2013. The diversity of anti-microbial secondary metabolites produced by fungal endophytes: an interdisciplinary perspective. Front. Microbiol. 4 https://doi.org/10.3389/fmicb.2013.00065.
Nguyen, D., Boberg, J., Ihrmark, K., Stenstro€m, E., Stenlid, J., 2016. Do foliar fungal communities of Norway spruce shift along a tree species diversity gradient in mature European forests? Fungal Eco. 23, 97e108.
Nguyen, N.H., Song, Z., Bates, S.T., Branco, S., Tedersoo, L., Menke, J., Schilling, J.S., Kennedy, P.G., 2015. FUNGuild: an open annotation tool for parsing fungal community
datasets by ecological guild. Fungal Eco. 20, 241e248. https:// doi.org/10.1016/j.funeco.2015.06.006.
Nilsson, R.H., Hyde, K.D., Pawłowska, J., Ryberg, M., Tedersoo, L., Aas, A.B., et al., 2014. Improving ITS sequence data for identification of plant pathogenic fungi.
Fungal Divers. 67, 11e19. https://doi.org/10.1007/s13225-014-0291-8.
Nitz, B., Falkner, G., Haszprunar, G., 2010. Inferring multiple Corsican Limax (pulmonata: Limacidae) radiations: a combined approach using morphology and molecules. In: Glaubrecht, M. (Ed.), Evolution in Action. Springer, Berlin, Heidelberg, pp. 405e435. https://doi.org/10.1007/978-3-642-12425-9_19. Berlin Heidelberg.
Norstedt, G., Bader, P., Ericson, L., 2001. Polypores as indicators of conservation value in Corsican pine forests. Biol. Conserv. 99, 347e354. https://doi.org/ 10.1016/S0006-3207(00)00220-2.
Oksanen, J., Blanchet, F.G., Friendly, M., Kindt, R., Legendre, P., McGlinn, D., et al., 2016. Vegan: community Ecology Package. Available at. https://cran.r-project.
org/web/packages/vegan/index.html.
Oono, R., Lefevre, E., Simha, A., Lutzoni, F., 2015. A comparison of the community diversity of foliar fungal endophytes between seedling and adult loblolly pines
(Pinustaeda).Fungal.Biol. 119, 917e928. https://doi.org/10.1016/ j.funbio.2015.07.003.
Oono, R., Rasmussen, A., Lefevre, E., 2017. Distance decay relationships in foliar fungal endophytes are driven by rare taxa. Environ. Microbiol. 19, 2794e2805. https://doi.org/10.1111/1462-2920.13799.
Partida-Martinez, L.P.P., Heil, M., 2011. The microbe-free plant: fact or artifact? Front. Plant Sci. 2 https://doi.org/10.3389/fpls.2011.00100.
Porras-Alfaro, A., Bayman, P., 2011. Hidden fungi, emergent properties: endophytes and microbiomes. Annu. Rev. Phytopathol. 49, 291e315. https://doi.org/10.1146/ annurev-phyto-080508-081831.
Rastogi, G., Coaker, G.L., Leveau, J.H.J., 2013. New insights into the structure and function of phyllosphere microbiota through high-throughput molecular approaches. FEMS Microbiol. Lett. 348, 1e10. https://doi.org/10.1111/15746968.12225.
Siddique, A.B., Unterseher, M., 2016. A cost-effective and efficient strategy for Illumina sequencing of fungal communities: a case study of beech endophytes identified elevation as main explanatory factor for diversity and community composition. Fungal Eco. 20, 175e185. https://doi.org/10.1016/
j.funeco.2015.12.009.
Sieber, T.N., 2007. Endophytic fungi in forest trees: are they mutualists? Fungal Biol. rev 21, 75e89. https://doi.org/10.1016/j.fbr.2007.05.004.
Unterseher, M., Gazis, R., Chaverri, P., Guarniz, C.F.G., Tenorio, D.H.Z., 2013. Endophytic fungi from Peruvian highland and lowland habitats form distinctive and host plant-specific assemblages. Biodivers. Conserv. 22, 999e1016. https:// doi.org/10.1007/s10531-013-0464-x.
U'Ren, J.M., Riddle, J.M., Monacell, J.T., Carbone, I., Miadlikowska, J., Arnold, A.E., 2014. Tissue storage and primer selection influence pyrosequencing-based inferences of diversity
and community composition of endolichenic and endophytic fungi. Mol. Ecol. Resour. 14 (5), 1032e1048.
Vandenkoornhuyse, P., Quaiser, A., Duhamel, M., Le Van, A., Dufresne, A., 2015. The importance of the microbiome of the plant holobiont. New Phytol. 206,
1196e1206. https://doi.org/10.1111/nph.13312.
Vetrovský, T., Baldrian, P., 2013. Analysis of soil fungal communities by amplicon pyrosequencing: current approaches to data analysis and the introduction of the pipeline SEED. Biol. Fertil. Soils 49 (8), 1027e1037.
Wang, Q., Garrity, G.M., Tiedje, J.M., Cole, J.R., 2007. Naïve bayesian classifier for rapid assignment of rRNA sequences into the new bacterial taxonomy. Appl. Environ. Microbiol. 73, 5261e5267. https://doi.org/10.1128/AEM.00062-07.
Watt, M.S., Rolando, C.A., Palmer, D.J., Bulman, L.S., 2012. Predicting the severity of Cyclaneusma minus on Pinus radiata under current climate in New Zealand. Can. J. For. Res. 42, 667e674. https://doi.org/10.1139/x2012-021.
Yang, T., Weisenhorn, P., Gilbert, J.A., Ni, Y., Sun, R., Shi, Y., Chu, H., 2016. Carbon constrains fungal endophyte assemblages along the timberline. Environ. Microbiol. 18, 2455e2469. https://doi.org/10.1111/1462-2920.13153.
Yuan, Z., Chen, L., 2014. The role of endophytic fungal individuals and communities in the decomposition of Pinus massoniana needle litter. PLoS One 9, e105911. https://doi.org/10.1371/journal.pone.0105911.
Zimmerman, N.B., Vitousek, P.M., 2012. Fungal endophyte communities reflect environmental structuring across a Hawaiian landscape. Proc. Natl. Acad. Sci.