HAL Id: cea-02383228
https://hal-cea.archives-ouvertes.fr/cea-02383228
Submitted on 27 Nov 2019
HAL is a multi-disciplinary open access
archive for the deposit and dissemination of sci-entific research documents, whether they are pub-lished or not. The documents may come from teaching and research institutions in France or abroad, or from public or private research centers.
L’archive ouverte pluridisciplinaire HAL, est destinée au dépôt et à la diffusion de documents scientifiques de niveau recherche, publiés ou non, émanant des établissements d’enseignement et de recherche français ou étrangers, des laboratoires publics ou privés.
Insights on Fission Products behaviour in Nuclear
Severe Accident Conditions by X-ray Absorption
Spectroscopy
E. Geiger, R. Bes, Ph Martin, Yves Pontillon, G. Ducros, P.L. Solari
To cite this version:
E. Geiger, R. Bes, Ph Martin, Yves Pontillon, G. Ducros, et al.. Insights on Fission Products be-haviour in Nuclear Severe Accident Conditions by X-ray Absorption Spectroscopy. Journal of Nuclear Materials, Elsevier, 2016, 471, pp.25-33. �10.1016/j.jnucmat.2015.12.032�. �cea-02383228�
1
Insights on Fission Products behaviour in Nuclear Severe Accident Conditions
by X-ray Absorption Spectroscopy
E. Geiger
1*, R. Bès
2, Ph. Martin
3, Y. Pontillon
1, G. Ducros
4, P. L. Solari
51.
CEA, DEN, CAD, DEC, SA3C, LAMIR, F-13108 Saint Paul lez Durance, France
2.
Department of Applied Physics, Aalto University, P.O. Box 11100, FI-00076 Aalto, Espoo, Finland
3.
CEA, DEN, MAR, DTEC, SECA, LCC, F-30207 Bagnols sur Cèze, France
4.
CEA, DEN, CAD, DEC, SA3C, F-13108 Saint Paul lez Durance, France
5.
Synchrotron SOLEIL, MARS Beamline, L'Orme des Merisiers, Saint Aubin BP 48, F-91192 Gif-sur- Yvette, France
* Corresponding author: ernesto.geiger@cea.fr
Abstract:
Many research programs have been carried out aiming to understand the fission products behaviour during a Nuclear Severe Accident. Most of these programs used highly radioactive irradiated nuclear fuel, which requires complex instrumentation. Moreover, the radioactive character of samples hinders an accurate chemical characterisation. In order to overcome these difficulties, SIMFUEL stand out as an alternative to perform complementary tests. A sample made of UO2 doped with 11 fission products was submitted to an annealing test up to 1700 °C in reducing atmosphere. The sample was characterized before and after the annealing test using SEM-EDS and XAS at the MARS beam-line, SOLEIL Synchrotron. It was found that, despite the absence of volatile FP in SIMFUEL samples, the overall behaviour of several fission products like Mo, Ba, Pd and Ru was similar to that observed experimentally in irradiated fuels and also consistent with thermodynamic estimations.
Highlights:
-A new approach to study fission products behaviours in severe accidents conditions is proposed: the use of model materials, chemically representative of irradiated nuclear fuels, coupled with powerful characterisation techniques such as X-ray Absorption Spectroscopy.
-SIMFUEL samples were submitted to annealing test in conditions representative to a first stage of nuclear severe accidents. The initial elements distribution and the phases’ evolution as a consequence of the test are in agreement to those observed for irradiated nuclear fuels.
-XAS analyses were performed on molybdenum, ruthenium, barium and zirconium in a UO2 matrix at
low concentrations, representative of irradiated nuclear fuels.
-Under the experimental conditions studied, it was observed a partial release of barium and the almost complete release of palladium.
2
1. Introduction:
Severe Accidents (SA) in nuclear power plants may involve the release of radioactive elements such as Fission Products (FP) into the atmosphere. This was the case during the three major nuclear severe accidents in history: Three Mile Island (TMI) in 1979, Chernobyl in 1986 and more recently Fukushima Dai-Ichi in 2011. The releases during the TMI accident were not very significant while they were quite important during the Chernobyl and Fukushima accidents. Particularly for this last one, and according to simulations [1], the reactors cooling systems was damaged, leading to the boiling of the cooling fluid and subsequent gradual exposure of the core in reactors 1, 2 and 3. As temperatures arose due to the lack of heat evacuation, steam was generated leading to the oxidation of the rods cladding and consequent hydrogen production. The release of FP often takes place in these conditions: an atmosphere with a varying composition of steam and H2 and continuously increasing temperature.
Many in-pile [2]–[13] and off-pile [8], [14]–[20] tests have been performed since the TMI-2 accident, aiming to understand both FP behaviour and the quantification of the active materials released from the core (the so-called source-term) in case of vessel failure. Off-pile tests were performed using a separate effect approach by modifying a single parameter between tests, and aimed principally to study FP release. On the contrary, in-pile tests consisted in reproducing whole reactors at reduced scale and submitting them to SA sequences. The latter approach aimed at studying the interaction of FP with structural materials and their transport into secondary circuits. Despite the great research done on the subject some uncertainties remain regarding to the behaviour of several FP such as: barium, caesium, molybdenum and ruthenium. To be able to predict the chemical evolution of FP during a severe accident is mandatory for the development of accurate mechanistic models for source-term estimation.
Most of these in-pile and off-pile experimental programs used irradiated fuel samples [8], which in some tests were re-irradiated in order to recreate the initial short-lived FP inventory. This required time and implied many risks and difficulties. On the contrary, only one of them, the SACHA experimental program, used model materials [21] in their tests. These materials, called SIMFUEL, were prepared by adding stable FP oxides during the UO2 pellet manufacturing process. The main
advantage of SIMFUEL is the reduced radiological risk, due only to the natural uranium radioactivity since all other component are stable, leading to important reductions of the costs of manipulation, characterization, etc. Nevertheless, SIMFUELS present a main limitation which is the impossibility of reproducing effects directly associated to irradiation, such as the HBS (High Burn-up Structure) and FP solubility phenomena [22]. The present work aims to demonstrate that, despite their limitations, SIMFUELS are an alternative to irradiated fuel in the SA study. Since FP release cannot be measured directly by gamma-spectrometry as it was generally the case for irradiated fuels [23] due to the lack of radioactive species, we propose a different approach: the identification of the chemical phases produced and destroyed during the accidental sequence. By determining these phases, the behaviour observed for FP through the different experimental programs could be better understood. This approach consists in submitting SIMFUEL samples to annealing tests in conditions representative to intermediate stages of a SA. The chemical phases’ evolution would then be determined by adequate characterisation techniques such as X-ray Absorption Spectroscopy (XAS). This characterisation technique is yet unavailable for large samples of irradiated fuel, hence the interest of proving that model materials are an alternative.
3 The key features about the approach discussed in this paper are:
-Representativeness of SIMFUEL samples to an “initial state”, considered to be a normal state of operation of a PWR irradiated fuel,
-The aptitude of the experimental process to reproduce key phenomena observed during SA, -Representativeness of a sample to an intermediate stage of a SA (1700°C under reducing atmosphere),
-The critical evaluation of the characterisation methods, particularly XAS: to characterize FP chemical state, when present in a complex matrix of UO2 doped with many other FP. Firstly, the
actual knowledge on FP behaviour during SA scenario is resumed along with the remaining uncertainties and hypotheses. Secondly, in the methods and materials section, SIMFUEL samples are described, as well as the different characterisation methods used. Thirdly, the results obtained before and after the annealing sequence are presented. These results are discussed giving place to the conclusion on how SIMFUEL can be used for the study of SA.
2. Scientific context
One of the main lessons from research programs, particularly from the VERCORS series program performed by the CEA from 1983 to 2002 [18]–[20], is the classification of the different FP into four categories according to their volatility degree. Each group presented similar characteristics during tests, in terms of final released fraction and its dependence on the oxygen partial pressure (PO2).
These four categories are:
-Volatile FP: Xe, Kr, Cs, I, Te, Sb, Ag, Cd and Rb, which are the first FP to be released and may be completely released at high temperatures.
-Semi Volatile FP: Ba, Mo, Tc, Rh and Pd, which final released fractions and release kinetics depend strongly on the surrounding atmosphere (PO2).
-Low Volatile FP: Ru, Ce, Sr, Y, Eu, Nb and La, which present generally low releases but are also dependent on the PO2.
-Non-Volatile FP: Zr, Nd and Pr, which releases were always below 1%.
Thanks to direct gamma-spectrometry it was also possible to determinate FP release kinetics. The releases measured for Mo, Cs and Ba from a UO2 fuel during the VERCORS 4 test are illustrated in
Figure 1, adapted from [19]. This test was carried out in reducing conditions and temperature up to
2300°C. As observed, the FP behaviour was quite complex: their release kinetics presented a succession of plateaus and ramps which depended on the test conditions. These plateaus and ramps could be associated to the creation and destruction of chemical phases which control the release of FP under specific conditions. Nevertheless, scenario codes for source-term estimation such as the ASTEC Code [24], [25] normally assume that volatile FP such as iodine and caesium behave as gases and that their release is purely diffusive. As for Ba and Mo, some reactions are considered but the intermediary compounds have never been observed experimentally. Though not presented in Figure
1, ruthenium presents a particular behaviour. Indeed, this FP, classified as low-volatile, exhibited high
release rates under very oxidizing conditions. It has been attributed to the formation of volatile Ru oxides such as RuO2, RuO3 or RuO4.
4
Figure 1: Mo99, Cs137 and Ba140 release kinetics during VERCORS 4 test
A mechanism aiming to explain the releases observed for these FP (Ba, Cs, Mo and Ru) during the VERCORS series programs (VERCORS, VERCORS RT and VERCORS HT) has been proposed [26]. This mechanism, presented in a simplified way in Figure 2, proposes an initial state based mainly on irradiated fuels characterisations performed by Kleykamp [27], [28]. Besides the fuel matrix (UO2),
this initial state considers two additional main phases both in form of micrometric precipitates: a metallic phase composed by Mo, Pd, Ru, Rh and Tc, and an oxide phase with perovskite structure depicted as (Ba, Cs, Sr)(Mo, Pu, Zr, U, RE)O3, where RE stands for Rare Earths. According to this
mechanism, reactions between these FP and other structural materials would take place at different temperatures, which would also be strongly influenced by the PO2, since it would displace the
chemical equilibrium towards reagents or products. In order to validate the approach proposed in this paper, the mechanism detailed above and new thermodynamic calculations are taken as reference to verify whether the behaviour of SIMFUEL in SA conditions is coherent or not to what has been observed for irradiated fuels.
5
Figure 2: Release mechanism proposed for Cs, Ba, Mo and Ru
3. Methods and materials 3.1. Samples Characteristics
SIMFUEL samples were acquired from the Chalk River Laboratories, Canada. Samples contain 11 stable FP: Mo, Ru, Rh, Pd, Ba, Zr, Ce, Sr, Y, La and Nd; in concentrations representative to a 76 GWd.t-1 Burn-up UO2 irradiated fuel. The concentration of each FP is presented in Table 1.
Table 1: SIMFUEL samples composition
According to [22], samples preparation was as follows: high-purity oxides (BaCO3, CeO2, La2O3, MoO3,
SrO, Y2O3, ZrO2, RhO3, PdO, RuO2, Nd2O3, 99.999% purity) were dry-mixed with UO2 powder, and then
submitted to high-energy, wet, stirred-ball milling, in order to achieve an uniform dispersion. After spray drying, the oxides mix was submitted to conventional pre-compaction, granulation, pressing and a final sintering stage at 1923 K for 2 hours under flowing hydrogen. Under these conditions, an oxygen potential equal to -500 KJ.mol-1 was attained.
The resulting samples have a density equal to about 97 % of theoretical density of UO2 and fuel
grains with a mean size of 12 µm.
Samples are 500 µm thick, polished quarter discs made from 10 mm diameter discs.
3.2. Experimental loop and test conditions
The annealing test was performed in the DURANCE experimental loop located at the Bernard François laboratory at the Commissariat à l’Energie Atomique et aux Energies Alternatives (CEA), Cadarache, France. The experimental loop, presented in Figure 3, consists in an induction furnace with a crucible made of metallic molybdenum where samples are placed. The furnace is followed by
Samples Composition (at. %)
Ba Ce La Mo Sr Y Zr Rh Pd Ru Nd
6 an online gas chromatograph and a storage containment for released gases. One of the main features of the loop is the possibility of measuring the PO2 in the inlet gas, thanks to a MicroPoas
probe (GENAIR) which is maintained at 675°C. Temperature is measured in the following way: a thermocouple is placed below the crucible, not in direct contact. Pure copper and tin filaments, with perfectly known fusion temperatures are placed into furnace. By knowing their fusion temperature and the temperature measured by the thermocouple when it happens, a proportionality constant can be obtained. This constant is then used to fix the target temperatures in the controller.
Figure 3: DURANCE experimental loop
The annealing sequence, representative of an intermediate state of nuclear severe accident, consisted on a temperature ramp up to 1973 K, maintained for 1 h under reducing atmosphere (flowing Ar + 4% H2). Under these conditions, an oxygen potential of -630 kJ.molO2-1 was obtained.
These conditions were chosen in order to verify two hypotheses about Ba and Mo behaviour. As proposed in the mechanism, BaZrO3 is destroyed in reducing conditions around 2100 K. The
evolution of the partial pressure of Ba(g) is presented in Figure 4, estimated using FactSage™ 6.3
software, considering similar conditions to the test, but in a closed system. According to these results, BaZrO3 is decomposed into ZrO2 and BaO above 1500 °C. An open system, with flowing gas,
would accelerate this reaction. Regarding to Mo, the adopted conditions would allow to study the evolution of the Mo-Ru-Pd ternary (the three main constituents of white inclusions) in severe accident conditions.
7
Figure 4: PBa(g) estimated evolution 3.3. Characterization Methods
3.3.1. Scanning Electron Microscope
Scanning Electron Microscopy (SEM) was performed using a Philips XL30 FEG instrument, equipped with an EDAX-EDS system allowing us to determinate the distribution and content of FP using Energy Dispersive X-ray Spectroscopy (EDS) methods. Acceleration tension was set to 15 kV. The X-ray lines used to analyse the sample are the L1 ones except to uranium and oxygen for which M1 and K1 have been respectively collected. Image analysis was performed using the analySIS pro 5.0 software, from Olympus Soft Imaging Solutions. Samples were not polished before SEM observations. X-ray maps and the concentration of each element in the matrix and precipitates were obtained. Regarding to X-ray maps, black represents the absence of the studied element. Image analysis allowed to measure the ECD (Equivalent Circle Diameter) of precipitates as well as their surface contribution (the surface percent occupied by precipitates, regarding to the total analysed surface).
3.3.2. X-ray Absorption Spectroscopy
Due to its ability to reveal information at the molecular level such as coordination geometry and oxidation states, X-ray Absorption Spectroscopy (XAS) experiments were performed on several interesting elements such as Mo, Ru, Ba and Zr. The measurements were carried out at the MARS beam-line, SOLEIL synchrotron radiation facility (France) [29], under top-up 430 mA ring mode. The photon energy was scanned from 17.6 to 22.4 keV (Mo, Zr and Ru K-edges) and from 5.1 to 5.4 keV (Ba L3-edge) using the Si(220) double-crystal monochromator (DCM) which allows a mean photon
flux of about 2x10¹¹ ph.s-1 at 17.5 keV. In the case of Ba experiment, a helium bag was used in order to limit the X-rays absorption and scattering phenomena during their path through air between the sample and the detector.
Calibration was done using the K-edge excitation energies of Zr (17.998 keV), Mo (20.000 keV), Ru (22.117 keV) and Ti (4.966 keV) metallic foils. The monochromatic beam was focused to 350 x 350 µm2 (Horizontal x Vertical Full Width at Half Maximum).
8 As FP are diluted elements in a heavy matrix, the fluorescence mode has been adopted. The XAS spectra have been collected with a Vortex-90-EX silicon drift detector.
The ATHENA software [30] was used for normalizing XAS spectra oscillations from the raw absorption data and correcting the self-absorption phenomena. Pre-edge removal and normalization was achieved using linear functions. The post-edge line for XANES spectra was taken using the position 30 eV and 150 eV relatively to edge position E0. The E0 values and the white line maximum of each
spectrum were taken as the first inflection point and the first zero-crossing of its first derivative.
4. Results 4.1. SEM-EDS
SEM images of the SIMFUEL sample before (T0 sample) and after test (AT sample) are presented in
Figure 5. For both samples, the UO2 matrix and two other phases in form of small precipitates, which
differ in shape and colour, were observed. Particularly for the AT sample, the presence of white precipitates and the revelation of grain boundaries are observed as a consequence of the test. The latter is quite common as result of annealing tests [31].
Figure 5: SEM image of the sample before (T0, left) and after (AT, right) annealing treatment
Further characterisation by SEM-EDS has allowed to locate FP into three different groups. Lanthanum and neodymium in the first one along with uranium and oxygen; molybdenum, palladium, rhodium and ruthenium in the second one and lastly barium, zirconium, strontium, cerium and yttrium in the third one. Each group presented a similar distribution in the sample and are thus analysed together. A similar distribution has been observed in irradiated fuels: Precipitates containing Mo, Ru, Rh, Pd and Tc, called White inclusions, and precipitates containing Ba, Zr, U and O among others, usually called Perovskite or grey phase [27].
4.1.1. UO2 matrix:
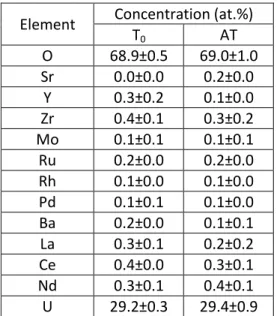
U, O and Nd X-ray maps for both samples are presented in Figures 6. La X-ray maps were similar to those of Nd and so they are not presented here. According to these results U, O, La and Nd are evenly distributed in the matrix, both before and after the test. It is observed that O is not present in the white precipitates observed in Figure 6. The concentration of each element in the UO2 matrix is
presented in Table 2. According to them, other elements such as Zr and Ce are also present in the matrix.
9
T0 AT
U
Nd
O
10 Element Concentration (at.%)
T0 AT O 68.9±0.5 69.0±1.0 Sr 0.0±0.0 0.2±0.0 Y 0.3±0.2 0.1±0.0 Zr 0.4±0.1 0.3±0.2 Mo 0.1±0.1 0.1±0.1 Ru 0.2±0.0 0.2±0.0 Rh 0.1±0.0 0.1±0.0 Pd 0.1±0.1 0.1±0.0 Ba 0.2±0.0 0.1±0.1 La 0.3±0.1 0.2±0.2 Ce 0.4±0.0 0.3±0.1 Nd 0.3±0.1 0.4±0.1 U 29.2±0.3 29.4±0.9
Table 2: Elements concentration in the UO2 matrix 4.1.2. White inclusions:
Mo, Ru and Pd X-ray maps are presented in Figure 7. Rh X-ray map are similar to those of Mo and Ru, and so they are not presented here. The composition of these precipitates is presented in Table 3. Some important differences were found after the annealing test. The first one is the apparition of a second phase richer in molybdenum. Indeed, according to the quantitative analyses before the test, the Mo/Ru ratio was similar in all precipitates and equal to 0.76. After the test, most precipitates of size superior to 1.5 µm (designed as phase β) exhibited a Mo/Ru ratio of 6.0±1.4 while the smaller ones (designed as phase ε) a Mo/Ru ratio equal to 1.0±0.0, as observed in Table 4. Similar precipitates are described in the Mo-Ru system studied in [32].It was also observed that the surface contribution of white inclusions to the total analysed surface increased around 45%, and that the equivalent circle diameter (ECD) of these metallic precipitates decreased about 50%.
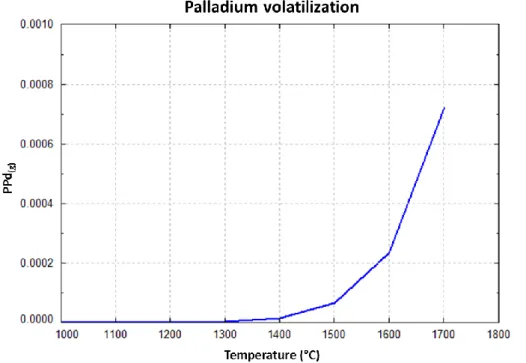
The second main difference is that that palladium disappeared almost completely from these precipitates after the test: The Pd mean concentration in the T0 sample is 24.5 at%, while after the
test it was reduced to 0.1 and 0.8 at% in β the ε and precipitates, respectively. Similarly to barium, palladium volatilization has been estimated using FactSage. The evolution of Pd partial pressure for a closed system but under the same annealing test conditions is presented in Figure 8. According to this, an important quantity of Pd is in equilibrium with the gas phase, which in an open system would be carried away by the flowing gas.
11
T0 AT
Mo
Ru
Pd
Figure 7: X-ray Maps for Mo, Ru, Rh and Pd
Element Concentration (at.%) T0 AT phase β phase ε Mo 32.4±1.0 85.0±2.9 49.4±1.3 Ru 42.6±0.8 14.8±2.9 49.3±1.1 Rh 0.4±0.5 0.0±0.1 0.6±0.5 Pd 24.5±1.0 0.1±0.2 0.8±0.4
12 Sample Surface contribution (%) ECD (µm) Mo/Ru ratio
T0 1.88 2.45 0.8±0.0
AT 2.73 1.26 β =6.0±1.4
ε =1.0±0.0
Table 4: Characteristics of white inclusion precipitates, before and after test
Figure 8: Estimation of palladium volatilization under tests conditions
4.1.3. Grey phase:
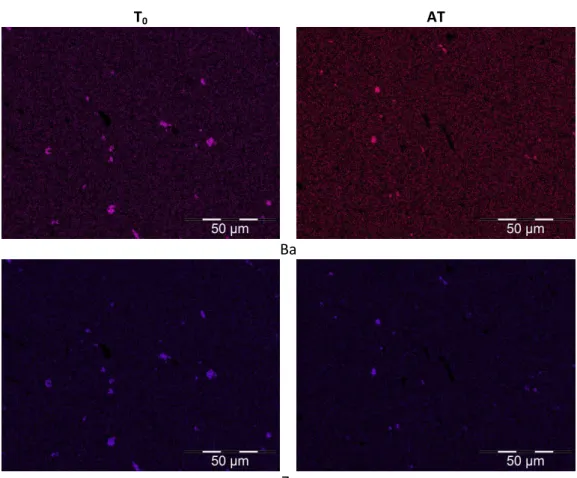
Ba, Zr, Sr, Y and Ce were also observed to form precipitates. Ba and Zr X-ray maps are presented in
Figure 9. Sr, Y and Ce X-ray maps are similar to those of Ba and Zr, and so they are not presented
here. The quantitative analysis of these precipitates, presented in Table 5, indicate that O and U are also present.
After the test, an increased number of precipitates was observed but also an important reduction in their ECD and the surface contribution of these precipitates, as displayed in Table 6. Quantitative analyses indicate that the Ba/Zr ratio in the remaining precipitates decreased 18%.
13
T0 AT
Ba
Zr
Figure 9: Ba and Zr X-rays maps
Element Concentration (at.%)
T0 AT O 66.1±0.7 70.3±7.4 Sr 2.3±0.3 2.5±1.5 Y 0.2±0.2 0.1±0.1 Zr 12.3±1.3 12.8±3.6 Ba 12.3±1.0 11.1±3.2 Ce 0.2±0.1 0.0±0.1 U 6.7±2.3 3.3±0.9
Table 5: Grey phase chemical composition
Sample Surface contribution (%) ECD (µm) Ba/Zr ratio
T0 0.64 2.45 1.0±0.1
AT 0.29 0.83 0.8±0.2
Table 6: Characteristics of the precipitates containing Ba and Zr before and after test
4.2. X-ray Absorption Spectroscopy
4.2.1. XANES at the Mo and Ru K-edge
Molybdenum and ruthenium XANES (X-ray Absorption Near Edge Structure) spectra are presented in
Figure 10. In this figure, the main features observed on SIMFUEL sample spectra are indicated with
dashed vertical lines. The edge energy E0 and the white line positions of each spectrum are reported
14
Figure 10: Mo (left) and Ru (right) K-edge XANES spectra measured on SIMFUEL samples and references. The energy position of the main features from SIMFUEL spectra are indicated with vertical dashed line.
Sample Mo K-edge Sample Ru K-edge
E0 (eV) White line (eV) E0 (eV) White line (eV)
Mo 20,000 20,016.1±0.8 Ru 22,117 22,134.9±0.8
MoO2 20,004.3±0.8 20,027.4±0.8 RuO2 22,124.3±0.8 22,140.1±0.8
MoO3 20,004.3±0.8 20,026.7±0.8 - - -
T0 sample 20,000.1±0.8 20,017.5±0.8 T0 sample 22,117.4±0.8 22,135.9±0.8
AT sample 20,000.1±0.8 20,016.1±0.8 AT sample 22,117.2±0.8 22,135.9±0.8
Table 7: Edge energy and white line position of the samples and references spectra collected at the Mo and Ru K-edges.
As observed, the Mo K–edge spectra of SIMFUEL samples are slightly modified by the annealing process, contrary to the Ru K-edge ones. Indeed, as reported in Table 7, the white line position of Mo XANES is shifted by 1.0±0.8 eV to lower energy after annealing compared to T0 sample.
4.2.2. XANES at the Zr K-edge and Ba L3-edge
Barium and zirconium XANES spectra are presented in Figure 11. In this figure, the main features observed on SIMFUEL sample spectra are indicated with dashed vertical lines. The edge energy E0
and the white line positions of each spectrum are reported in Table 8.
Figure 11: Ba L3-edge (left) and Zr K-edge (right) XANES spectra measured on SIMFUEL samples and references (shifted
15
Sample Zr K-edge Sample Ba L3-edge
E0 (eV) White line (eV) E0 (eV) White line (eV)
Zr 17,998 18,013.8±0.8 BaO 5,250.3±0.5 5,251.8±0.5 Tetragonal ZrO2 18,012.5±0.8 18,018.1±0.8 - - - Sm2Zr2O7 18,013.3±0.8 18,019.0+0.8 T0 18,010.7±0.8 18,015.5±0.8 T0 5,250.4±0.5 5,252.0±0.5 AT 18,010.6±0.8 18,015.5±0.8 AT 5,250.5±0.5 5,251.1±05
Table 8: Edge energy and white line position of the samples and references spectra collected at the Ba L3-edge and Zr
K-edge.
As observed, both Ba and Zr spectra are not strongly modified by annealing process. The edge energy position is similar for both samples within the experimental errors, indicating that the Ba and Zr oxidation state do not change before and after annealing. Particularly for Zr, spectra indicate a local environment close to that of the pyrochlore Sm2Zr2O7 [33]. This local environment is characteristic of
the perovskite structure as well.
5. Discussion
Regarding to the SIMFUEL UO2 matrix, the chemical composition and evolution observed are
consistent with experimental observations on irradiated fuels. La and Nd were observed to be completely dissolved in the matrix which is consistent with observations for the given Burn-up [28] [31]. Indeed, nor La or Nd signals are detected in the precipitates observed in Figures 6. Zr was detected in the matrix. This could be partially attributed to the solution of La2Zr2O7, which is
predicted by own thermodynamics or to ZrO2 which is also highly soluble in UO2 [28].
Mo, Pd, Rh and Ru were found together in metallic precipitates. Such precipitates have been observed in irradiated fuels. Indeed, [27] describes metallic precipitates containing Mo, Pd, Rh, Ru and Tc and refers to as white inclusions. Only one type of metallic precipitate was observed in the T0
sample, while two different ones were observed after the annealing test, in the AT sample. Besides, it was observed that the number of precipitates and their surface contribution increased after the annealing test, though their EDC decreased.
The absence of palladium after the test would imply a nearly complete release of this element out of the sample. Pd has been classified as a semi-volatile FP [15]. It was observed during the VERCORS tests that oxidizing atmospheres favoured the release of this FP, in a similar way to the other noble metals, Tc and Ru, present in the white inclusions. Nevertheless, palladium is liquid in the studied conditions (melting point at 1828.8 K) and, as predicted by thermodynamic calculations, it is present in the gaseous phase in equilibrium. The flowing gas would then carry away gaseous species of Pd thus favouring the volatilisation of the liquid phase. The separation of the initial metallic phase into two different ones could be explained by the apparent release of palladium after the test. According to [32], Pd stabilizes the Mo-Ru system, which otherwise would be separated due to a miscibility gap. As it is observed in the Mo-Ru binary diagram in [32], below 1200°C two phases coexist: the β and ε phases. Nevertheless, the composition of the precipitates observed in sample AT does not match the theoretical one. Indeed, phases β and ε should present a Mo content approximately of 90 and 36 at% respectively, while the precipitates in the AT sample present a Mo content of 85.0±2.9 and 49.4±1.3 %at, respectively. This could be due to the cooling rate after the test, which might have been too fast for the precipitates to attain chemical equilibrium, or to the stabilization of the phase due the
16 incorporation of Pd and Rh traces. The increased concentration of Mo observed in both precipitates, compared to the initial Mo content of the T0 sample precipitates, would indicate the migration of Mo from within towards the surface. XANES spectra in Figure 10 indicate that Mo is mainly found in metallic state in both samples. The Mo K-edge spectrum is slightly modified by the annealing process, contrary to the Ru K-edge one. Indeed, as reported in Table 7, the white line position of Mo XANES is shifted by 1.0±0.8 eV to lower energy after annealing, while Ru spectra does not change at all. This indicates that the local structure around Mo evolves during annealing, but not the Ru one. This result is not surprising because, as indicated in the mechanism presented in Figure 2, Mo is expected to be mobile under the MoO2 gaseous form at 1300 K which is below the annealing temperature of 2000 K
and Ru should be mobile under the RuOx gaseous form at 2600 K which is above the annealing
temperature. The collected spectra for Mo for both samples could not be completely reproduced by linear combination of the metallic and oxide references, which would indicate that more references are required: the Mo dissolved in the matrix or the metallic alloy Mo-Ru-Pd-Rh.
Ba, Ce, Y, Zr and Sr were found to form precipitates as well, containing also O and U. This oxide phase presents a perovskite structure and is often depicted as (Ba, Cs, Sr)(U, Pu, Zr, Mo, RE)O3. As Ba, Zrand
U are the main chemical components of this oxide phase, the lattice parameter would range from a=4.39 Å (for BaUO3) to a=4.19 Å (for BaZrO3). The lattice parameter may be further reduced by
incorporation of BaMoO3, present in oxidizing conditions [22]. According to Kleykamp [27], rare
earths such as Ce and Y are also present in the grey phase but are only detected in high-burn up fuels, which is our case. Though this phase is represented as (Ba, Cs, Sr)( U, Pu, Zr, Mo, RE)O3 no Mo
was found in our samples. This may be due to the chosen conditions for the annealing tests: The corresponding chemical form would be BaMoO3 or BaMoO4 which are, according to thermodynamic
estimations, produced in oxidizing conditions. According to the proposed mechanism barium is found as BaZrO3, a compound which is destroyed around 2100K in reducing conditions. Indeed,
thermodynamic estimations indicate the presence of barium reduced species in equilibrium in the gaseous phase. This would explain the reduction in the numbers of precipitates as well as the Ba/Zr ratio of the remaining ones after the annealing test. Regarding to XAS results, Ba and Zr spectra confirm the oxidations states Ba+2 and Zr+4, as well as a Zr local environment similar to that of the perovskite and pyrochlore structures, which could confirm the BaZrO3 chemical form. As observed,
the spectra of these two elements are not strongly modified by the annealing process: the edge energy position is similar for both samples within the experimental errors, indicating that the Ba and Zr oxidation state do not change after the annealing test. It is deduced then that the local structure around Ba and Zr does not change significantly after the test, even if the presumed chemical form, BaZrO3 is partially destroyed and Ba is released. As observed in XAS experiment, these possible
modifications are not enough to affect the geometry of the local environment but only the cell parameters of the structures. The features different intensities observed between Ba and Zr spectra from the samples and those from the oxide and metallic references confirm that these two elements are involved in mixed oxides compounds. Indeed, the presence of elements such as Y, Ce, La and U would induce steric constraints, distorting the cell parameter of the perovskite structure explaining the differences observed. This is in good agreement with SEM experiments.
17
6. Conclusions
The aim of this work was to demonstrate that SIMFUELS are a good complement to irradiated fuels for the study of FP behaviour during nuclear SA, using XAS as the main characterization technique. To this end, a SIMFUEL sample doped with 11 FP in concentrations representative to a 76 GWd.t-1 irradiated fuel was submitted to an annealing test in conditions representative of a severe accident: temperature up to 1700°C under reducing atmosphere (flowing Ar + 4% H2). Samples were
characterized by SEM-EDS and XAS, and the observed chemical evolution compared to experimental observations performed in analytical programs such as VERCORS and own thermodynamic calculations.
Results show that the main phases observed in irradiated fuel, other than the fuel matrix, are well reproduced in SIMFUELS. These phases are metallic precipitates, also called white inclusions, composed of Mo, Pd, Ru and Rh (which in irradiated fuels also contain Tc) and an oxide phase with perovskite structure composed by Ba, Zr, Sr, Y and Ce, also called grey phase. The number, size and chemical composition of these precipitates were modified as a consequence of the annealing test. Particularly for the white inclusions, two different phases were observed after the test, one significantly more concentrated in Mo. This element is assumed to have migrated to the surface from within the sample. The absence of Pd in the metallic precipitates after the test would imply the release of this FP. Regarding to the grey phase precipitates, the reduced ECD and Ba/Zr ratio after the annealing test would imply the partial destruction of the respective phase and the release of Ba. These observations are consistent with the proposed release mechanisms and thermodynamic estimations.
XANES spectra were collected at the K edge of Mo, Ru and Zr and at the L edge of Ba. Mo and Ru spectra indicate that these PF are in metallic state, which is consistent with the proposed mechanism and thermodynamics. Ba and Zr spectra indicate that these elements are found as Ba2+ and Zr+4, respectively. Moreover, according to Zr spectrum, this element would be in pyrochlore structure. These results reinforce the existence of assumed chemical form, BaZrO3. The main implication of
these results is that they demonstrate that the chemical state of chemical elements present in a UO2
matrix can be accurately identified, despite the low concentrations and the many possible interfering elements. Therefore, these model materials could be a very important complement to irradiated fuels in the study of FP behaviour, particularly when powerful characterization methods such as XAS are used.
The next step in our study is to submit improved SIMFUEL samples to annealing tests, also in conditions representative of severe accidents, at different temperatures. Samples will be implanted with Cs and Mo using the ion implantation technique, in order to improve their representativeness both in composition (presence of a volatile species) and FP distribution in the fuel.
7. Acknowledgment
Authors wish to thank the CEA Cadarache LAMIR, LCU, LEMCI and LLCC staff for their invaluable contribution to this project. We acknowledge also SOLEIL for provision of synchrotron radiation facilities and we would like to thank Sandrine Schlutig and Hervé Hermange for assistance in using MARS beamline.
18
8. References
[1] H. Dimmelmeier, “Recent Satus of Knowledgee about the Fukushima Daiichi Accident,” presented at the Short Course on Severe Accident Phenomenology, London Imperial College, 2013.
[2] M. D. Allen, H. W. Stockman, K. O. Reil, A. J. Grimley, and W. J. Camp, “Proceedings of the International Conference on Thermal Reactor Safety,” Avignon, France, 02-Oct-1988.
[3] L. Baker, J. K. Fink, R. Simms, B. J. Schlenger, and J. E. Herceg, “Source Term Experiments Project (STEP): A Summary,” Electric Power Research Institute, NP-5753M, Mar. 1988.
[4] R. Dubourg, H. Faure-Geors, G. Nicaise, and M. Barrachin, “Fission product release in the first two PHEBUS tests FPT0 and FPT1,” Nucl. Eng. Des., vol. 235, no. 20, pp. 2183–2208, Sep. 2005. [5] R. D. Gasser, C. P. Fryer, R. O. Gauntt, A. C. Marshall, K. O. Reil, and K. T. Stalker, “Damaged Fuel
Relocation Experiment DF-1: Results and Analyses,” US Nuclear Regulatory Commission, US, NUREG/CR-4668, SAND86-1030, Jan. 1990.
[6] R. O. Gauntt, R. D. Gasser, and L. J. Ott, “The DF-4 Fuel Damage Experiment in ACRR with a BWR Control Blade and Channel Box,” US Nuclear Regulatory Commission, US, NUREG/CR-4671, SAND86-1443, Nov. 1989.
[7] A. D. Knipe, S. A. Ploger, and D. . Osetek, “PBF Severe Fuel Damage Scoping Test – Test Results Report,” US Nuclear Regulatory Commission, NUREG/CR-4683, Mar. 1986.
[8] B. J. Lewis, R. Dickson, F. C. Iglesias, G. Ducros, and T. Kudo, “Overview of experimental
programs on core melt progression and fission product release behaviour,” J. Nucl. Mater., vol. 380, no. 1–3, pp. 126–143, Oct. 2008.
[9] D. A. Petti, Z. R. Martinson, R. R. Hobbins, C. M. Allison, E. R. Carlson, D. L. Hargman, T. C. Cheng, J. K. Hartwell, K. Vinjamuri, and L. J. Seifken, “Power Burst Facility (PBF) Severe Fuel Damage Test 1-4 Test Results Report,” US Nuclear Regulatory Commission, NUREG/CR-5163, EGG-2542, Apr. 1989.
[10] D. A. Petti, Z. R. Martinson, R. R. Hobbins, and D. . Osetek, “Results from the power burst facility severe fuel damage test 1-4. A simulated severe fuel damage accident with irradiated fuel rods and control rods,” Nucl. Technol., vol. 94, no. 3, pp. 313–335, Jun. 1991.
[11] K. O. Reil, A. C. Marshall, R. W. Ostensen, P. S. Pickard, C. P. Fryer, and K. T. Stalker,
“Proceedings of the International Topl. Mtg. Thermal Reactor Safety,” San Diego, California, Feb-1986.
[12] M. Schwarz, G. Hache, and P. von der Hardt, “PHEBUS FP: a severe accident research
programme for current and advanced light water reactors,” Nucl. Eng. Des., vol. 187, no. 1, pp. 47–69, Jan. 1999.
[13] M. Schwarz, B. Clement, and A. . Jones, “Applicability of Phebus FP results to severe accident safety evaluations and management measures,” Nucl. Eng. Des., vol. 209, no. 1–3, pp. 173–181, Nov. 2001.
[14] B. Andre, G. Ducros, J. P. Leveque, M. F. Osborne, and R. A. Lorenz, “Fission product releases at severe light water reactor accident conditions: ORNL/CEA measurements versus calculations,” Nucl. Technol., vol. 114, no. 1, pp. 23–49, Apr. 1996.
[15] G. Ducros, Y. Pontillon, and P. P. Malgouyres, “Synthesis of the VERCORS experimental
programme: Separate-effect experiments on Fission Product release, in support of the PHEBUS-FP programme,” Ann. Nucl. Energy, vol. 61, pp. 75–87, Nov. 2013.
[16] T. Kudo, T. Nakamura, M. Kida, and T. Fuketa, “Technical Meeting on Severe Accident and Accident Management,” Tokyo, Japan, 14-Mar-2006.
[17] Z. Liu, D. S. Cox, R. S. Dickson, and P. H. Elder, “Proceedings of the 15th Annual Canadian Nuclear Society Conference,” Montreal, Quebec, 05-Jun-1994.
[18] Y. Pontillon and G. Ducros, “Behaviour of fission products under severe PWR accident conditions. The VERCORS experimental programme—Part 3: Release of low-volatile fission products and actinides,” Nucl. Eng. Des., vol. 240, no. 7, pp. 1867–1881, Jul. 2010.
19 [19] Y. Pontillon and G. Ducros, “Behaviour of fission products under severe PWR accident
conditions: The VERCORS experimental programme—Part 2: Release and transport of fission gases and volatile fission products,” Nucl. Eng. Des., vol. 240, no. 7, pp. 1853–1866, Jul. 2010. [20] Y. Pontillon, G. Ducros, and P. P. Malgouyres, “Behaviour of fission products under severe PWR
accident conditions VERCORS experimental programme—Part 1: General description of the programme,” Nucl. Eng. Des., vol. 240, no. 7, pp. 1843–1852, Jul. 2010.
[21] U. S. Nuclear Regulatory Commission, “Technical bases for estimating Fission Products behavior during LWR accidents,” Oak Ridge National Laboratories, NuREG-0772, 1981.
[22] P. G. Lucuta, “Microstructural features of SIMFUEL - Simulated high-burnup U0,-based nuclear fuel,” J. Nucl. Mater., vol. 178, pp. 48–60, 1991.
[23] G. Ducros, S. Bernard, M. P. Ferroud-Plattet, and O. Ichim, “Use of gamma spectrometry for measuring fission product releases during a simulated PWR severe accident: application to the VERDON experimental program,” presented at the Int. Conf. ANIMA 2009, Marseille, France, 2009.
[24] G. Brillant, C. Marchetto, and W. Plumecocq, “Fission product release from nuclear fuel I. Physical modelling in the ASTEC code,” Ann. Nucl. Energy, vol. 61, pp. 88–95, Nov. 2013. [25] G. Brillant, C. Marchetto, and W. Plumecocq, “Fission product release from nuclear fuel II.
Validation of ASTEC/ELSA on analytical and large scale experiments,” Ann. Nucl. Energy, vol. 61, pp. 96–101, Nov. 2013.
[26] G. Nicaise and V. D. Ozrin, “Analysis of accidental sequence tests and interpretation of Fisson Product release: Interdependence of Cs, Mo and Ba release,” 8th International Conference on CANDU fuel, Honey Harbour, Canada, Sep-2003.
[27] H. Kleykamp, “The Chemical State of Fission Products in Oxide Fuels,” J. Nucl. Mater., vol. 131, pp. 221–246, 1985.
[28] H. Kleykamp, “The solubility of selected fission products in UO2 and (U,Pu)O2,” J. Nucl. Mater., vol. 206, no. 1, pp. 82–86, 1993.
[29] I. LLorenz, P. L. Solari, B. Sitaud, R. Bès, S. Camelli, H. Hermange, G. Othmane, S. Safi, P. Moisy, S. Wahu, C. Bresson, M. L. Schlegel, D. Menut, J. L. Bechade, P. Martin, J. L. Hazemann, O. Proux, and C. Den Auwer, “X-ray absorption spectroscopy investigations on radioactive matter using MARS beamline at SOLEIL synchrotron,” Radiochim Acta, vol. 102, no. 11, pp. 957–972, 2014.
[30] B. Ravel and M. Newville, “ATHENA, ARTEMIS, HEPHAESTUS: Data analysis for X-ray absorption spectroscopy using IFEFFIT,” J. Synchrotron Radiat., vol. 12, no. 4, pp. 537–541, Jul. 2005. [31] B. W. Mott and J. Williams, “LXXXVIII. The thermal etching of uranium,” Lond. Edinb. Dublin
Philos. Mag. J. Sci., vol. 44, no. 355, pp. 841–844, Aug. 1953.
[32] H. Kleykamp, “Constitution and thermodynamics of the Mo-Ru, Mo-Pd, Ru-Pd and Mo-Ru-Pd systems,” J. Nucl. Mater., vol. 167, pp. 49–63, Sep. 1989.
[33] P. M. Martin, R. C. Belin, P. J. Valenza, and A. C. Scheinost, “EXAFS study of the structural phase transition in the americium zirconate pyrochlore,” J. Nucl. Mater., vol. 385, no. 1, pp. 126–130, Mar. 2009.