Review
Role of wavefront curvature in propagation of cardiac impulse
Vladimir G. Fast
), Andre G. Kleber
´
´
Department of Physiology, UniÕersity of Berne, Buhlplatz 5, CH-3012 Berne, Switzerland¨ Received 17 June 1996; accepted 17 October 1996
Abstract
Ž .
It is traditionally assumed that impulse propagation in cardiac muscle is determined by the combination of two factors: 1 the active
Ž .
properties of cardiac cell membranes and 2 the passive electrical characteristics of the network formed by cardiac cells. However, advances made recently in the theory of generic excitable media suggest that an additional factor—the geometry of excitation wavefronts —may play an important role. In particular, impulse propagation strongly depends on the wavefront curvature on a small spatial scale. In the heart, excitation wavefronts have pronounced curvatures in several situations including waves initiated by small electrodes, waves emerging from narrow tissue structures, and waves propagating around the sharp edges of anatomical obstacles or around a zone of functional conduction block during spiral wave rotation. In this short review we consider the theoretical background relating impulse propagation to wavefront curvature and we estimate the role of wavefront curvature in electrical stimulation, formation of conduction block, and the dynamic behavior of spiral waves.
Keywords: Myocardium; Wave front; Impulse propagation; Conduction; Reentry; Spiral wave
1. Introduction
The mechanisms of impulse propagation in the heart have been extensively studied for several decades both
w x
theoretically and experimentally 1–4 . It has been firmly established that impulse propagation is dependent on two
Ž .
tissue properties: 1 the passiÕe electrical properties of cardiac muscle defined by the tissue micro-architecture, the cell shapes, the passive membrane characteristics, and
Ž .
the distribution of gap junctions, and 2 the excitable membrane properties defined by the distribution,
conduc-tances, and kinetic characteristics of ionic channels, trans-porters, and pumps. From the biophysical point of view, cardiac tissue belongs to the class of so-called ‘reaction– diffusion systems’ in which a local reaction, such as an action potential, propagates through a medium due to the release of stored biochemical energy. It shares important aspects of its biophysical behavior with a variety of other excitable systems not only of biological, but also of
physi-)
Corresponding author. Tel. q41 31 631-87-11; Fax q41 31 631-46-11; E-mail: fast@pyl.unibe.ch
w x
cal and chemical origin 5 . Investigation of these systems, first by means of mathematical modeling and subsequently in experiments, has shown that in addition to the passive and active properties of the medium, a third factor—the
geometry of the excitation waÕefront—contributes to wave
w x
propagation 6,7 . Particularly, the curÕature of a wave-front may cause slowing of propagation and conduction block. Also, wavefront curvature is important for defining the properties of spiral waves which are responsible for some types of cardiac tachyarrhythmias. The concept of wavefront curvature has recently been applied to studies of impulse conduction in cardiac muscle, provoking new experimental and modeling work. The purpose of this short article is to discuss the new data obtained in these studies together with the theoretical background and to evaluate the role of wavefront curvature in normal and abnormal impulse propagation and in the mechanisms of re-entrant excitation. The role of wavefront curvature in the behavior of spiral waves will be discussed in detail.
Time for primary review 21 days. 0008-6363r97r$17.00 Copyright q 1997 Elsevier Science B.V. All rights reserved.
Ž . PII S 0 0 0 8 - 6 3 6 3 9 6 0 0 2 1 6 - 7
2. Effects of wavefront curvature on wave propagation
2.1. WaÕefront curÕature and conduction Õelocity
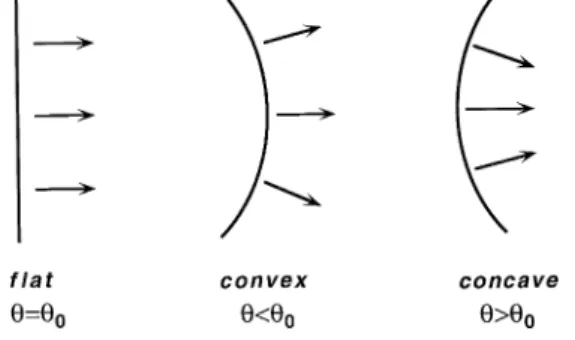
The basic mechanism relating wavefront curvature to
Ž .
velocity of propagation u in an excitable medium is illustrated in Fig. 1. For simplicity, the medium is assumed to be 2-dimensional and isotropic; the effects of wavefront curvature in 3-dimensional and in anisotropic media will be considered later. In the case of a flat wavefront, conduc-tion velocity is equal to the steady-state velocity in a
Ž .
one-dimensional strand. The steady-state velocity u0 is solely determined by the passive and active properties of
Ž w x.
excitable tissue e.g., Ref. 1 . When the excitation front is
Ž .
curving outward convex , the conduction velocity is lower than u . This is because the local excitatory current sup-0 plied by the cells at the front of a convex wave distributes over a larger membrane area downstream. An opposite process takes place when the excitation front is curving
Ž .
inwards concave . In this case, excitatory current con-verges in front of the propagating wave, producing a more rapid membrane depolarization. As a result, the conduction velocity of a concave wavefront is larger than u . The0
degree of wavefront bending is characterized by the local
Ž .
curvature r which is defined as the negative reciprocal of
Ž .
the local radius of curvature r : 1
r s y
r
It follows from this definition that the convex front has a negative r, the concave front has a positive r, and r s 0 for a flat front. A quantitative description of the depen-dence of conduction velocity on curvature in a continuous isotropic 2-dimensional excitable medium can be obtained
w x
analytically for small values of r. Zykov and Morozova 8 have shown that under such conditions the velocity is given by the following equation:
u s u q Dr0
Ž .
1The coefficient D is determined by the passive properties of the medium. For a continuous isotropic model of the electrical structure of cardiac muscle, D is equal to 1rC S R where Cm v i m is the specific membrane capaci-tance, S is the cell surface-to-volume ratio, and R is thev i
intracellular resistivity.
Fig. 1. Effect of wavefront geometry on propagation velocity u. u0
denotes the steady-state velocity in a one-dimensional medium.
2.2. Critical curÕature and conduction block
Since conduction velocity decreases as the wavefront curvature becomes more negative, it follows that the
veloc-Ž .
ity will become zero at some critical level of r r , andc
the excitation wave will be blocked. Moreover, in the case of a circular nucleus of excitation, propagation will not take place if the radius of the nucleus is less than a critical radius, r . A rough theoretical estimate of r and r canc c c
Ž .
be obtained from Eq. 1 . Assuming that the linear rela-tionship between the wavefront velocity and the curvature is preserved at high r values, the velocity will become zero when r and r satisfy the following equations:
u0 D
r s yc or r sc
Ž .
2D u0
The effects of curvature on wave propagation have been
w x
extensively studied in mathematical models 6,7,9–12 . Experimentally, they have been demonstrated in several excitable systems including the chemical
Belousov-w x
Zhabotinsky reaction 13,14 and a biological system
pro-w x
ducing calcium waves in Xenopus laeÕis oocytes 15 . The fact that these effects have been considered only rarely in heart tissue until recently is explained by the small radii at which wavefront curvature significantly af-fects conduction. In order to estimate quantitatively the effect of r on the conduction velocity in ventricular
my-Ž
ocardium, we assume R to be 400 V cm longitudinali
w x. 2
direction 16 , Cm to be 1 mFrcm , and Sv to be 0.33
y1 w x
mm 17 . Under such conditions the coefficient D is
2 Ž .
approximately 0.76 cm rs. The propagation velocity u0 of the flat excitation front is approximately 50 cmrs in the
w x
longitudinal direction 16,18 . Introducing D and u into0
Ž . y1
Eq. 2 yields a critical curvature r s 66 cmc which corresponds to a critical radius of curvature r s 152 mm.c
Detection of a circular nucleus of excitation of such a small radius requires a spatial resolution of - 100 mm,
which is difficult to achieve by using conventional map-ping techniques with arrays of extracellular electrodes. It should be noted that estimates of r and r based on Eq.c c Ž .2 may include two types of errors: 1 the dependence ofŽ . u on r in cardiac muscle may be non-linear at high values
Ž .
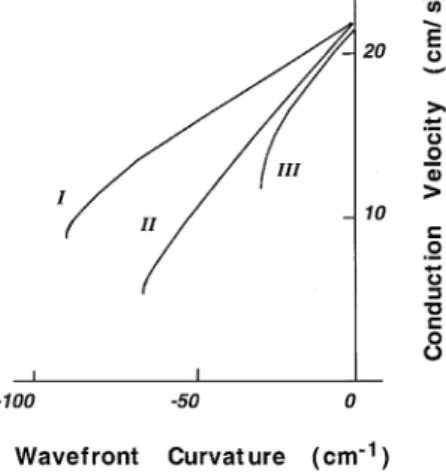
of r and 2 the dependence of u on r may show a discontinuity near rc and, correspondingly, conduction velocity may decrease to zero abruptly. The precise shape
Ž .
of the function u s f r in cardiac tissue is not yet known. Examples of the dependence of u on r for several
ex-Ž .
citable models Fig. 2 suggest that the true value for the critical curvature may be somewhat smaller and the critical
Ž .
radius larger than predicted by Eq. 2 .
An important factor affecting wave propagation in
ven-Ž .
tricular myocardium is its 3-dimensional 3D structure. The theory linking conduction velocity to wavefront
curva-Ž .
ture according to Eq. 1 is valid for the 3D case as well. However, the relation between the curvature and the local radius in 3D tissue can be more complex than in
2-dimen-Fig. 2. Dependence of propagation velocity on wavefront curvature in
w x
several models of excitable media. I s Noble model 86 ; II s Hramov
w x
and Krinsky model; III s Gul’ko and Petrov model 69 . Reproduced
w x
with permission 8 .
Ž .
sional 2D tissue. For a cylindrical wavefront which is a 3D analogue of a circular wavefront, the relationship be-tween the curvature and the local radius is the same as in
Ž .
the 2D medium r s y1rr . For a sphere with radius r
Ž .
the local 3D curvature r3D is: 2
r3Ds y
Ž .
3r
Ž .
It follows that the critical radius rc in a 3D medium is 2 times larger than r in a 2D medium. Thus, the estimatec
for rc of 152 mm in isotropic 2D cardiac tissue corre-sponds to 300 mm in 3D tissue. This difference reflects the fact that, for a given radius, the dissipation of excitatory current from a spherical 3D wavefront is larger than from the circular 2D wavefront.
2.3. Dependence of critical curÕature on actiÕe and pas-siÕe tissue properties
Ž .
Eq. 2 allows one to predict how modulation of either passive or active tissue properties will affect the critical curvature. It follows from this equation that the effect of a change in membrane excitability on rc is solely deter-mined by the change of u and can, therefore, be estimated0
from experimental measurements of u . For example, it is0
well known that conduction velocity decreases with high excitation rates. In atrial myocardium, velocity decreases approximately 2-fold in response to a very early premature stimulus or during pacing at the shortest possible interval
w19 . According to Eq. 2 , a 2-fold increase of the criticalx Ž . Ž .
radius rc is expected in these conditions. This frequency-dependent increase of rc may be particularly important in tachycardias including flutter, or fibrillation.
Ž .
According to Eq. 2 , cell-to-cell coupling affects rc
Ž .
and rc via both the conduction velocity u0 and the coefficient D. In a continuous uniform medium, the con-duction velocity is inversely proportional to the square-root
of intracellular resistivity R while the coefficient D isi
inversely proportional to R . It follows that r is inverselyi c
proportional to R1r2i . This dependence also allows one to evaluate the effect of anisotropy on critical curvature and critical radius. Thus, a wavefront propagating in the longi-tudinal direction has a critical radius of curvature which is
ŽR rRT L.1r2 times smaller than the rc for a wavefront
propagating in the transverse direction, where RT and RL are axial resistivities in longitudinal and transverse direc-tions, respectively. Also, a circle of critical radius in an isotropic medium corresponds to an ellipse in an anisotropic medium with the transverse axis of this ellipse shortened
Ž .1r2
by the factor R rRT L .
3. Occurrence of curved wavefronts in cardiac muscle
The estimates of critical curvature given above indicate that curvature effects are expected to become apparent in cardiac muscle when excitation fronts have bending radii
- 150–300 mm. In cardiac tissue curved wavefronts with
small radii are encountered in a variety of situations which
Ž .
include: 1 centrifugal propagation from a small
stimulat-Ž .
ing electrode or from a small group of pacemaker cells; 2 abrupt changes in tissue geometry with propagation emerg-ing from small narrow strands or isthmuses into a large mass of excitable tissue. Examples of such structures are Purkinje–muscle junctions, insertions of accessory path-ways into ventricular muscle in the WPW syndrome, and probably surviving cell strands connecting regions of intact
Ž .
tissue in infarcted muscle; 3 propagation of a wave around a fixed anatomical or functional conduction block;
Ž .4 spiral wave rotation.
3.1. WaÕe propagation following point stimulation
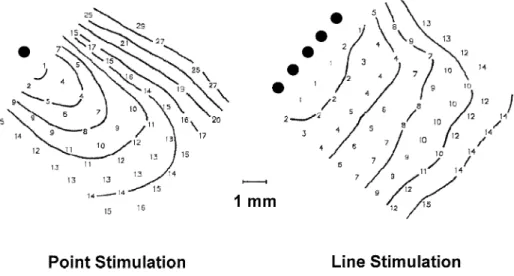
Direct experimental evidence that wavefront curvature affects propagation of waves initiated from small stimulat-ing electrodes was recently obtained by Knisley and Hill
w20 . They investigated impulse conduction in 2-dimen-x
sional rims of epicardial tissue stimulated either by a single electrode or by a linear array of electrodes as shown in Fig. 3. Optical mapping of activation spread with a laser scanning technique demonstrated that stimulation with a single electrode resulted in an elliptic spread of excitation while stimulation with a linear array produced a nearly flat activation front. As a result of increased wavefront curva-ture, the velocity of the elliptical propagation was on the average 13% smaller than that of the flat wavefront. In these measurements, the spatially averaged velocity values were compared which underestimate the effect of steep wavefront curvature on local conduction velocity immedi-ately near the stimulating electrode. Nevertheless, these data clearly demonstrate the importance of wavefront cur-vature. Measurements of conduction velocity as a function
Ž .
Fig. 3. Effect of point stimulation versus linear stimulations on activation spread. Stimulation with a single electrode point stimulation produces a convex
Ž .
excitation front. Stimulation with a line of electrodes line stimulation produces an almost flat excitation front. Numbers denote activation times in
w x
milliseconds relative to the earliest activation. Interval between isochrones is 3 ms. Reproduced with permission 20 .
of curvature at small values of r were taken to determine
Ž .
the coefficient D in Eq. 1 . The mean longitudinal D
2 Ž .
value was 0.47 cm rs. According to Eq. 2 this corre-sponds to a critical radius of 92 mm.
3.1.1. WaÕefront curÕature and ‘liminal area’
The inability of excitable tissue to support propagation of waves with curvatures higher than rc suggests that a critical number of cells encompassed within a nucleus of excitation with radius rc must be excited to achieve a propagated response. A similar requirement has long been recognized for 1D excitable strands and formulated in the
w x
concept of ‘liminal length’ 21,22 . The ‘liminal length’
was defined as the length of an excited strand segment necessary to produce the local current required for a propagated response. Accordingly, in a 2D tissue this critical number of cells is characterized by a ‘liminal area’
w23 . Although the ‘liminal area’ of impulse initiation andx
a curved wavefront with a ‘critical radius’ may differ with respect to membrane potential distribution within the ex-cited portion of the tissue, the common features between these processes can be used to estimate the ‘critical radius’ from the dimension of the ‘liminal area’, independently of
Ž .
the parameters D and u in Eq. 2 .0
The liminal area has been calculated in a 2-dimensional
w x
computer model by Ramza et al. 24 . They studied
im-Ž . Ž .
Fig. 4. Effect of the radius of a circular stimulation electrode on current threshold A and stimulus energy B . Epicardial stimulation of canine heart.
w x
pulse initiation produced by a point current injection in a continuous, isotropic model described by Beeler-Reuter
w x
ionic kinetics 25 . The liminal area necessary to generate sufficient inward current during stimulation was deter-mined as a function of the maximal sodium conductance. At a level of excitability estimated to correspond to that of adult ventricular myocardium, the radius of the liminal area was 200–250 mm. This compares well with the
Ž .
estimates of the critical radius calculated from Eq. 2 . Experimentally, the liminal area was estimated from mea-surements of stimulation threshold as a function of
elec-w x
trode size by Lindemans and co-workers 23,26 . Stimula-tion current was applied to canine epicardium via disk electrodes with radii varying between 0.01 and 9 mm. As illustrated in Fig. 4A, it was found that the current thresh-old was independent of the electrode size when the disk radius was less than 0.2 mm. However, the current thresh-old was proportional to the electrode radius to the power 1.5 when the radius was larger than 0.4 mm. This behavior was explained by noting that, with small electrodes, all current passed through the liminal area and, therefore, current density at the edge of the liminal area was indepen-dent of the electrode size. With large electrodes, more current had to be provided to maintain a constant stimula-tory current density as the electrode surface area increased. Thus, the estimated radius of the liminal area was approxi-mately 0.3 mm. If we assume that the disk electrode excited a semi-spherical area of cardiac tissue under the epicardial surface, then this situation is equivalent to exci-tation of a spherical region in a tissue filling the whole 3D space. Therefore, the measured radius of the liminal area can be taken as an estimate of the critical radius of curvature. Scaled down from 3 to 2 dimensions, the esti-mated critical radius of 300 mm in the 3D tissue corre-sponds to 150 mm in the 2D tissue, which is close to the other estimates of the critical radius. Lindemans and
Zim-w x w x
merman 26 and Winfree 27 also pointed out a practical consequence of the ‘liminal area’ effect: an electrode with a radius matching the radius of liminal area is the most
Ž
efficient i.e., it requires the lowest stimulation energy, as
.
illustrated in Fig. 4B .
3.2. CurÕed waÕefronts at geometrical expansions
Abrupt geometrical expansions such as transitions from narrow strands to a large volume of myocardium or narrow isthmuses of tissue bridging two large areas of atrial or ventricular myocardium have been implicated in the for-mation of unidirectional conduction block and re-entry. Examples of such structures include the Purkinje–muscle
w x
junction 28 , the junction between accessory pathways and
w x
myocardium in the WPW syndrome 29,30 , and the junc-tion between thin cell strands surviving within an infarcted
w x
myocardium and intact tissue 31,32 . The failure of im-pulse transmission at such structures was attributed to the ‘impedance mismatch’ between the strands and the wide
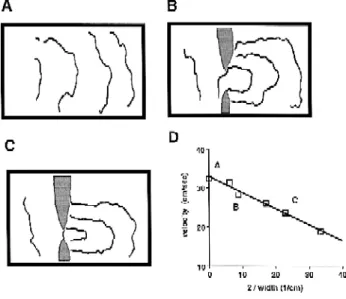
Fig. 5. Wave propagation across a narrow tissue isthmus in an isolated
Ž .
ventricular preparation of sheep heart. A Map of activation spread
Ž .
before an isthmus was produced. B Activation spread in the same preparation with isthmus 2.26 mm wide. The isthmus was produced by
Ž . Ž .
two tissue cuts gray zones . C Activation spread after the isthmus was
Ž .
reduced to 0.88 mm. D Local conduction velocity measured across the
w x
isthmus as a function of isthmus width. Reproduced with permission 36 .
tissue regions in analogy to conduction block in branching
w x
axons or cell strands 33–35 . More recently, however, a different approach was proposed which is based on consid-eration of the curvature of the wave front emerging from an expansion instead of the impedance mismatch at the
w x
transitional region. Cabo et al. 36 investigated impulse propagation across narrow isthmuses in isolated sheets of ventricular epicardial muscle using a video-imaging tech-nique. As shown in Fig. 5, cuts were made in the
prepara-Ž
tions so that only a narrow isthmus of tissue 0.9–2.2 mm
.
in width bridging two large areas was left intact. The excitation wave emerging from such an isthmus had an
Ž
elliptical shape with a pronounced curvature panels B and
.
C : the smaller the isthmus width, the higher the curvature of the elliptical wavefront beyond the isthmus. In accor-dance with the expected effect of increased curvature, conduction velocity in the region immediately beyond the isthmus decreased as the isthmus width became smaller
Žpanel D . At the smallest isthmus shown in panel D the.
conduction velocity is 19 cmrs, 42% smaller than the
Ž .
velocity of the flat wave 33 cmrs . The critical radius, r ,c was estimated from the minimal isthmus width allowing passage of excitation waves between two large areas at
Ž
various stimulation frequencies. At long cycle lengths 200
.
to 500 ms the critical width was estimated to be - 1 mm
in the longitudinal direction, corresponding to rc- 0.5
Ž .
mm. At a short excitation interval 150 ms excitability was reduced and the critical isthmus width increased to
Ž .
1.3–2 mm critical radius 0.65–1 mm . At the maximal
Ž .
frequency of stimulation 117 ms interval isthmuses with
Ž .
width - 2.5 mm r - 1.2 mm resulted in conductionc
A similar expanding structure, consisting of a thin long strand emerging into a large tissue area, has been recently
w x
investigated both experimentally 37,38 and theoretically
w39 . In computer simulations impulse propagation from ax
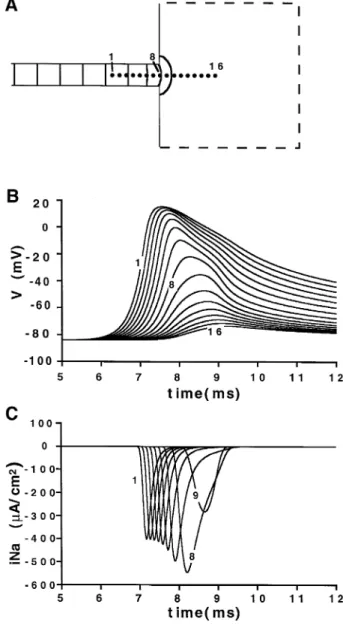
strand into a large area failed when the strand width was reduced below 200 mm in a 2D model or 350 mm in a 3D model. Fig. 6 illustrates the block of impulse propagation in the 2D model. The precise localization of the site of conduction block was obtained from the recordings of the
Ž .
excitatory inward sodium current panel C . These record-ings demonstrate that conduction block occurred beyond the site of geometrical expansion. A small circular nucleus of excitation emerged into the large area. Pronounced curvature of this nucleus imposed a large current drain on the wavefront and excitation did not propagate further. Experimentally, wave propagation from a narrow strand into a large cell area has also been investigated in cell cultures as a function of the strand width using
high-reso-w x
lution optical mapping of transmembrane potential 38 . In these studies, narrow myocyte strands emerging into a cell monolayer were produced using a patterned-growth
tech-w x
nique 40 . As in simulations, wave propagation was either slowed or blocked when the strand width was reduced below a critical level. The critical strand width was ap-proximately 30 mm. This is significantly smaller than the estimates of critical radius given above. This difference was explained by several geometrical and electrophysio-logical features of cell cultures: a shorter electrotonic space constant than in the adult myocardium, electrophysi-ological heterogeneity between the strands and the large areas, and a gradual increase of the strand width before the transition to the large area. When these properties were included into the computer model, a close fit between
w x
experimental and simulated results was obtained 39 . We would like to point out that the two approaches—the ‘wavefront curvature’ or ‘impedance mismatch’—are re-lated to the same biophysical mechanism: namely, the balance of electrical currents during wave propagation or the ‘source–sink’ relationship. The approach based on consideration of the wavefront curvature has an advantage of being able to relate, in a simple way, conduction block to electrophysiological parameters which can be directly
Ž
measured in experiments i.e., steady-state conduction
ve-.
locity and passive tissue properties . Also, it helps to understand the occurrence of conduction block at an
isth-Ž .
mus connecting two equal i.e., symmetrical areas where no impedance mismatch is present.
3.3. WaÕefront curÕature and propagation around sharp obstacles
Sharp, longitudinally oriented obstacles, which may be structural or functional in nature, are thought to play an
w x
important role in so-called ‘anisotropic re-entry’ 41 . They have been described in the border zone of experimental
w x
infarcts and in the aging heart 41,42 . Computer
simula-Fig. 6. Block of impulse propagation at a site of abrupt expansion from a narrow conducting strand into a large excitable area. Two-dimensional
w x
computer model with Luo-Rudy 43 ionic kinetics. Strand width s 175
Ž . Ž
mm. A Isochrone map of wave propagation with interval of 0.3 ms. B
. Ž .
and C Recordings of membrane voltage V and inward sodium current
ŽiNa at the selected points depicted in panel A. Note that the depolariza-.
tion wave invaded the large area creating a small circular nucleus of excitation. However, the excitation wave did not propagate beyond 100
w x mm from the expansion. Reproduced with permission 39 .
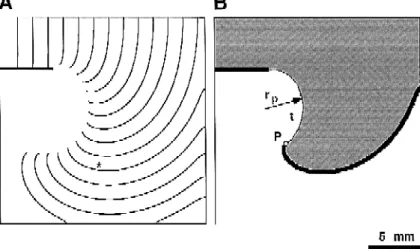
tions and recent experiments demonstrate that wavefront curvature has a profound effect on wave propagation near the sharp edges of such obstacles. Fig. 7 demonstrates wave propagation in a computer model of an excitable medium with a thin resistive obstacle. Ionic currents in this
w x
model are described by the Luo-Rudy kinetics 43 with maximal sodium conductance reduced to approximately 30% of its nominal value. As in Fig. 6, local activation is defined by the flow of sodium inward current. The refrac-tory state is defined by inactivation of the sodium current.
Ž .
w x
Fig. 7. Detachment of an excitation wave from the sharp edge of an unexcitable obstacle. Computer model with Luo-Rudy 43 ionic kinetics. The maximal
2 Ž . Ž .
sodium conductance was reduced to 6.6 mSrcm . A Isochronal map of activation spread with an interval of 5 ms. B Snapshot of activation at the moment marked by the asterisk in panel A. The black color shows the excited area defined by the activation of inward Naq
current. The gray color shows the area in the refractory state as defined by Naq
current inactivation. Point P marks the wave tip, defined as a point where excited, refractory, and resting
Ž .
states meet. The dashed line t shows the trajectory of the wave tip with the radius r .p
as the propagation wave approaches the pivoting point, it detaches from the obstacle and describes a trajectory around a circular area which remains in the resting state. The detachment takes place since the critical curvature of the wavefront prohibits an abrupt turn around the sharp edge of the obstacle. Several electrophysiological features of this effect are of special importance not only for charac-terizing the process of propagation around unexcitable obstacles but also for describing the behavior of spiral
Ž .
waves in general see below . As illustrated in Fig. 7B,
Ž
there is a point on the wavefront detached from the
. Ž .
obstacle where 3 states—the excited state black , the
Ž . Ž .
refractory state gray , and the resting state white —meet. We define this singular point as the tip of the wavefront. Accordingly, it is used to define the tip of a spiral wave
Ž .
and to describe spiral wave rotation see below . The
Ž .
radius of the pivoting trajectory rp is determined by the critical wavefront curvature or the critical radius, r . Atc present, the exact value of rp in cardiac muscle is not known. The lack of detachment of a wave front from unexcitable obstacles in cardiac muscle under normal physiological conditions indicates that rp is rather small
Ži.e., smaller than the spatial resolution of the mapping
techniques which amounted to several hundred
microme-. w x
ters in these experiments 44,45 . However, reduction of
Ž
tissue excitability e.g., by application of tetrodotoxin or
.
by stimulation at high rates increases rc and rp and causes detachment of wavefronts from a sharp obstacle
w44 . Under conditions of very low excitability, the radiusx
of the pivoting trajectory can become larger than the wavelength of excitation, the product of conduction veloc-ity and refractory period. In this case, the wave may perform a complete turn without reconnecting to the obsta-cle and form a spiral wave. The detachment of excitation waves from sharp obstacles and subsequent formation of
spiral waves was first described in a computer model at
w x
high excitation rates 46 ; experimentally this has been observed in the chemical Belousov-Zhabotinsky reaction
w47 and more recently in heart muscle 44 .x w x
4. Wavefront curvature and spiral waves
One of the most remarkable examples of wave propaga-tion in which curvature plays an important role is a spiral wave of excitation. Spiral waves occur universally in
w x
excitable media including chemical reactions 48,49 ,
neu-Ž w x
ral tissue depression waves in the retina 50 and cerebral
w x.
cortex 51 , intracellular calcium signaling systems
ŽXenopus laeÕis oocytes 15 , cardiac myocytes 52 , andw x w x. w x
amoebae colonies 53 . One of the most extensively
stud-Ž .
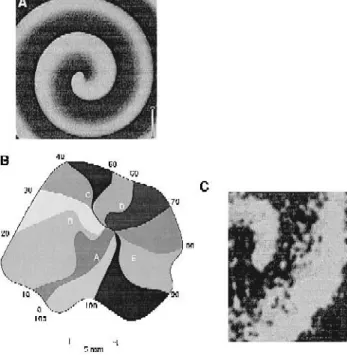
ied examples is the Belousov-Zhabotinsky BZ reaction. In this reaction, malonic acid is reversibly oxidized by bromate in the presence of ferroin. In this process, ferroin changes in color from red to blue and then back to red, which allows the visual observation of the reaction. Fig. 8A shows a rotating spiral wave in a thin 2-dimensional layer of the BZ reaction. In the center of the rotating wave
Žcore the tip of the wave moves along a complex trajec-.
tory and radiates waves into the surrounding medium. Since the velocity of a convex wavefront cannot exceed
Ž .
the speed of the flat wave u0 the rotating wave always acquires the shape of an Archimedean spiral at the periph-ery, independently of the behaÕior of its core. Because of this shape, rotating waves were given the name ‘spiral waves’. Other names used in the literature include ‘ vortices’ and ‘reverberators’. In some cases, the term ‘rotor’ was used to refer to the core of a spiral wave.
Important properties of spiral waves including the rota-tion period, size, and dynamic behavior are determined by
Ž .
Fig. 8. Rotating waves in various excitable media. A Spiral wave in the
w x Ž .
Belousov-Zhabotinskii reaction. Reproduced with permission 49 . B Isochronal activation map of ‘leading circle’ re-entry in an isolated
w x Ž .
preparation of rabbit atrial muscle. Reproduced with permission 64 . C Spiral wave in an isolated preparation of canine epicardial muscle imaged
w x
using voltage-sensitive dye. Reproduced with permission 71 .
the wave propagation in the core where the wavefront has a pronounced curvature. The theory of excitable waves suggests that two factors—the wavefront curvature and the refractory period—contribute to the period of spiral wave
w x
rotation 6,10 . Mutual dependence and interaction be-tween these parameters result in a complex behavior of spiral waves. Because of this complexity, the understand-ing of spiral wave dynamics relies heavily on computer modeling. A convenient way to relate the behavior of spiral waves with model parameters is to use cellular automata models of cardiac excitation. In such models,
Ž
excitable elements are described by 4 states excited,
abso-.
lute refractory, relative refractory, and resting and the transition from one state to another is governed by formal
w x
rules 54 . One of the advantages of these models is that integrative properties of excitable media such as excitabil-ity and the durations of the absolute and relative refractory periods are set as model parameters and can be modified independently. Importantly, these models can be con-structed to reproduce the effects of wave front curvature on conduction velocity. Although cellular automata models oversimplify active and passive properties of cardiac tis-sue, they provide an easy insight into spiral wave dynam-ics.
4.1. CurÕature and spiral waÕe dynamics
Fig. 9 demonstrates 3 different types of spiral wave rotation in a cellular automata model of excitable medium
w55 . As in Fig. 7, the wavefront tip is defined as the pointx
where 3 states—the excited, the refractory, and the resting —are in contact with each other. Fig. 9A shows the simplest type of spiral wave rotation when the excitability in the model is very low. In this case, the critical radius
Žrc.and therefore the pivoting radius of the wave tip rŽ p. Ž .
are large. By contrast, the wavelength of excitation l
Ž .
given by the product of the velocity of propagation u and
w Ž .x
the refractory period R, l s u) R is small as a result of the small u. Under these conditions the length of the
Ž .
pivoting trajectory 2 p rp is larger than l, and therefore propagation of the excitation wavefront is not affected by the refractory tail. The only constraint on the wavefront propagation is imposed by the curvature at its tip. Because the wavefront curvature cannot exceed the critical
curva-Ž .
ture rc the wave tip does not extend towards the center
Ž
of the rotation but follows a circular trajectory panel A,
.
bottom . The area circumscribed by the circle is never excited and remains at rest. In addition, there is a zone in the resting state between the wave front and the wave tail. In other words, the spiral wave contains a fully excitable gap.
At a higher level of excitability, when r decreases andp
the length of the pivoting trajectory becomes comparable
Ž .
with the wavelength of excitation 2 p r f l , the front ofp
the excitation wave meets its own refractory tail, as shown in Fig. 9B. As a result, the wavefront velocity decreases and the front retreats from the refractory tail. It now propagates in a fully recovered medium and the velocity increases again. The alternation of wavefront acceleration and retardation repeats itself in a complex dynamic man-ner. Such a front–tail interaction results in a ‘meandering’ of the spiral wave tip as shown at the bottom of panel B. The movement of the wave tip in this case follows a cycloidal or ‘flower’ trajectory. Such a meandering move-ment of spiral waves was observed in the BZ reaction
Fig. 9. Effect of wavefront curvature on spiral wave rotation in a cellular automata model of an excitable medium. Upper panels show snapshots of activation. Excited, absolute refractory, relative refractory, and resting states are shown in black, dark gray, light gray, and white, respectively.
Ž .
Lower panels show enlarged trajectories of the spiral wave tip. A
Ž
Circular type of rotation in a model with large critical curvature 2 p rp) . Ž .
l . B Cycloidal type of rotation in a model with intermediate level of
Ž . Ž .
critical curvature l f 2 p r . C ‘Z’ type of rotation in a model withp
Ž . w x
w5,56 and was extensively investigated in a variety ofx
w x
mathematical models 6,55,57–63 .
With a further increase of wavelength relative to the
Ž .
pivoting radius l) 2 p rp the interaction between the wave front and the partially refractory wave tail becomes stronger. Fig. 9C shows that, in this case, the wavefront penetrates deeper into the wave tail and there is no fully excitable gap. A part of the wave tip trajectory acquires a linear shape. The linear part is formed when the tip of the spiral wave moves along its refractory tail, which serves as a zone of functional conduction block. At the end of the line of the block, the wave tip performs a turn and propagates in the opposite direction. As a result, the wave tip trajectory is composed of the linear portion and two circular parts at the ends of the linear portion arranged as a letter ‘Z’, as shown in the lower part of panel C. The size of the circular parts in such a trajectory depends on the
Ž .
pivoting radius r . The length of the linear portionp
depends on the wavelength of excitation. Therefore, an increase in the ratio lrr increases the linear part of thep trajectory and decreases the circular part. In the extreme case of a negligibly small r , the propagation of thep excitation front depends only on the state of recovery in the tissue ahead of the wavefront. Consequently, the sepa-ration between the front and the absolute refractory tail is determined by the driving force of the wavefront moving within the relative refractory period. In this case the mech-anism of spiral wave rotation is similar to the mechmech-anism
w x
postulated in the so-called ‘leading circle’ concept 64 . The types of spiral wave rotation described by the cellular automata model in Fig. 9 are also observed in computer models based on partial differential equations
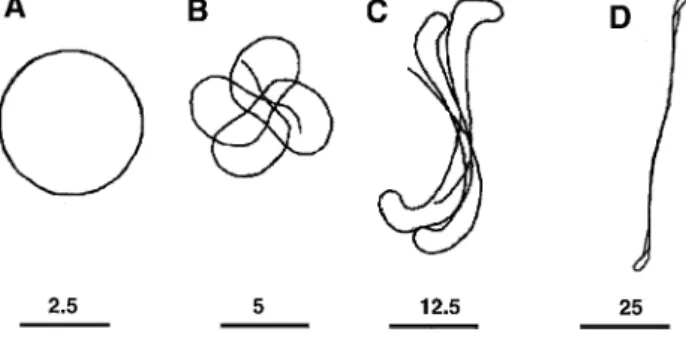
ŽFitzHugh-Nagumo model 60 and Beeler-Reuter modelw x w61 . Fig. 10 shows trajectories of the spiral wave tip inx.
the FitzHugh-Nagumo model upon increasing the
wave-Ž . Ž .
length of excitation l , while the pivoting radius rp
w x
remains constant 60 . As in the cellular automata model
ŽFig. 9 , spiral wave rotation changes from circular to.
cycloidal, and then to ‘Z’ type as the ratio between l and
r increases. Interestingly, the rotation of spiral waves inp
the computer simulations shown in Figs. 9 and 10 is never stable, except for the extreme case of circular rotation
Ž . Ž .
Fig. 10. Trajectories of the spiral wave tip of circular A , cycloidal B ,
Ž .
and ‘Z’ types C and D of rotation in the FitzHugh-Nagumo model. Bars
w x
at the bottom show relative scaling. Reproduced with permission 60 .
when the length of the pivoting trajectory is larger than l. The strongest meandering is observed at intermediate lev-els of the ratio lrr . Such meandering of spiral wavep
rotation has been implicated in the generation of polymor-phic ECG’s related to cardiac arrhythmias such as torsades
w x
de pointes 62,65 . With high values of lrrp the linear
zone of functional conduction block also moves, although more slowly.
The results presented above were obtained in isotropic models. They can be directly extended to anisotropic tissue with continuous electrical properties. In such a case, the effect of changing anisotropic tissue ratio is equivalent to geometrical scaling in the transverse direction by a factor which equals the square root of the ratio between resistivi-ties in transverse and longitudinal directions. Introducing anisotropy in such a way does not change the period of
w x
spiral wave rotation or the duration of excitable gap 66 .
4.2. Occurrence of spiral waÕes in cardiac muscle
In the heart, spiral waves have long been implicated in
w x
the generation of cardiac arrhythmias 48,67–69 . How-ever, the first experimental observation of rotating waves
w x
in atrial muscle 70 and later mapping studies in a variety of preparations revealed a pattern of activation spread that
Ž .
differed in part from the spiral shape Fig. 8B . Thus, the isochrone lines were only slightly bent and deviated from the spiral shape shown in Fig. 8A. There are two possible
Ž .
explanations for this discrepancy: 1 Only the central portion of the wave near its tip was observed in a tissue approximately 2 cm in diameter and, therefore, the spiral
Ž .
shape was less prominent. 2 The spiral shape might have been further masked by electrophysiological hetero-geneities present in atrial muscle. However, provided that the size of the preparation is large andror the excitation wavelength is small, the wavefront will inevitably acquire a spiral shape. Indeed, in preparations with short excitation
Ž
wavelength low excitability andror low degree of cellular
. Ž
coupling , rotating waves show a distinct spiral shape Fig.
. w x
8C 71 .
Ž .
As described above Figs. 9 and 10 , the type of
Ž .
rotation i.e., the trajectory followed by the spiral wave tip is determined by the relation between the excitation
wave-Ž . Ž .
length l and the pivoting radius r . The wavelength ofp excitation during sustained rotation is well known and
Ž
amounts to approximately 3 cm a velocity of 30 cmrs
.
times an absolute refractory period of 0.1 s . The value of the pivoting radius in cardiac muscle has not been mea-sured yet. As discussed above, it is very small at normal excitability, perhaps in the range of several hundred mi-crometers. Thus, l is significantly larger than the esti-mated value of the pivoting radius in the normal case. Therefore, for cardiac tissue in a normal state of cell-to-cell coupling and with normal excitability, the trajectory of the tip is expected to assume the linear or Z-type of shape shown in Fig. 9C and 10D. This theoretical consideration
is supported by experimental observation from mapping experiments showing that the zone of functional
conduc-w x
tion block often has a linear shape 19,72,73 . The linear trajectory of the rotating wave tip is also seen in the work
Ž w x.
of Allessie et al. Fig. 3 of Ref. 64 . Under conditions of reduced excitability spiral waves with cycloidal or even
Ž .
circular types of rotation Fig. 9A and 10A can be antici-pated.
4.3. WaÕefront curÕature and drift of spiral waÕes
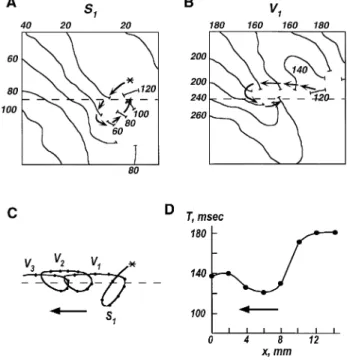
In addition to meandering in the center of a spiral wave, spiral wave instability may involve drift due to the electro-physiological heterogeneity of cardiac tissue. The first experimental observation of spiral wave drift in cardiac
w x
muscle was reported by Fast and Pertsov 74 . In this work, spiral waves were initiated in isolated 2-dimensional preparations of rabbit ventricular epicardium. Preparations were placed in a chamber with two compartments divided by a thin rubber barrier. A functional heterogeneity in refractoriness and conduction velocity was created by sep-arate superfusion of two compartments with normal versus quinidine-containing solutions. As shown in Fig. 11, pre-mature stimulation from the area with the low refractori-ness induced a conduction block at the border between the
Ž .
two compartments panel A and the formation of a spiral wave rotating in a counterclockwise direction. On
subse-Ž .
quent cycles panel B the spiral wave moved along the
Ž
border of heterogeneity perpendicular to the gradient of
.
refractoriness and continued to drift until it died at the
Ž .
border of the preparation panel C . The drift velocity amounted to about one-fifth of the propagation velocity, and its direction was determined by the direction of wave rotation and the gradient of refractoriness. When a spiral wave with a clockwise rotation was initiated, it drifted in the opposite direction.
Due to the drift of a spiral wave, the frequency of excitation at a given measurement site depends on the location of this site relative to the moving spiral. This effect is known in the theory of electromagnetic and acoustic waves as the Doppler effect. Fig. 11D shows excitation intervals measured during spiral wave drift at different tissue locations. The measuring sites were dis-tributed along the boundary of heterogeneity which deter-mined the direction of the drift. Because of the drift, the sites located in front of the drifting spiral wave were excited significantly faster than the sites located behind it. The difference in excitation intervals measured ahead of and behind the spiral wave amounted to 30%. Drift of spiral waves and the Doppler effect were also observed in isolated preparations of sheep ventricular muscle imaged
w x
with an optical mapping technique 66,71 . In this case, no artificial heterogeneity was created and the spiral wave drift was likely to be a result of intrinsic spatial gradients of electrophysiological properties. The Doppler effect and the coexistence of different excitation frequencies within
Ž .
Fig. 11. Drift of a spiral wave and the Doppler effect. A and B
Ž .
Isochronal activation maps showing initiation A and the first rotation
Ž .
cycle B of a spiral wave in an isolated preparation of epicardial muscle. A stepwise inhomogeneity in refractory period was created by separate superfusion of two parts of the preparation with normal and quinidine-containing solutions. Dashed line shows the border of inhomogeneity with smaller refractoriness in the upper part. The asterisk shows the
Ž .
location of the stimulation electrode. C Trajectory of the spiral wave tip
Ž .
during initiation S1 and 3 subsequent cycles of spiral wave rotation
ŽV –V . D Excitation intervals measured along the border of inhomo-1 3. Ž .
Ž .
geneity during spiral wave drift cycle V . Because of the drift, excita-2
tion intervals in front of the spiral wave are significantly shorter than
Ž .
intervals behind the spiral wave Doppler effect . Reproduced with
w x
permission 74 .
the same preparation have been used to explain a possible mechanism of the ECG pattern observed during
arrhyth-Ž w x.
mias torsades de pointes 66,75 .
Theoretical analysis of the drift mechanism in mathe-matical models has demonstrated that, similarly to spiral wave meandering, the drift is strongly dependent on the relationship between the wavelength of excitation and the critical radius of curvature. Depending on the lrr ratio,p two different mechanisms of spiral wave drift can be distinguished. In one extreme situation when l is much larger than r , spiral wave rotation is mainly determinedp by the tissue refractory period. In this case, the drift of spiral waves is governed by spatial gradients in
refractori-w x
ness 54,76 . Accordingly, in a medium with a stepwise heterogeneity, spiral waves drift along the borders separat-ing regions with different refractoriness as shown in Fig. 11. With an increase in r andror a decrease in l the driftp
is influenced by a new component: in addition to drifting along the boundary, the spiral wave shifts into the region with the larger rotation periods. In the extreme case of 2 p r 4 l, the spiral wave rotation is no longer affectedp
gradi-ents in r alone. In the case of a stepwise gradient in r ,p p
the drift is directed predominantly along the border
sepa-w x
rating regions with different rp 77,78 , similar to the case of purely refractoriness-dependent drift.
4.4. Stationary spiral waÕes, anchoring effect
In many of the experimentally-induced tachycardias, the initial transition from a normal propagation pattern during a basic beat to a rotating pattern is caused by a premature wave propagating through tissue with heterogeneous re-fractoriness. According to the mechanism of spiral wave instability described above, such waves should be unstable due to refractoriness-dependent drift. However, mapping experiments have shown that such waves are often stable,
w x
rotating rigidly around a fixed core 41,73 . This discrep-ancy can be explained by the stabilizing effects of small
localized discontinuities in tissue structure corresponding
w x
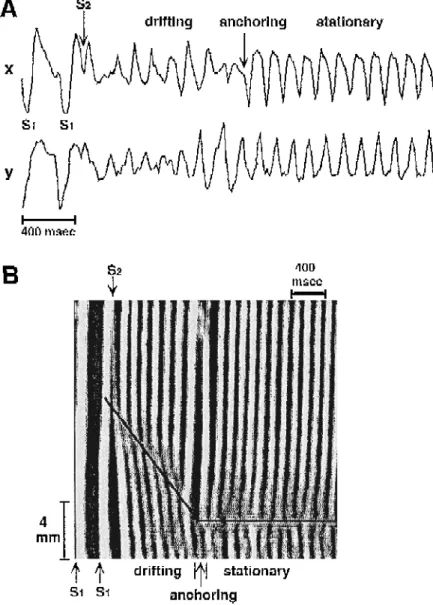
to unexcitable obstacles 71 . Fig. 12 shows an example of
w x
the anchoring of an initially drifting spiral wave 79 . Electrical activity in this case is represented in the form of
Ž .
a time–space plot panel B where signals from all measur-ing points were compressed into a smeasur-ingle line which is
Ž w x .
displayed as a function of time see Ref. 71 for details . In such diagrams, a propagating wave is represented by a narrow band and the location of the spiral wave core is equivalent to the point of band branching. Initially the spiral wave drifted in a downward direction as shown by the straight line. After 8 cycles of rotation, the spiral wave was anchored and became stationary. In most cases of stable rotation a band of connective tissue or a small branch of the coronary artery was identified as the site of anchoring.
Ž . Ž .
Fig. 12. Anchoring of a drifting spiral wave. A Electrocardiographic recordings showing that premature stimulation S2 produced polymorphic
Ž .
arrhythmic activity followed by a transition to sustained monomorphic tachycardia. B Time–space plot of activation spread obtained from video-imaging
Ž .
of the fluorescence of a voltage-sensitive dye. In these plots activity from the whole image is projected onto a single direction vertical axis and displayed as a function of time. White bands show planar wave propagation while the branching of bands indicates the presence of a spiral wave induced by S2
w x
The anchoring of spiral waves by unexcitable obstacles depends on the relation between the critical radius of
Ž .
curvature rc and the size and shape of the obstacle. The smaller the r , the stronger the interaction between thec
spiral wave tip and the obstacle. As a result, anchoring of spiral waves is more likely to occur in conditions of relatively high excitability. In a medium with large r ,c
Ž
excitation waves tend to detach from sharp obstacles Fig.
.
7 , and therefore obstacles are less likely to anchor spiral waves.
4.5. Spiral waÕes in 3 dimensions
Representation of myocardium as a 2-dimensional ex-citable medium is valid in a case of relatively thin
myocar-w x
dial tissue such as atrial muscle 64 or a thin layer of
w x
epicardium surviving after myocardial infarction 41 or
w x
the cryo-ablation procedure 80 . However, in other cases such as a left ventricular wall, the 3-dimensional structure of cardiac muscle must be taken into account. Analogues of spiral waves in 3 dimensions are called ‘scroll waves’. A spiral wave core in a 2-dimensional medium corre-sponds to a filament in a 3-dimensional medium around which rotation of a scroll wave occurs. The simplest case of a scroll wave is an extension of a 2-dimensional spiral wave into the third dimension. Provided that cardiac tissue is homogeneous and the scroll filament is a straight line, the behavior of such a wave is equivalent to the behavior of a 2-dimensional spiral wave. The behavior of a scroll wave may become different when muscle properties vary with depth or when the scroll wave filament is bent or twisted. The specific 3-dimensional effects related to scroll wave rotation were quite extensively investigated in com-puter models. A brief review of these data has been
w x
published recently 81 . One of the interesting effects specific to the 3-dimensional media is the unstable rotation of scroll waves with filaments which are bent or closed
w x
into rings 82 . The mechanism for such instability relates to the 3-dimensional wavefront curvature, which may oc-cur even if the rotation of a corresponding 2-dimensional spiral wave is stable and which may result in termination of the scroll wave. Another intriguing theoretical possibil-ity is a persistent but disordered rotation of a scroll wave in homogenous 3-dimensional media resulting in a fibrilla-tion-like electrical activity when projected to a surface of
w x
the medium 83 . The experimental verification of these effects in cardiac muscle is still lacking due to the inability to map 3-dimensional activation spread with sufficiently high spatial resolution.
4.6. Concluding remarks
In summary, the experimental and theoretical data available at present clearly demonstrate the importance of the wavefront geometry in cardiac impulse propagation and in the behavior of spiral waves. Critical wavefront curvature contributes to a number of physiologically
rele-Ž .
vant effects: 1 conduction block at structures with abrupt
Ž .
tissue isthmuses or expansions; 2 dependence of
stimula-Ž .
tion strength on electrode size; 3 formation of an
ex-Ž .
citable gap during spiral wave rotation; 4 meandering, drift and anchoring of spiral waves. The application of theory based on continuous model to cardiac muscle in a quantitative way may have limitations, especially taking into account the fact that the estimated value of the critical radius is comparable to the dimensions of an individual cardiac cell. However, the fact that the value of critical curvature predicted from the theory and from the computer simulations in continuous models is close to the experi-mental estimates suggests that the continuous model is a good approximation, at least for healthy tissue. That may be different in aging tissue and in pathological conditions such as infarction and hypertrophy where larger disconti-nuities in axial resistivity may be present. Another limita-tion of the present approach is that it does not take into account the extracellular space. It is well established that impulse initiation and propagation in a tissue with a re-stricted extracellular space are strongly affected by differ-ences in the anisotropic resistivity ratio between intra- and extracellular spaces as described by bi-domain models
w84,85 . The extent to which these factors affect criticalx
curvature remains unknown.
Acknowledgements
We wish to thank Dr. Hans Peter Clamann and Dr. John Shiner for reading this manuscript, Mrs. Lilly Lehmann for help in preparation of figures. This work was supported by the Swiss National Science Foundation and the Swiss Heart Foundation.
References
w x1 Jack JJB, Noble D, Tsien RW. Electric Current Flow in Excitable
Cells. Oxford: Clarendon Press, 1975.
w x2 Spach MS, Kootsey JM. The nature of electrical propagation in
cardiac muscle. Am J Physiol 1983;244:H3–H22.
w x3 Janse MJ. Reentrant arrhythmias. In: HA Fozzard, eds. The Heart
and Cardiovascular System. New York: Raven Press, 1992;2055– 2094.
w x4 Rudy Y. Models of continuous and discontinuous propagation in
cardiac tissue. In: Zipes DB, Jalife J, eds. Cardiac Electrophysiol-ogy. From Cell to Bedside. Philadelphia: Saunders, 1995;326–334.
w x5 Winfree AT. When Time Breaks Down. Princeton: Princeton
Uni-versity Press, 1987.
w x6 Zykov VS. Simulation of Wave Processes in Excitable Media.
Manchester: Manchester University Press, 1987.
w x7 Keener JP. A geometrical theory for spiral waves in excitable media.
SIAM J Appl Math 1986;46:1039–1056.
w x8 Zykov VS, Morozova OL. Speed of spread of excitation in
two-di-mensional excitable medium. Biophysics 1979;24:739–744.
w x9 Zykov VS. Analytical evaluation of the dependence of the speed of
an excitation wave in a two-dimensional excitable medium on the curvature of its front. Biophysics 1980;25:906–911.
w10 Tyson JJ, Keener JP. Singular perturbation theory of traveling wavesx
w11 Gerhardt M, Schuster H, Tyson JJ. A cellular automaton model ofx
excitable media including curvature and dispersion. Science 1990;247:1563–1566.
w12 Sneyd J, Atri A. Curvature dependence of a model for calcium wavex
propagation. Physica D 1993;65:365–372.
w13 Foerster P, Muller SC, Hess B. Curvature and propagation velocityx
of chemical waves. Science 1988;241:685–687.
w14 Foerster P, Muller SC, Hess B. Critical size and curvature of wavex
formation in an excitable medium. Proc Natl Acad Sci USA 1989;86:6831–6834.
w15 Lechleiter J, Girard S, Peralta E, Clapham D. Spiral calcium wavex
propagation and annihilation in Xenopus laevis oocytes. Science 1991;252:123–126.
w16 Clerc L. Directional differences of impulse spread in trabecularx
Ž .
muscle from mammalian heart. J Physiol Lond 1976;255:335–346.
w17 Spach MS, Heidlage JF. The stochastic nature of cardiac propaga-x
tion at a microscopic level—electrical description of myocardial architecture and its application to conduction. Circ Res 1995;76:366–380.
w18 Kleber AG, Riegger CB, Janse MJ. Electrical uncoupling and in-x ´
crease of extracellular resistance after induction of ischemia in isolated, arterially perfused rabbit papillary muscle. Circ Res 1987;61:271–279.
w19 Smeets JLRM, Allessie MA, Lamers WJEP, Bonke FIM, Hollen J.x
The wavelength of the cardiac impulse and reentrant arrhythmias in isolated rabbit atrium. The role of heart rate, autonomic transmitters, temperature, and potassium. Circ Res 1986;58:96–108.
w20 Knisley SB, Hill BC. Effects of bipolar point and line stimulation inx
anisotropic rabbit epicardium. assessment of the critical radius of curvature for longitudinal block. IEEE Trans Biomed Eng 1995;42:957–966.
w21 Noble D. The relation of Rushton ‘liminal length’ for excitation tox
the resting and active conductances of excitable cells. J Physiol 1972;226:573–591.
w22 Fozzard HA, Schoenberg M. Strength–duration curves in cardiacx
Purkinje fibres. effects of liminal length and charge distribution. J Physiol 1972;226:593–618.
w23 Lindemans FW, van der Gon JJD. Current thresholds and liminalx
size in excitations of heart muscle. Cardiovasc Res 1978;12:477–485.
w24 Ramza BM, Joyner RW, Tan RC, Osaka T. Cellular mechanism ofx
the functional refractory period in ventricular muscle. Circ Res 1990;66:147–162.
w25 Beeler GW, Reuter H. Reconstruction of the action potential ofx
ventricular myocardial fibres. J Physiol 1977;268:177–210.
w26 Lindemans FW, Zimmerman ANE. Acute voltage, charge, andx
energy thresholds as functions of electrode size for electrical stimu-lation of the canine heart. Cardiovasc Res 1979;13:383–391.
w27 Winfree AT. The electrical thresholds of ventricular myocardium. Jx
Cardiovasc Electrophysiol 1990;1:393–410.
w28 Mendez C, Mueller WJ, Merideth J, Moe GK. Interaction of trans-x
membrane potentials in canine Purkinje fibers and at Purkinje fiber–muscle junctions. Circ Res 1969;34:361–372.
w29 De la Fuente D, Sasyniuk B, Moe GK. Conduction through a narrowx
isthmus in isolated canine atrial tissue. A model of the W-P-W syndrome. Circulation 1971;44:803–809.
w30 Inoue H, Zipes DP. Conduction over an isthmus of atrial my-x
ocardium in vivo. a possible model of Wolf-Parkinson-White syn-drome. Circulation 1987;76:637–647.
w31 Smith JH, Green CR, Peters NS, Rothery S, Severs NJ. Alteredx
patterns of gap junction distribution in ischemic heart disease—an immunohistochemical study of human myocardium using laser scan-ning confocal microscopy. Am J Pathol 1991;139:801–821.
w32 De Bakker JMT, Van Capelle FJL, Janse MJ, et al. Slow conductionx
in the infarcted human heart—zigzag course of activation. Circula-tion 1993;88:915–926.
w33 Khodorov BI, Timin YN, Vilenkin SY, Gul’ko FB. Theoreticalx
analysis of the mechanisms of conduction of a nerve pulse over an
inhomogeneous axon. I. Conduction through a portion with in-creased diameter. Biofizika 1969;14:304–315.
w34 Goldstein SS, Rall W. Changes of action potential shape andx
velocity for changing core conductor geometry. Biophys J 1974;14:731–757.
w35 Joyner RW, Veenstra R, Rawling D, Chorro A. Propagation throughx
electrically coupled cells. Effects of a resistive barrier. Biophys J 1984;45:1017–1025.
w36 Cabo C, Pertsov AM, Baxter WT, Davidenko JM, Gray RA, Jalife J.x
Wave-front curvature as a cause of slow conduction and block in isolated cardiac muscle. Circ Res 1994;75:1014–1028.
w37 Rohr S, Salzberg BM. Characterization of impulse propagation atx
the microscopic level across geometrically defined expansions of excitable tissue. multiple site optical recording of transmembrane
Ž .
voltage MSORTV in patterned growth heart cell cultures. J Gen Physiol 1994;104:287–309.
w38 Fast VG, Kleber AG. Cardiac tissue geometry as a determinant ofx ´
unidirectional conduction block. assessment of microscopic excita-tion spread by optical mapping in patterned cell cultures and in a computer model. Cardiovasc Res 1995;29:697–707.
w39 Fast VG, Kleber AG. Block of impulse propagation at an abruptx ´
tissue expansion. evaluation of the critical strand diameter in 2- and 3-dimensional computer models. Cardiovasc Res 1995;30:449–459.
w40 Rohr S, Scholly DM, Kleber AG. Patterned growth of neonatal ratx ¨ ´
heart cells in culture. Morphological and electrophysiological char-acterization. Circ Res 1991;68:114–130.
w41 Wit AL, Dillon SM. Anisotropic reentry. In: DP Zipes, Jalife J, eds.x
Cardiac Electrophysiology. From Cell to Bedside. Philadelphia: Saunders, 1990;353–364.
w42 Spach MS, Dolber PC. Relating extracellular potentials and theirx
derivatives to anisotropic propagation at a microscopic level in human cardiac muscle. Evidence for electrical uncoupling of side-to-side fiber connections with increasing age. Circ Res 1986;58:356–371.
w43 Luo CH, Rudy Y. A model of the ventricular cardiac action potentialx
—depolarization, repolarization, and their interaction. Circ Res 1991;68:1501–1526.
w44 Cabo C, Pertsov AM, Davidenko JM, Baxter WT, Gray RA, Jalife J.x
Vortex shedding as a result of turbulent electrical activity in cardiac muscle. Biophys J 1996;70:1105–1111.
w45 Girouard SD, Pastore JM, Laurita KR, Gregory KW, Rosenbaumx
DS. Optical mapping in a new guinea pig model of ventricular tachycardia reveals mechanisms for multiple wavelengths in a single reentrant circuit. Circulation 1996;93:603–613.
w46 Pertsov AM, Panfilov AV, Medvedeva FU. Instabilities of au-x
towaves in excitable media associated with critical curvature phe-nomenon. Biofizika 1983;28:100–102.
w47 Agladze K, Keener JP, Muller SC, Panfilov A. Rotating spiral wavesx
created by geometry. Science 1994;264:1746–1748.
w48 Winfreex AT. Spiral waves of chemical activity. Science
1972;175:634–636.
w49 Muller SC, Plesser T, Hess B. The structure of the core of the spiralx ¨
wave in the Belousov-Zhabotinskii reaction. Science 1985;230:661– 663.
w50 Gorelova NA, Bures J. Spiral waves of spreading depression in thex
isolated chicken retina. J Neurobiol 1983;14:353–363.
w51 Shibata J, Bures J. Optimum topographical conditions for reverberat-x
ing cortical spreading depression in rats. J Neurobiol 1974;5:107– 118.
w52 Lipp P, Niggli E. Microscopic spiral waves reveal positive feedbackx
in subcellular calcium signaling. Biophys J 1993;65:2272–2276.
w53 Tomchik KJ, Devreotes PN. Adenosine 3 ,5 -monophosphate wavesx X X
in Dictyostelium discoideum. a demonstration by isotope dilution-fluorography. Science 1981;212:443–446.
w54 Fast VG, Efimov IR. Stability of vortex rotation in an excitablex
cellular medium. Physica D 1991;49:75–81.
rotation of a vortex in an excitable cellular medium. Phys Lett A 1990;151:157–161.
w56 Winfree AT. Scroll-shaped waves of chemical activity in threex
dimensions. Science 1973;181:937–939.
w57 Zykov VS. Cycloid circulation of spiral waves in excitable medium.x
Biophysics 1986;31:940–944.
w58 Lugosi E. Analysis of meandering in Zykov kinetics. Physica Dx
1989;40:331–337.
w59 Gerhardt M, Schuster H, Tyson JJ. A cellular automaton model ofx
excitable media. II. Curvature, dispersion, rotating waves and mean-dering waves. Physica D 1990;46:392–415.
w60 Krinsky VI, Efimov IR, Jalife J. Vortices with linear cores inx
excitable media. Proc Roy Soc London Ser A 1992;437:645–655.
w61 Efimov I, Krinsky V, Jalife J. Dynamics of rotating vortices in thex
Beeler-Reuter model of cardiac tissue. Chaos, Solitons and Fractals 1995;5:513–526.
w62 Starmer CF, Romashko DN, Reddy RS, et al. Proarrhythmic re-x
sponse to potassium channel blockade. numerical studies of poly-morphic tachyarrhythmias. Circulation 1995;92:595–605.
w63 Holden AV, Zhang H. Characteristics of atrial re-entry and meanderx
computed from a model of a rabbit single atrial cell. J Theor Biol 1995;175:545–551.
w64 Allessie MA, Bonke FIM, Schopman FJC. Circus movement inx
rabbit atrial muscle as a mechanism of tachycardia. III. The ‘leading circle’ concept. a new model of circus movement in cardiac tissue without the involvement of an anatomical obstacle. Circ Res 1977;41:9–18.
w65 Gray RA, Jalife J, Panfilov A, et al. Nonstationary vortexlikex
reentrant activity as a mechanism of polymorphic ventricular tachy-cardia in the isolated rabbit heart. Circulation 1995;91:2454–2469.
w66 Pertsov AM, Davidenko JM, Salomonsz R, Baxter WT, Jalife J.x
Spiral waves of excitation underlie reentrant activity in isolated cardiac muscle. Circ Res 1993;72:631–650.
w67 Selfridge O. Studies of flutter and fibrillation. Arch Inst Cardiolx
Mexico 1948;18:177–187.
w68 Balakhovsky IS. Several modes of excitation movement in idealx
excitable tissue. Biophysics 1965;10:1175–1179.
w69 Gul’ko FB, Petrov AA. Mechanism of the formation of closedx
pathways of conduction in excitable media. Biophysics 1972;17:271–282.
w70 Allessie MA, Bonke FIM, Schopman FJC. Circus movement inx
rabbit atrial muscle as a mechanism of tachycardia. Circ Res 1973;33:54–62.
w71 Davidenko JM, Pertsov AV, Salomonsz R, Baxter W, Jalife J.x
Stationary and drifting spiral waves of excitation in isolated cardiac muscle. Nature 1992;355:349–351.
w72 Frazier DW, Wolf PD, Wharton JM, Tang ASL, Smith WM, Idekerx
RE. Stimulus-induced critical point. Mechanism for electrical initia-tion of reentry in normal canine myocardium. J Clin Invest 1989;83:1039–1052.
w73 El-Sherif N. Reentrant mechanisms in ventricular arrhythmias. In:x
DB Zipe, Jalife J, eds. Cardiac Electrophysiology. From Cell to Bedside. Philadelphia: W.B. Sounders, 1995;567–582.
w74 Fast VG, Pertsov AM. Drift of a vortex in the myocardium. Bio-x
physics 1990;35:489–494.
w75 Abildskov JA, Lux RL. The mechanism of simulated torsade dex
pointes in a computer model of propagated excitation. J Cardiovasc Electrophysiol 1991;2:224–237.
w76 Panfilov AV, Vasiev BN. Vortex initiation in a heterogeneousx
excitable medium. Physica D 1991;49:107–113.
w77 Rudenko AN, Panfilov AV. Drift and interaction of vortices inx
two-dimensional heterogeneous active medium. Stud Biophys 1983;98:183–188.
w78 Pertsov AM, Ermakova EA. Mechanism of the drift of spiral wavex
in an inhomogeneous medium. Biofizika 1988;33:338–342.
w79 Davidenko JM. Spiral wave activity: a possible common mechanismx
for polymorphic and monomorphic ventricular tachycardias. J Car-diovasc Electrophysiol 1993;4:730–746.
w80 Schalij MJ, Lammers WJEP, Rensma PL, Allessie MA. Anisotropicx
conduction and reentry in perfused epicardium of rabbit left ventri-cle. Am J Physiol 1992;263:H1466–H1478.
w81 Pertsov AM, Jalife J. Three-dimensional vortex-like reentry. In: DBx
Zipe, Jalife J, eds. Cardiac Electrophysiology. From Cell to Bedside. Philadelphia: W.B. Sounders, 1995;403–409.
w82 Panfilov AV, Pertsov AM. Vortex rings in a three-dimensionalx
medium described by reaction–diffusion equations. Dokl AN SSSR 1984;274:58–60.
w83 Winfree AT. Electrical turbulence in three-dimensional heart mus-x
cle. Science 1994;266:1003–1006.
w84 Henriquez CS. Simulating the electrical behavior of cardiac tissuex
using the bidomain model. Crit Rev Biomed Eng 1993;21:1–77.
w85 Wikswo JP. Tissue anisotropy, the cardiac bidomain. and the virtualx
electrode effect. In: Cardiac Electrophysiology. From Cell to Bed-side. Zipe DP, Jalife J, eds. Philadelphia: Saunders, 1995;348–361.
w86 Noble D. A modification of the Hodgkin-Haxley equations applica-x
ble to Purkinje fibre action potential and pace-maker potentials. J
Ž .