DE7ERMINATION OF THERMAL NEUTRON CAPTURE GAMMA YIELDS by
Thomas L. Harper Jr.
B.S. University of California, Berkeley
(1965)
S.M. Massachusetts Institute of (1966)
Te chnology
Submitted in Partial Fulfillment of the Requirements for the
Degree of Doctor of Philosophy
at the
Massachusetts Institute of Technology September 1969
Signature of Author
Certified By
Accepted By
Department of Nuclear Engineering July 15, 1969
7hesis Supervisor
Chairman, Departmental Committee on Graduate Students
Archives
gpass. INST' ECcH.OCT 7 1969
MIT Libraries
Document Services Room 14-0551 77 Massachusetts Avenue Cambridge, MA 02139 Ph: 617.253.2800 Email: [email protected] http://libraries.mit.edu/docsDISCLAIMER OF QUALITY
Due to the condition of the original material, there are unavoidable flaws in this reproduction. We have made every effort possible to
provide you with the best copy available. If you are dissatisfied with this product and find it unusable, please contact Document Services as soon as possible.
Thank you.
Some pages in the original document contain pictures, graphics, or text that is illegible.
2
DETERMINATION OF THERM41AL NEU'IRON CAPTURE GAM1A YIELDS by
Thomas L. Harper Jr.
Submitted to the Department of Nuclear Engineering on
July 15, 1969, in partial fulfillmont of the requirements for the degree of Doctor of Philosophy.
ABS RACT
A method of analysing Ge(Li) thermal neutron capture gamma spectra to obtain total gamaa yields has been
devel-oped. Tie method determines both the yields from the well
resolved gamma peaks in a spectrum as well as the gamma yields from the unresolved gamma lines which appear in the
continuum portion of a spectrum. A'counting for the -un-resolved continuum enables a large fraction of total emitted energy to be observed, and values of 1004% i 15%
are obtained for the cases studied. The techniques used
involve the determination of a peak response function suitable for the Ge(Li) pair spectrometer spectra being studied. The response function is used to strip off the
effects of the peaks upon the background and unresolved data continuuma. The continuum, which is due only to the unresolved lines, is broken into energy bins of 210 keV width and the gamma yield per bin is calculated. Results
of the analysis and normalized yields are r;iven for the rare earth samples of: Nd, Sm, Eu, Gd, and Er. The capture
data were obtained by using the MITR 4.THl irradiation facility operated with a Ge(Li) pair spectrometer.
Thesis Supervisor: Norman C. Rasmussen
Title: Professor of Nuclear Engineering
3
ACKNOWLEDdEMEN TS
It is a pleasure to acknowledge the many friends and associates who have assisted with this thosis. The interest, encouragement and guidance of Professor
Norman C. Rasmussen is especially appreciated. His enthusiasm and help have contributed to the success of this research. Thanks are also offered to Professor Franklyn M. Clikeman for acting as thesis reader as well
as for his advice and constructive criticism of the work.
The assistance and cooperation of the Reactor
Operations staff, the Radiation Protection Office staff, the Reactor Machine Shop and Electronics Shop personnel, and the MIT Computation Facility and Programmer Assistance staff, are most gratefully acknowledged.
Special advice and guidance were obtained from Mr. Albert Supple, Mr. John Wasik, and Mr. Yosiyuti Hukai on the construction of the experimental
fa'c-ility. Advice and help with the data analysis portions of this work were given by Dr. Tamon Inouye, Dr. Victor J. Orphan, and Mr. John N. Hamawi. Their .contributions to this work are appreciated. Miss. Clare Egan is thanked for typing the thesis.
The author is grateful for receiving financial support from the Atomic Energy Commission through their
fellowship program in Nuclear Science and Engineering, from the National Science Foundation through their
traineeship program, and from Gulf General Atomics Incorporated through their sub-contract with MIT.
Finally, special thanks are due my parents, for their constant help, and to my wife, Linda, for her support and encouragement throughout this work.
TABLE OF CON TENTS Abstract Acknowle dgements Table of Contants List of Figures List of Tables 1. Introduction 1.1 Preface
1.2.Review of Instruments Used to Study Capture Gamma Rays
1.3 Unresolved Gamma Continuum 1.4 Format of the Thesis
-2. Experimental Apparatus
2.1 4TH1 External Irradiation Facility 2.2 Operating Characterist-ics of the 4TH1
Facility
2.2.1 Sample Geometry
2.2.2 Flux Optimization and De te rain-ation
2.3 Ge (Li) Gamma Spectrometer
2.3.1
Free Mode Operation2.3.2 Compton Suppression Operation
2.3.3 Pair Spectrometer Operation
2.4 Operating Characteristics of Gamma
Spect-rometer
2.4.1 Ge(Li) Detector and System Energy
2.4.2 2.4.3 2.4.4
2.4.5
2.4.62.4.7
2.4.8 2.4.9 Resolution-Counting Rate Data Geometry Effects
Absorption Correction Factors
Pair Spectrometer Intrinsic Efficiency Compton Suppression Intrinsic
Efficiency
Non Linearity Correction Energy Calibration Standards Comparison of Modes of Operation
3.
Data Analysis3.1
Introduction3.1.1
Fourier Smootning of Data 3.2 Energy Calculation3.3
Area Calculation3.3.1
Background Determination3.3.2
Summation Method PAGE 23
5
8 11 16 16 2123
25
25
32
32
35
39
40
42
45
49
49
51
53
55
56
6264
65
68
70 7073
73
75
75
80b
"I
Table of Contents (Continued)
3.3.3
Gaussian Method33..4 Analysis of Partially Resolved
Peaks
3.4
Intensity Calculation3.4.1 Energy Independent Terms
3.4.2
Energy Dependent Terms3.5
Fraction of Emitted Energy Observed3.6
Continuum Analysis3.6.1
Continuum from Back',round Gamma Rays3.6.2
Resolved Peak Response Function3.6.3
Unresolved Peak Response Function3.6.4
GAMABC Code for UnresolvedRegion-Page
81
83
85
87
89
91
94
95
96
107 109Background, Beryllium,-and Iron Results
--
114
4.1 Presentation of Results - 1l4.2 Background Results 116
4.2.1 Background Compton Suppression 116
Results
4.2.2 Background Pair Spectrometer 123 Results
4.3 Beryllium Sample 127
4.3.1 Beryllium Compton Suppression 127 Results
4.3.2 Beryllium ?air Spectrometer 134 Results
4.3.3 Beryllium Comparison of Results 142
4.4
Iron Sample 1454.4.1 Iron Compton Suppression Results 145 4.4.2 Iron Pair Spectrometer Results 155
4.4.3 Iron Comparison of Results 166
5.
Neodymium Results 1705.1 Neodymium Sample 170
5.2 Neodymium Compton Suppression Results 170
5.3
Neodymium Pair Spectrometer Results 1795.4
Neodymium Comparison of Results . 1936. Samarium Results
6.1 Samarium Sample
6.2 Samarium Compton Suppression Results
6.3
Samarium Pair Spectrometer Results6.4 Samarium Comparison of Results
7.
Europium Results7.1 Europium Sample
7.2 Europium Compton Suppression Results 7.3 Europium Pair Spectrometer Results
7.4
Europium Comparison of Results~ 196
196
196
204
204
214
214
214
220 220 't
Table of Contents (Continued) Page
8. Gadolinium Results 229
8.1 Gadolinium Sample 229
8.2 Gadolinium Compton Suppression Results 229
8.3 Gadolinium Pair Spectrometer Results 236
8.4
Gadolinium Comparison of Results 2479. Erbium Results 250
9.1 Erbium Sample 250
9.2 Erbium Compton Suppression Results 252 9.3 Erbium Pair Spectrometer Results 259
9.4 Erbium Comparison of Results 269 10. Summary, Conclusions, and Recommendations 272
for Future Work
10.1 Summary 272
10.2 Conclusions .274
10.3 Recommendations for Future Work . .275 Appendix A Appendix B Appendix C Appendix D Appendix E Appendix F Appendix G Appendix H References
Error Estimate in Sumnation Area Calculation
-Error Estimate in Gaussian Method Area Calculation
Discussion of Area Calculation Me thods
Error Estimate in Intensity Calculation
Error Estimate in Observed Fraction of Binding Energy Calculation
278
282
285
288
291
Sensitivity of the GAABC Analysis 0f293 the Continuum Region
Formats Used in Tabular Presentation
of Results
Fortran IV Listing of GAMABC Code
Biographical Note 300
309
383
386
aLIST OF FIGURES
FIGURE TITLE PAGE
2.1 Top View of MITR Core and 4TH1 Ir- 26 radiation Facility
2.2 Top View of 4TH1 Irradiation Facility 28 2.3 Front View of 4TH1 Irradiation Fac- 29
ility Used as a Ge (Li) Gamma Spec-trometer
2.4 Photograph of 4T51 Irradiation Facility 31
with Shielding Blocks in Place
2.5 Photograph of 4THl Irradiation Facility
33
with Electronic Equipment in Place2,6 Photograph of Al Sample Holder, Access-
314
Port Plugs, and Various Samples-Ir-radiated in 4TH1 Facility
2.7 Block Diagram of Electronics for 41 Operation in the Free or Direct Mode
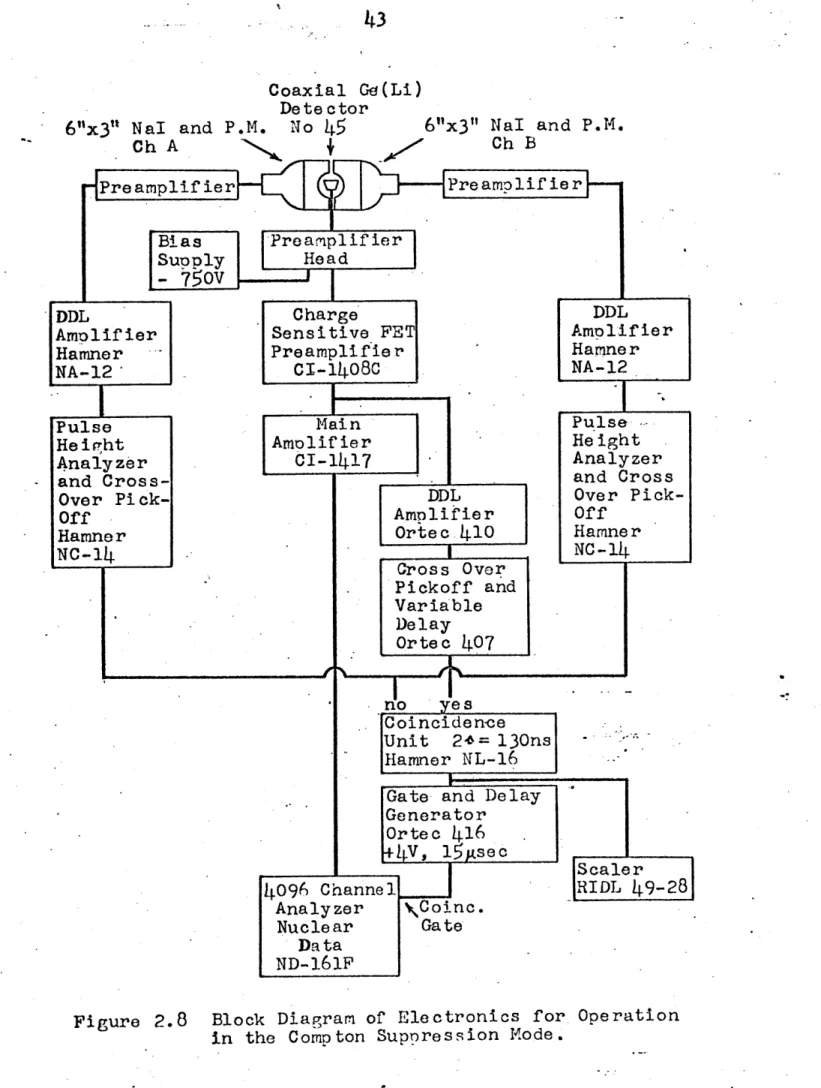
2.8 Block Diagram of Electronics for
43
Operation in the Compton SuppressionMode
2.9 Schematic Showing the Orientation of
46
the Ge(Li) Detector between the TwoNaI Crystals
2.10 Block Diagram o' Electronics for
48
Operation as a Pair Spectrometer2.11 Double Escape Peak Intrinsic Efficienc
58
for Ge(Li) Pair Spectrometer.2.12 Full Energy Peak Intrinsic Efficiericy 63
for Ge(Li) Compton Suppression Op-eration
2.13 Linearity Correction Curve 66
3.1
Background Determination for a76
Resolved Peak3.2
Background Determination for a 84 Gamma DoubletI
List of Figures (Continued)
FIGURE TITLE PAGE
3.3
Shape of Peak Response Function for 98 Ge(Li) Pair Spectrometer3. Go(Li) Pair Spectrometer Response to 101 Be 6810 keV Peak
3.5
Ge(Li) Pair Spectrometer Response to 102 Fe 5920 and 6018 keV Lines3.6
Ge(Li) Pair Spectrometer.Response to 103Fe 7631-7645 keV Doublet
3.7
- Response Function for Unresolved 108 Gamma Continuum3.8
Flow Diagram Showing Major Sections ~ 110 of GAMABC Computer Program4.1 Background Compton Suppression 119
Spectrum 11263
4.2 Background Pair Spectrometer 124 Spectrum 11271
4.3
Beryllium Compton Suppression 130Spectrum 11201
4.4
Beryllium Pair Spectrometer 135Spectrum 11141
4.5
Iron Compton Suppression 147Spectrum 12171
4.6 Iron Pair.Speotrometer 157
Spectrum 11071
5.1
Neodymium Compton Suppression 173Spectrum 11212
5.2
Neodymium Pair Spectrometer 180Spectrum 11211
6.1 Samarium Compton Suppression 198
Spectrum 12161
6.2 Samarium Pair Spectrome ter 206
to List of -
FIGURE
7.1
7.2
8.1
8.29.1
.9.2
Figures (Continued) TITLEEuropium Compton Suppression Spectrum 11213
Europium Pair Spectrometer Spectrum 11221
Gadolinium Compton Suppression Spectrum 11192
Gadolinium Pair Spectrometer Spectrum 11191
Erbium Compton Suppression Spectum 11262
Erbium Pair Spectrometer
Spectrum 11261
V
PAGE216
.222 231237
253
260
a11
LIST OF TABLES
TABLE TITLE PAGE
1.1 Summary of Performance of Principal 19
Instruments Used to Study Capture Gamma Rays
2.1 Effect of Graphite Scattering Plug
37
Position Upon the Thermal NeutronFlux in the 4TH1 Irradiation Facility
2.2 Counting Rate Data for Various Gamma 52
Spectrometer Sample Runs
2.3 Geometry Factors
54
2.4 Effect of Window Width Upon Pair 61
- Spectrometer Efficiency for ThC" -2.615 MeV Double Escape Peak
2.5 Energy Calibration Standards 67
3.1
Peak Response Function Parameters for 100Ge(Li) Pair Spectrometer Data at Various Gamma Peak Energies
3.2
Percent of Total Counts that are in 105the Well Resolved Peaks for Iron and Beryllium
4.1 Background Sample Data and Run 118 Informa tion
4.2 Background Coimpton Suppression Run - 120 11263 GAMANIL Parameters
4.3
Background Compton Suppression Run 12111263 GAMIANL Results
4.4
Background Compton Suppression Run 122 11263 GAMANL Results (EGER=
3.0)
4.5
Background Pair Spectrometer Run 125 11271 GAMANL Parame ters4.6
Background Pair Spectrometer Run 126 11271 GAMANL Results12
List of Tables (Continued)
TALE. TI TLE PAGE
4.7
Beryllium Sample Data and Run 129 Information4.8
Beryllium Compton Suppression Run 131 11201 GAMANL Parameters4.9
Beryllium Compton Suppression Run 132 11201 GAMANL Results4.10 Beryllium Pair Spectromster Run 136 11141 GAMANL and GAMABC Parameters
4.11 Ber 11ium Pair Spectrormeter Run 137
1111 GAMANL Results
4.12 Beryllium Pair Spectrome ter Run 139 11141 GAMAEC Results
4.13 Comparison of Eeryllium Results
143
4.14 Iron Sample Data and Run Information 146 4.15 Iron Compton Suppression Run 14812171 GAMANL Parameters
4.16 Iron Compton Suppression Run 149
12171 GAMANL Results
4.17 Iron Pair Spectrometer Run 158
11071 GAMANL and GAMABC Parameters
4.18 Iron Pair Spectrometer Ruin 159
11071 GAIANL Results
4.19 Iron Pair Spectrometer Run - 163
11071 GAMABC Results
4.20 Comparison of Iron Results 167
4.21 Comparison of Compton Suppression and 169
Pair Spectrometer Results for Iron and
Beryllium Data
5.1
Neodymium Sample Data and Run Information 1725.2
Neodymium Compton Suppression Run 17413
List of Tables (Continued)
TABILE TITLE PAGE
5.3
Neodymium Compton Suppression Run 175 11212 GAIANL Results5.4
Neodymium Pair Spectrometer Run 18111211 GAMANL and GAMABC Parameoters
5.5
Neodymium Pair Spectrometer Run 182 11211 GAMANL Results5.6
Neodymium Pair Spe ctrom ter Run 189 11211 GAMABC Results5.7
Neodymium Comparison of.Results 1946.1
Samarium Sample Data and Run 197Inf orma tion
6.2 Samarium Compton Suppression Run 199
12161 GATM Parameters
6.3 Samarium Compton Suppression Run 200 12161 GAMANL Results
6.4 Samarium Pair Spectrometer Run 207 11151 GAMANL and GAMABC Parameters
6.5
Samarium Pair Spectrometer Run 20811151 GAMANL Results
6.6 Samarium Pair Spectrometer Run 210
11151 GAMABC Results
6.7 Samarium Comparison of Results 212
7.1 Europium Sample Data and Run . 215
Infor ma tion.
7.2 Europium Compton Suppression Run - 217 11213 GAMANL Parameters
7.3 Europium Compton Suppression Run 218 11213 GAMANL Results
7.4
Europium Pair Spectrome ter Run 223 11221 GAMANL and GAMAEC Parameters7.5
Europium Pair Spectrometer Run 22414
List of Tables
(Continued)-TA ELE TITLE PAGE
7.6
Europium Pair Spectrom ter Run 22611221 GAMABC Results
7.7
Europium Comparison of Results 2288.1
Gadolinium Sample Data and Run 230 Informa tion8.2
Gadolinium Compton Suppression Run 232 11192 GAMA NL Parameters8.3 Gadolinium Compton Suppression Run - 233 11192 GAMANL Results
8.4
Gadolinium Pair Spectromete-r Run 238 11191 GAMANL and GAMABC Parameters8.5 Gadolinium Pair Spectrometer Run 239 11191 GAMANL Results
8.6
Gadolinium Pair Spectrometer Run244
11191 GAMABC Results8.7 Gadolinium Comparison of Results
248
9.1 Erbium Sample Data and Run Information 2519.2 Erbium Compton Suppression Run 254
11262 GAMANL Parameters
-9.3 Erbium Compton Suppression Run . 255
11262 GAMANL Results
9.4 Erbium Pair Spectrometer Run 261
11261 GAMANL and GAMABC Parameters.
9.5 Erbium Pair Spectrometer Run 262 11261 GAMANL Results
9.6 Erbium Pair Spectrometer Run 266 11261 GAMABC Results
9.7 Erbium Comparison of Results 270 10.1 Normalized Thermal Neutron Capture 273
List of Tables (Continued)
TABLE TITLE PAGE
D-1 Uncertainties in the Terms used to 289
Evaluate Cap ture Gamma Inte nsitie s
F-1 Summary of Peak Response Parameters 294
and GAMABC Results for Samples Studied
F-2 Sensitivity of Peak Response Function 297 for Neodymium Data
F-3 Bin Intensities for Nd using Three 298 Peak Response Functions
G-1 Description of GAMANL, and GAMANL - 303 and GAMANL and GAMABC Parameters
Table
0-2 Description of GAMANL Results
305
TableG-3 Description of GAMABC Results 307 Table
.H-1 GAMAEC Listing - Main and Continuum 310
Analysis Subroutines
H-2 GAMABC Listing - GAMANL Subroutines 34.1
H-3 GAMABC Input Deck Example 380
16
1. INTNODUCTION
1.1 Preface
Nuclear level studies and neutron shielding calcu-lations need information about the number and energy of gamma rays emitted following thermal neutron capture, Basic know-ledge about nuclear levels and their properties can be obtained from such data. The nuclear engineer also desires this data for shielding calcnlations. The purpose of this study. is to obtain the radiative capture data that is needed for the above calculations. To do this, a spectral analysis meth6d is
developed to study thermal neutro'n captnre gamma spectra ob-tained from a Ge(Li) detector.
The development of Ge(Li) detectors has greatly im-proved the technique for measuring thermal capture gamma
spectra. Ge(Li) detectors have comparable or better resolu--tion than other gamma spectrometers for gamma energies greater than 1.0 MeV, and they usually have higherrefficiency. In addition, Ge(Li) detectors can cover .practically the entite capture gamma energy range from 200 keV to 10 MeV, which makes possible much faster data acquisition rates.
To obtain capture gamma spectral data, Ge(Li) detectors can be operated directly, without any coincidence gating, or they can be operated with coincidence gating in either a
Compton suppression mode or in a pair spectrometer mode. Both of the latter two modes are used to reduce the background
17
continuum. seen in the spectral data over what it would be
if the detector were operated dir,ectly.
Recent data taken with a Ge(LI) pair spectrometer at MIT to study thermal neutron capture reactions have shown that in many cases the gamma spectra so obtained are not completely resolved. In such cases the resolved lines are superimposed upon a continuum. The continuum is due in' part to the unresolved, low intensity, capture gamma lines from the sample, and in part to background from various sources. The magnitude of the continuum depends upon the sample being studied.
In the cases of well resolved spectra, the gamma lines observed account for all of the energy emitted by de-excitation of the product nucleus. However, in many
spectra the resolved lines account for only a small fraction of the emitted energy. In these cases a continuum much
larger than expected from background sources is observed. The spectral analysis method of this study treats both the resolved gammallines and the continuum portions of spectra obtained with the Ge(Li) pair spectrometer in order to obtain a more accurate estimate-of the amount of radiated energy seen per capture in a sample. The spectral data used in this thesis is that obtained from the 4TH1 external sample gamma spectrometer of the MIT Reactor.
This spectrometer is similar in principle to the 9CH2 gamma
I-18
spectrometer designed by Orphan, and used as a Ge(Li) pair spectrometer. (0-1). Iron, beryllium, and rare earth
samples were run in the 4TH1 facility to obtain spectra that would be useful in developing the spectral analysis method. The data from these samples are presented in this study.
Before the 9CH2 gamma spectrometer was shutdown, it was used -by Rasmussen and Hukai to obtain thermal neutron capture spectra on 74 elements. The.se spectra were asnalysed for their well resolved gamma lines using a comput-er dode developed by Inouye, and the results presented in report
MITNE-85. (R-1). The spectral analysis method developed in this work can be applied to the data used in obtaining MITNE-85.
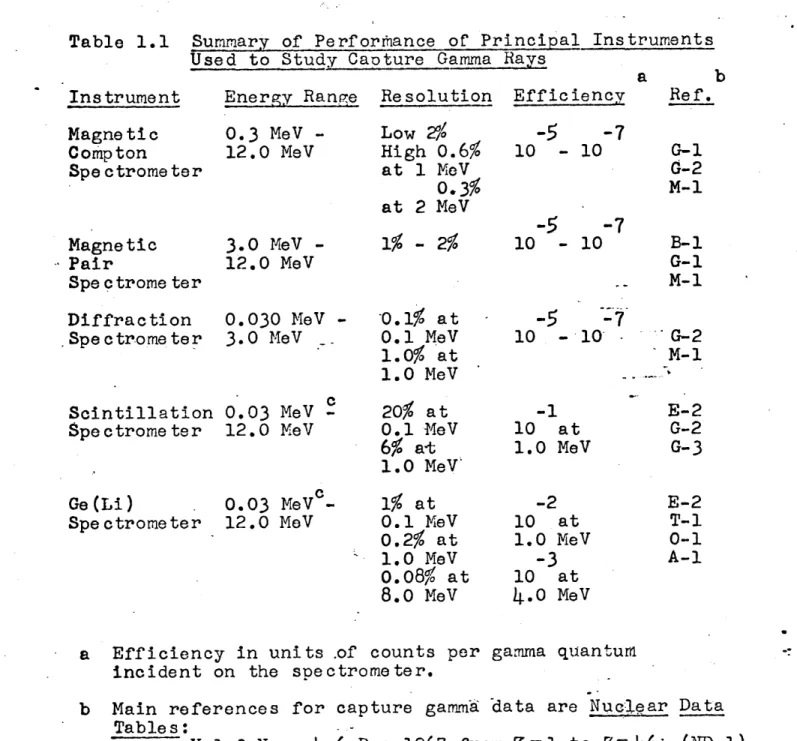
1.2 Review of Instruments Used to Study Capture Gamma Rays. Table 1.1 summarizes the performance characteristics of the principle instruments used in the study of thermal neutron capture gamma rays. Prior to.1958 the most accurate and detailed results were obtained with magnetic pair and magnetic Compton spectrometers. (G-1, G-2, If-1). The diffraction spectrometer has also been used in the gamma
energy range up to 3 MeV. (G-2, M-1), Measurements with these instruments were carried out with natural elements targets usually weighing a few hundred grams. Small quan-tities of separated isotopes have been used with these instruments with the resolution of 2% at 1.0 MeV being ob-tained. Two disadvantages of the above instruments are:
-I
N.
19
Table 1.1 Summary of Perforihance of Principal Instruments
Instrument Magnetic Compton Spectrometer Magnetic Pair Spectrome ter Diffraction Spe c trome ter
Scintillation Spe ctrome ter
Ge(Li)
Spe ctrome ter
Used to Study Caoture Gamma Rays Energy Ranr:e 0.3 MeV -12.0 MeV 3.0 MeV -12.0 MeV 0.030 MeV -3. 0 MeV 0.03 MeV -12. 0 MeV c 0.03 MeV 12.0 MeV Resolution Low 2% High 0.6% at 1 MeV 0.3% at 2 MeV Efficiency -5
-7
10 - 10 a-.5
-7
10 - 10 b Ref. G-1 G-2 M-1 B-1 G-1 .- M-1 -0.1% at 0.1 M1eV 1.0% at 1.0 MeV 20% at 0.1 MeV 6% at 1.0 MeV 1% at 0.1 MeV 0.2% at 1.0 MeV 0.08% at 8.0 MeV-5
-7
10 - 10 --1 10 at 1.0 MeV -2 10 at 1.0 MeV-3
10 at 4.0 MeV G-2 M-1 E-2 G-2 G-3 E-2 T-1 0-1 A-1a Efficiency in units .of counts per gamma quantum incident on the spectrometer.
b Main references for capture gammfa data are Nuclear Data Tables:
Vol 3 Nos.
4-6
Dec 1967 from Z=1 to Z=46-
(ND-i) Vol5
Nos. 1-2 Nov 1968 from Z=47-to Z=67 (ND-2) Vol5
Nos-. 3-4 Feb 1969 from Z=68 to Z=94 (ND-3)c Higher energy operation carried out as a pair spect-rome ter.
20.
(1) their relatively low efficiencies of l5 to
10~ counts per incident gamma quantum, which require that the sample be placed near therreactor core and that large samples be used, and
(2) the effective energy range covered by these spectrometers which is only part of the energy range in which capture gammas are usually found.
Nal(T1) scintillation detectors have found application
in both direct use and in a pair spectrometer to study
capture gamma rays. (E-2, G-2, G-3). Their improved~effic-lency and wider energy range of operation are .advantages over the magnetic spectrometers. However, their poorer resolution restricts their usefulness in studying complex gamma spectra. They have found wider applications in ex-periments using coincidence, angular correlation, and
linear polarization techniques, and for measuring the degree of circular polarization of gamma rays following capture of polarized neutrons. (ND-1, ND-2, M., -B-2).
The development of Ge(Li) detectors has greatly improved the technique for measuring thermal capture gamma spectra. Ge(Li),detectors have comparable or better resolu-tion than other spectrometers as shown in Table 1.1 for gamma
energies greater than 1.0 MeV. The diffraction spectrometer shows the best resolution at gamma energies below 100 keV. The Ge(Li) spectrometer has the advantage of having much greater efficiency than the other high resolution
spectro-21
ieters. Ge(Li) detectors have been used directly to study capture gamma ray spectra (T-1) and have also been used in gamma-gamma coincidence experiments to study capture gamma
spectra. The report' by Arnell (A-1), which describes a facility using internal reactor targets, and the previously cited work by Orphan,which describes the MIT Ge(Li) pair
spectrometer using samples external to the reactor (0-1), demonstrate their use in coincidence .experiments.
As mentioned in' Table 1.1 the most comprehensive, recent references available for capture gamma data results are those of Nuclear Data. (ND-1, ND-2, ND-3). These refer-ences list the energy and intensity values of the gamma
lines seen from thermal neutron capture in natural element samples, and in separated isotope samples where results are available.
1.3 Unresolved Gamma Continuum
In some cases, almost all of the capture gamma rays from a sample have been resolved. These cases are character-ized by the gamma spectra having a fairly even bacIkground level in the energy range 1 to4.5 MeV. For example, the beryllium and iron pair spectrometer spectra are shown in Chapter 4, Figures 4.4 and 4.6.
In contrast, certain of the elements studied show a large unresolved continuum region in the spectrum. The neodymium spectrum of Chapter
5,
Figure 5.2 is an exampleI-22
in which the gamma peaks are 'shovm to be well resolved and distinct above
5
MeV,whereas
at lower energy they merge together and lose identity in the spectrum.A more extreme case is that of the samarium spectrum
of Chapter 6, Figure .2, which shows a large unresolved continuum region. Only a f ew peaks are distinguishable in the spectrum, and a large continuum is observed in the gamma energy range 1.5 to 4.5 PeV. The fractions of
observed gamma rays for these elements, as calculated .in MITNE-85 are; beryllium 99.4%, iron 91.3%, neodymi-um
36.7%,
and samarium 19.,4/%. The missing gamma ray energy for thelatter two cases is in the unresolved continuum.
To estimate the magnitude of that part of the con-. tinuum due to capture gamma rays, it isn-necessary to deter-mine the shape and size of these contributions, These
measurements included using'the 4TH1 Ge(Li) pair spectrometer:
(1) to determine the shielding background for triple
coincidence operation,
(2) to run iron and beryllium samples to determine the efficiency and peak response functions of the system,
(3) to determine the effect of the triple coincidence timing and vindowa width settings upon the efficiency and
the continuum seen in a spectrum, and
(4) to determine the effect of collimator size upon
detector solid angle, the continuum, and the peak response function of the detecting system. In general emphasis was
23
placed upon studying the factors that control the shape of the peak response function and the continuum background.
The results of the above measurements were then: used. to develop the computer code GAMABC. GAMABC analyses the unresolved continuum region of a pair spectrometer spectrum and estimates the amount of unresolved capture gamma ray intensity that is located in this continuum. l.4 Format of the Thesis
The next chapter describes the 4TH1 external i -radiation facility and the gamma spectrometer, ChApter Three describes the empirical measurements and computer code development needed for studying the resolved peaks and unresolved continuum of a spectrum. Chapter Four
presents the results on beryllium and iron and compares them to other published data. The background of the
system is also discussed. Chapters Five, Six, Seven, Eight, and Nine give the results for neodymiun, sanarium, gadolinium, europium, and erbium samples respectively. Each of these chapters shows the spectra, and lists the run parameters, gamma.energies, resolved line intensities and unresolved energy bin intensities of the gamma rays, and fraction of gamma rays seen. The particular samples used were chosen because they present a variety of cases each having a region of unresolved continuum. Chapter Ten gives a summary of results and the conclusions and recommendations for future work. The appendices elaborate
24
upon certain portions of the. analytical techniques used, with Appendices A through E discussing the accuracies of
the various calculated parameters, and Appendices F
through H discussing the sensitivity, output tables, and Fortran IV listing and input data for the GAMABC code
respectively.
2. EXPERIMENTAL APPARATUS 2.1 4TH1 External Irradiation Facility
The spectrometer built by Orphan using the 9CH2
port of the MIT Reactor was replaced by a permanent facility which uses the 4TH1 tangential port. Basic concepts as
developed by Orphan were used in constructing the facility.
(0-1). Modifications were made in designing the shielding to reduce or eliminate some of the background gamma lines present in the 9CH2 facility. The 4TH1 spectrometer is qtite compact owing to' the use of large, one to two tons, heavy density concrete shielding blocks.
Figure 2.1 shows a drawing. of the overall top view of the 4TH1 facility, and its relation to the MITR shielding and core. Included is the companion facility designed for lattice fuel rod irradiation studies by Hukai. (H-3). A graphite scattering plug 3 7/8 inches in diameter and
39
3/4 inches long is placed inside the 4TH1 tangential through port, next to the reactor core. Its purpose is to thermalize and scatter neutrons into-the 4TH1 port. A steel collimator, tipped by a protective cadmium sleeve encased in aluminum cladding, reduces the neutron beai diameter to3
1/2 inches upon exit from the port. A lead plug, encasedin 1/16 inch thick aluminum, is placed 19 inches into the steel collimator in order to reduce the gamma flux emerging from the 4TH1 port while not degrading the neutron flux
excessively. This was done to reduce the gamma flux impinging on the sample and then scattering into the detector.
26 4" PORT STEEL PLUG IOLOGICAL SHIELD CATERING LEDLLGUG 6"
RA LEAD 4LEAD TGRAPHITE
SSHUTTER THERMAL COLUMN GRAPHITE-REFLECTOR THERMAL SHIELD - E RR REGLARR 20" CN SLEEVE STEEL COLLIMATORIIN 3 "d LEAD PLUG 3 76" d x23" .. BORAL LEAD 4THI PORT B OX SEAL
5SHUTTER
--- EXTERNAL SAMPLE FACILITY
34 BORAL
SHUTTER---FUEL ROD SAMPLE FACILITY
W- 40"
RR REGULATING ROD
0 CONTROL RODS
o
FUEL ASSEMBLYFigure 2.1 Top View of MITR Core and 4Ti1 Irradiation Facility.
27
A gas seal of 1/8 inch .thick aluminum is bolted to the port box exit within the port box and serves to prevent any radioactive gases from escaping. The neutron flight path from the tangential point of the 4TH1 port with the MITR core to the external sample is 135 inches.
Figure 2.2 shows a top view of the 4THl facility. An indication of the shielding used is shown by the key
in the figure. The primary shielding material used is heavy density concrete, with masonite and boral used liberally to themalize and capture the neutrons being
scattered out of the beam. Both steel and lead plugs are used in the acess ports of the facility. A 1/2 inch thick boral - 1/2 inch thick lead shutter may be inserted into the neutron beam, when it is desired to reduce the thermal neutron flux seen by the sample or when the
samples are being changed. The lower shielding block fits into the port box by use of a steel cylinder, 12 inches od, 6 inches id, x 13 inches long which is boral and cadmium tipped to reduce neutron leakage between the reactor shield and the facility shield.
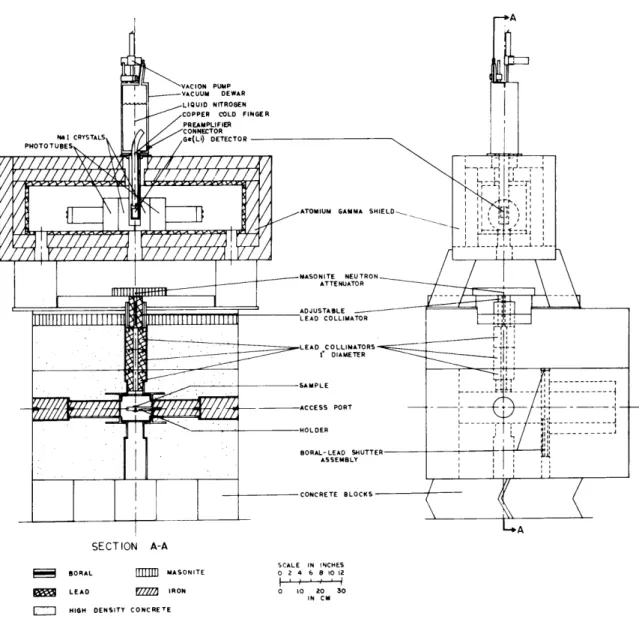
Figure 2.3 shows a front view drawing of the external sample facility, indicating %the gamma ray flight path. The external sample facility is designed to be able to take a
5"
diameter neutron beam from the port, but collimation reduces the actual beam size to3
1/2" diameter. The28
4THI PORT BOX Al SEAL
Cd COVER
.ER-- . -- - : L LEAD - BORAL SHUTTER
SAMPLE
ACCESS PLUG
Al SAMPLE HOLDER
BORAL SHUTTER
FLUX MONITOR FOIL TUBE ,,- OFF CENTER PORT
FUEL SAMPLE -GAMMA BEAM HOLDER-SCALE IN INCHES 0 2 4 6 8 1012 BORAL MASONITE
LEAD - HIGH DENSITY CONCRETE
IRON STEEL
.Figure 2.2 Top View of tTHl Irradiation Facility. MITR SHIELDING 0 _-* - - 7 -~ -- - -S a 4!
SECTION A-A
SCALE IN INCHES
BORAL MASONITE o 2 4 6 8 10 12
LEAD IRON 0 10 20 30
IN CM HIGH DENSITY CONCRETE
Figure 2.3 Front View of
4TH1
Irradiation FacilityUsed as a Ge(Li) Gamma Spectrometer. 29
30
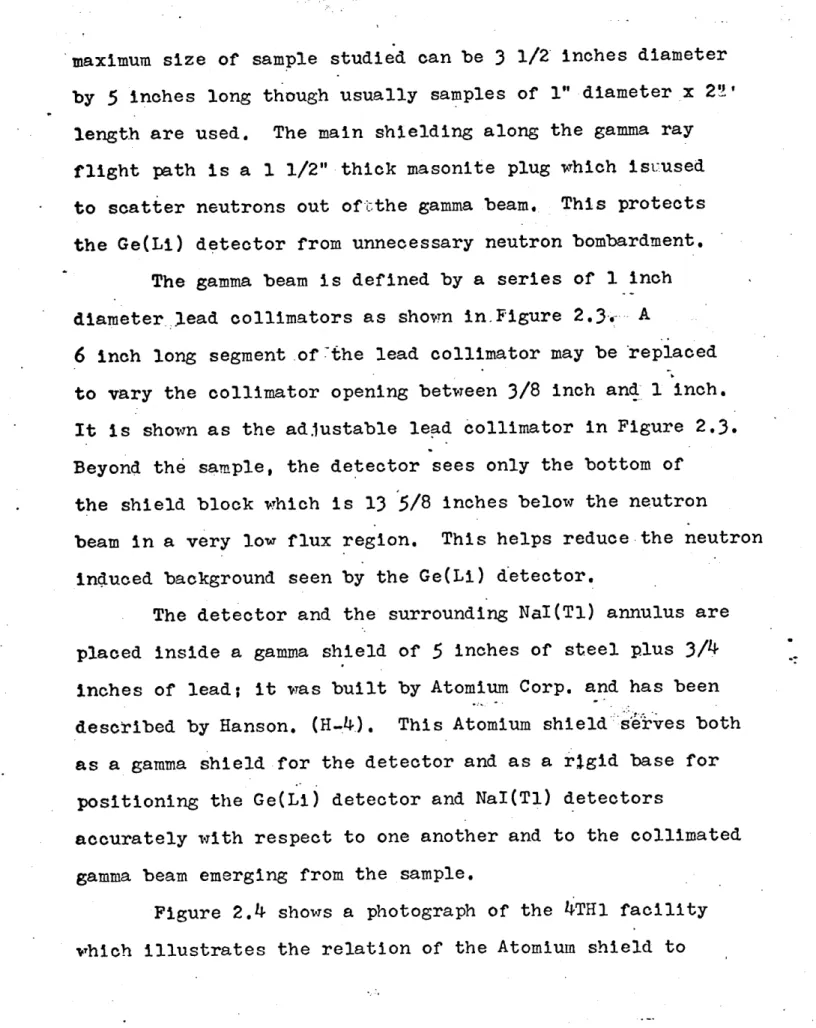
maximum size of sample studied can be
3
1/2 inches diameter by5
inches long though usually samples of 1" diameter x 2.length are used. The main shielding along the gamma ray flight path is a 1 1/2" thick masonite plug which isuused to scatter neutrons out oftthe gamma beam. This protects the Ge(Li) detector from unnecessary neutron bombardment.
The gamma beam is defined by a series of 1 inch diameter lead collimators as shown in Figure 2.3- A
6
inch long segment .of the lead collimator may be replaced to vary the collimator opening between 3/8 inch and 1 inch.It is shown as the ad justable lead collimator in Figure 2.3. Beyond the sample, the detector sees only the bottom of
the shield block which is 13
5/8
inches below the neutronbeam in a very low flux region. This helps reduce the neutron induced background seen by the Ge(Li) detector.
The detector and the surrounding NaI(Tl) annulus are placed inside a gamma shield of 5 inches of steel plus 3/4 inches of lead; it was built by Atomium Corp. and has been described by Hanson. (H.4). This Atomium shield serves both as a gamma shield for the detector and as a r.Igid base for
positioning the Ge(Li) detector and NaI(Tl) detectors
accurately with respect to one another and to the collimated
gamma beam emerging from the sample.
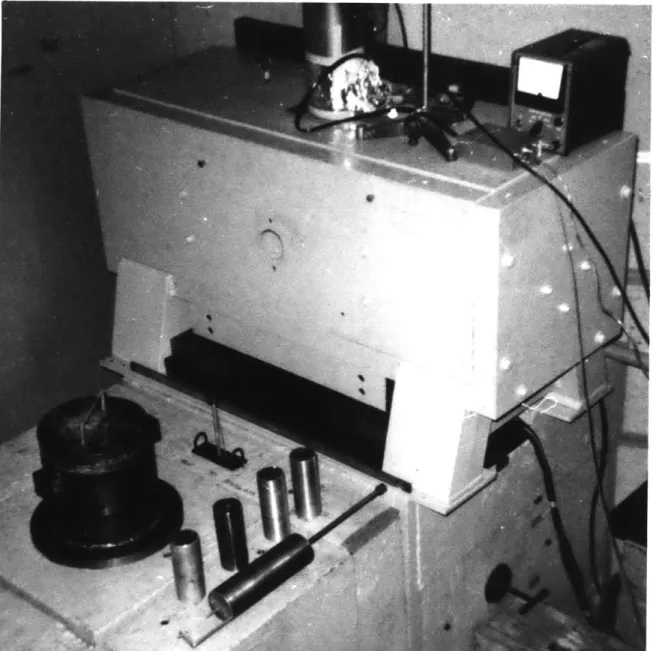
Figure 2.4 shows a photograph of the 4TH1 facility
which illustrates the relation of the Atomium shield to
I-31
Figure 2.4 Photograph of 4'H1 Irradiation Facility with Shielding Blocks in Place
32
the shield blocks. Also shown on top of the fuel rod facility shield blocks are the sample holder and plug, and various lead collimators. The Ge(Li) detector's vacuum dewar and preamplifier are shown on top of the Atomium gamma shield.
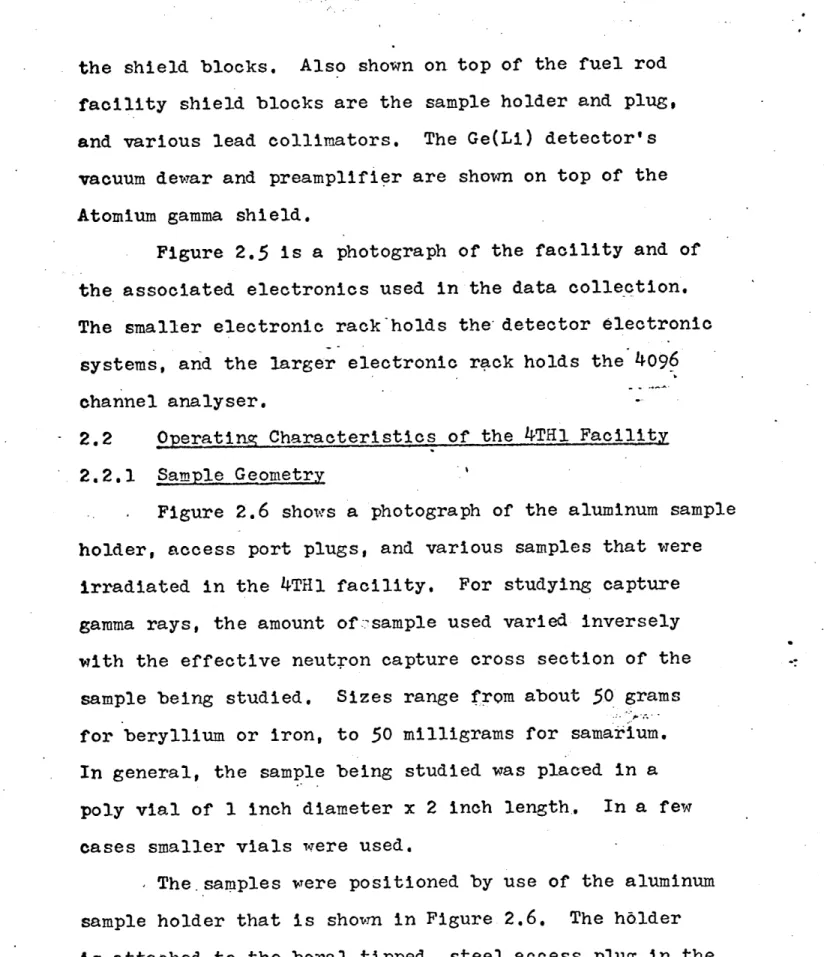
Figure 2.5 is a photograph of the facility and of the associated electronics used in the data collection. The smaller electronic rack holds the detector electronic
systems, and the larger electronic rack holds the 4096 channel analyser.
2.2 Operating Characteristics of the 4TH1 Facility 2.2.1 Sample Geometry
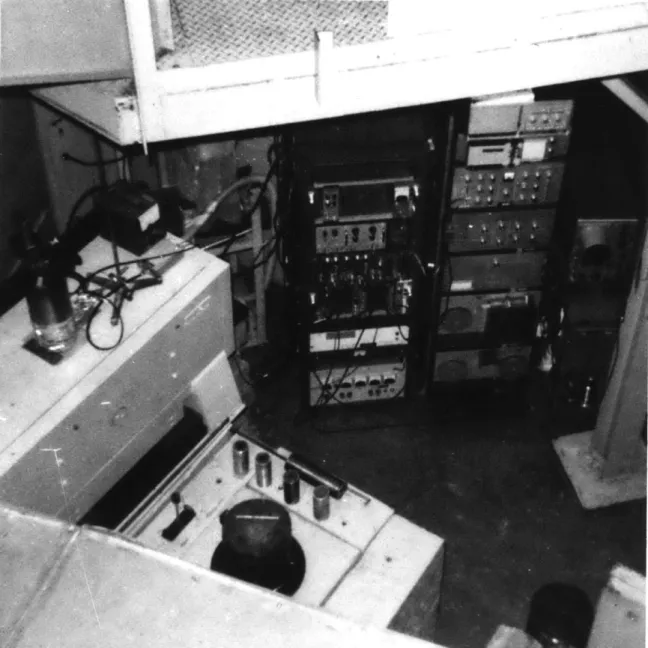
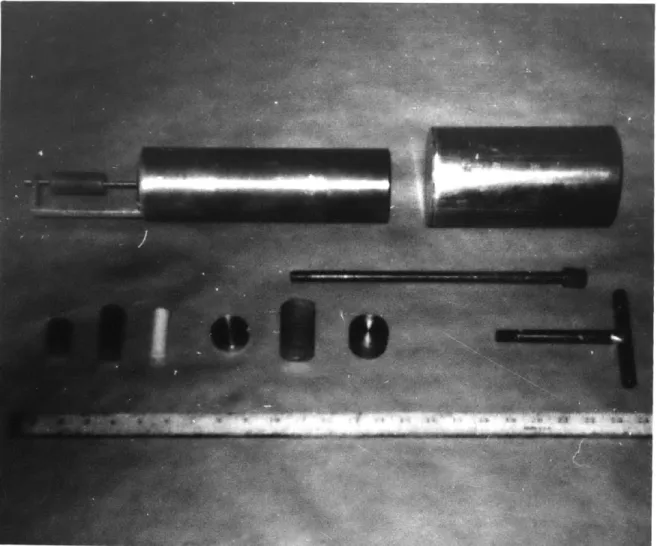
Figure 2.6 shows a photograph of the aluminum sample holder, access port plugs, and various samples that were irradiated in the 4TH1 facility. For studying capture gamma rays, the amount of -sample used varied inversely with the effective neutron capture cross section of the sample being studied, Sizes range from about 50 grams for beryllium or iron, to 50 milligrams for samarium. In general, the sample being studied was placed in a poly vial of 1 inch diameter x 2 inch length. In a few
cases smaller vials were used.
The.samples were positioned by use of the aluminum sample holder that is shown in Figure 2.6. The holder is attached to the boral tipped, steel access plug in the
33
Figure 2.5 Photograph of 4TH1 Irradiation Facility with
34
Figure 2.6 Photograph of Al Sample Holder, Access Port Plugs
4 TH1. shield block. Accurate positioning of the steel
plug then insures that the holder and sample are positioned in a -reproducible geometry. The holder is designed to pos-ition the sample in the middle of the neutron beam, while minimizing the amount of holder that is seen by the Ge(Li) detector.
Samples used were more than 99.9% chemically pure. The milligram sample amounts were mixed with pure graphite
so as to reduce the- flux depression effect in the sample, and to spread the source gammas over the volume of- the vial being used. This was necessary so that efficiency and geometry factors determined for the large vial could be used.
2.2.2 Flux Optimization and Determination
- From Figure 2.1 of section 2.1, it is seen that there are two components placed in the 4TH1 tangential
port that will influence the thermal neutron flux reaching the external irradiation facility. These are:
-(1) the position of the graphite scattering plug in the 4TH1 tube, and
(2) the thickness of the aluminum clad, lead gamma
attenuator plug whigh is positioned in the steel collimator. The thickness of this lead plug was 2
3/4
inches for the data of this work.The size of the graphite scattering plug was fixed at
3
7/8 inches in diAmeter x 39 3/4 inches long. Thepos-36
ition of the graphite plug was determined experimentally by measuring the neutron flux in- the external sample
pos-ition of the 4 TH1 facility with a bare BF counter.
Meas-3
urements were made at low reactor power for various
positions of the graphite plug. Table 2.1 shows the results. It is seen from Table 2.1 that the positioning of the graphite scattering plug is not very sensitive in affecting the thermal flux seen in the 4TH1 facility over
the range of *6 inches. from position 3. Position3 indicates the position of the graphite plug for the data used in this work.
The neutron flux in the 4TH1 facility at full reactor power was determined by gold foil activation. Two sets of foils were used. One set was activated in a "known" flux, while the other set was activated in the 4TH1 facility, after being pladed on the aluminum sample holder and
posi-tioned in the neutron beam. Both beta and gamma. activation measurements were used. The gamma ray counting method was
preferred because no large correction was required for the foil thickness. In .the beta method this correction was substantial. The "known" flux used was that of the 9CH2
8 -2 -1
spectrometer with a value of 2.8 x 10 nom sec with the lead shutter closed. (see Orphan (0-1)). This measurement gave an average value of the flux in the 4TH1 facility of
1.83 x 10 n/cm sec, accurate to *10% which is adequate for the capture gamma experiment. Even with this flux
37
Table' 2. 1
Effect of Graohite Scattering Plug Position Upon the Thermal Neutron Flux in the jI.TUl Irradiation Facility.
(c) Position of Graphite Plug No Relative to REF(d) (inches) 1. t 12 1/2 2.* +.6-1/2
3.
REF4.
-5
1/25.
-13 3/8
6. -16 7/8
Background Relative to Core Tangent (a) Point(inches)+ 23 7/8
+17 7/8
+11 3/8
+ 5 7/8
-2-5
1/2 Counting (b) Rate in EF Counter (Counts/lOsec)51609
53969
54356
54565
24838842763
3203(a) Measured from mid-point of graphite plug to tangential point of the MI TR core and
4Tl
port.+ means -toward
4TH3
-- means toward4
T{l
(b) In counting rate per 10 seconds for bare BF counter located in the external sample
position of the ~4Tl1l irradiation facility. MITR power at 250 watts.
(c) Graphite plug of dimensions 3 7/8 inches
diameter by 39 1/4 inches long.
(d) REF position defined by edge of graphite plug being 52 inches from step in 4THi beam
38
the Ge(hil detection system was usually counting rate limited in order to obtain optimum gamma energy resolution. As
a consequence, the gamma beam emitted from the capture
gamma sample was reduced by using various sized lead colli-mators. placed in the gamma beam. (see Figure 2.3). The sample was then counted for longer times at this lower counting rate. Section 2.4.2 describes the counting rates observed.
The cadmium ratio was measured in the 4TH1 facility and found to be 79. This compares to 580 for the 9012
facility, and indicates that a harder neutron spectra is observed in the 4TH1 facility as compared to the neutrons being emitted from the thermal column to the 9CH2 port.
The shape of the neutron energy spectrum affects the cross section value 1sed for the .neutron-gamma reaction for capture gamma ray work. In general, Westcott correction values to the neutron capture cross section values- (2200m/sec) were used to obtain an effective average capture cross
section for the sample being studied. (W-1). The procedure used is the same as 'that used by Greenwood in his work with
capture gamma rays. (G-3). Thus:
0-(2200 m/sec) ( g + r s) (2.1)
capt capt
where g and s are tabulated by Westcott for the element being studied. 0capt is the effective capture cross . ..................
39
section, CF(2200m/sec)capt is the capture cross section for 2200 m/sec neutrons, and r is the epithermal index factor indicating the non-Maxwellian shape of the neutron spectrum at the sample. For the 4TH1 facility, r was cal-oulated to be 0.017,
2.3 Ge(Li) Gamma Spectrometer
Generally the same technique as described by Orphan (0-1) were used in fitting a Ge(Li) gamma-spec-trometer to the 4TH1 irradiation facility. This was done
in order to have a system that would closely resemble the 9CH2 Ge(Li) gamma spectrometer which was used to ob-tain capture data for 74 elements listed in MITNE-85.
For this reason the spectral analysis methods developed in Chapter
3
are also applicable to that data. The same Ge(Li) detector, 45, was used for the gamma detectbr in the 4TH1facility and was surrounded with the same NaI(Tl) annulus detectors to enable operation in Compton suppression and pair spectrometer modes.
A number of changes and improvements over tie system described by Orphan -have been made. Thtse include the
incorporation of a new preamplifier and amplifier system to the GetLi) detector. The detector and electronics were optimized to obtain as high and stable a gamma energy
resolution as possible. This involved thermal cycliig of the Ge(Li) detector, re-performing a cold clean up'
--O
drift on the detector, and the changing of some of the time constants used in the detector pulse shaping before using the analyser to analyse the pulse amplitude.
2.3.1 Free Mode Operation
There are three possible methods of operation of the spectrometer in the detection of gamma rays: direct or free mode, Compton suppression, and pair spectrometer. The. free mode method of -operation, which was not-used ex-tensively for the results in this thesis, consists of
using the detector and its associated electronics tod'rive theatanalyser. No gating of the 4nalyser is done, and no coincidence or timing of the detected pulses is carried out.
Figure 2.7 shows the schematic diagram of the free mode operation of the Ge(Li) detector, The tree mode method of operation isasimple to. carry out, and
requires less electronic equipment than the other two modes of operation. However, it gives high backgrounds because of Compton scattering events taking place in the detector with less than full energy of the gamma ray being deposited in the active region,-of the detector. Also at gamma ener-giestabove 1.022 MeV, the pair production threshold, there can appear three distinct peaks for each gamma ray energy. The full energy peak, single escape peak, and double escape peak are the result of 0, 1, or 2 annihilation quanta es-caping the active region of the detector. These peaks which
41
Coaxial Ge(Li) Detector
6"x3" NaI and P.M. No
45
6"x3" NaI and P.M.Ch A Ch B a) (a)|reamplif -Bias Suop
-750
(a) Not used in free mode operation Prep ly v Charge Sensitive FET Preamplifier 01-1408C r LO Cross Over Pickoff and Variable Delay Ortec
407
ye s Coinciderice Unit Hamner NL-16--Scaler RIDL 49-28Channel Dashed Region
a.lyzer used for
clear counting rate
Data measurements
Figure 2.7 Block Diagram of Electronics for Operation in the Free or Direct Mode.
42
have different efficiencies considerably complicate the analysis of high energy spectra.
2.3.2 Compton Suppression Operation
To solve some of the problems presented by free mode operation, two other modes are used. The Compton
suppression mode is used in the low energy gamma ray region of 200 keV up to 3.5 MeV. Its primary purpose is to reduce the amount._of continuum background -seen in the spectra. This is accomplished by an anti-coincidence mantle using pulses produced by the NaI(Tl) annulus
surrounding the Ge(Li) detector to gate the analyser off. Figure 2.8 shows the block diagram of the Compton suppression .system with the electronic components used. There are two'NaI(Tl) detectors that surround the Ge(Li) detector and which are out of the direct gamma beam. If a gamma ray is Compton scattered in the Ge(Li) detector
the scattered gamma ray escapes. Then less than the full gamma ray energy has been deposited in~ the Ge(Li) detector. If the scattered gamma-rnray is detected by one of -the NaI(Tl) detectors the analyser can then be gated off by
coinci-dence between the Ge(.Li) detector and the.NaI(T1) detector, so as to prevent the Ge(Li) detector pulse from being
analysed in the multi-channel analyser.
Figure 2.8 shows the Ge(Li) detector output being amplified by the CI-1408C preamplifier , CI-1417 amplifier,
43
Coaxial ce(Li) Detector
6"x3" NaI and P.M. No
45
6"x3" NaI and P.M.Ch A Ch B
rio yes Coincidence
Unit 24= 130ns -Hamner NL-16
Figure 2.8 Block Diagram of Electronics for Operation in the Compton Suppression Mode.
and then being fed into the ND-161F 4096 Channel analyser. The analyser is controlled by a gating pulse which arrives from the Hamner NL-16 coincidence unit and from the Ortec-416 Gate and Delay generator. Since the analyser has an internal delay of 2 microseconds, the gating pulse must start within this time period if the Ge(Li) pulse is to be analysed. The NL-16 coincidence unit is fed by the Ge(Li) detector
pulse in the "yes" mode, and by an analyser pulse from either of the NaI(Tl) detectors in the "no" mode of the NL-.16. Thus for the NL.16 to trigger the analyser on, the Ge(Li) detector must have recorded an event, while &t the
same time neither of the NaI(Tl) detectors has recorded an event.
The DDL Ortec 410 Amplifier and Ortec 407 cross-over pickoff and variable delay generator adjust the timing of the Ge(Li) detectors pulse to coincide with the NaI(T1) detector pulses. These latter pulses are
amplified with the DDL Hamner NA-12 Amplifiers and. analyzed with Hamner NC-14 single channel pulse height analysers
(operated in integral mode for the Compton suppression mode)
4
a cross-over pickoff, and variable delay generator were incorporated in these pulse height analyzers).For long runs the Nuclear Data 502 spectrum stabil-izer is used to stabilize upon ahhigh energy gamma peak in the spectrum in order to compensate for gain shifts during
the run. A RIDL 49-28 scaler monitors the gating pulse - counting rate which is driving the analyser.
In general the effect of the Compton suppression mode is to reduce the continuous background in the spectrum
to about 1/2 the value it would be in a straight free mode run without significantly reducing the efficiency of .the full energy peak.
2.3.3 Pair Spectrometer Operation
The third mode of operation uses the Ge(Li)*detector as a pair spectrometer. This type of operation was used
extensively to study the capture..gamma rays with energies between 1.5 MeV and 10.0 MeV. There is an energy region
of overlap between the Compton suppression mode and the pair spectrometer mode in which the results of the two
methods can be compared.
The principle of operation of the pair spectrometer
mode is to record only the double escape peaks of the gamma rays which have undergone pair p:poduction. The way
this is done is shown schematically in Figure 2.9'- Section
AA shows the incoming gamma ray ndergoing a pair production event in the active region of the Ge(Li) detector and creating an electron-positron pair. The event is analysed if both
the electron and positron are stopped within the active
region of the detector without losing energy by brems-strahlung radiation which escapes the detector, and if the
2 " Diameter
Goe(Li) Deteotor.. 6 "
Dia
0' Copper / -Detector 'A Mount \ Ele tricalI Contact
Section A-A Sectioned End View
Figure 2.9 Schematic Showing the Orientation of the Ge(Li) Detector be tween the two NaI Crystals.
)
quanta produced by. the annihilation of the positron both escape the. Ge(Li) detector and are then detected by the NaI(T1) detectors. The requirement ofahaving three simult-aneous events leads to designating the pair spectrometer
as
mode triple coincidence operation.
Figure 2.10 shows the block diagram for the electronics used in the pair spectrometer mode. To accomplish
oper-ation as a pair spectrometer each NaI(Tl) detector is set to record only annihilation gamma rays of 511 keV energy. If a coincidence is observed between a detected Ge(Li)
pulse and each of the NaI(T1) detected annihilation pulses, there is a high probability that the event registered in the Ge(Li) detector is a desired pair produced event which has deposited an energy in the Ge(Li) detector of
1.922 MeV less than the full energy of the gamma ray causing the event.
The basic electonic components used in the pair spectrometer operation are the same as those used.fortthe Compton suppression mode. The main difference is that the two NaI(Tl) detectors are now set to record only
annihilation quanta by having the two single channel analy-sers in the differential mode set to cover the annihilation quanta events. Each single channel pulse height.analyser output is then fed to the Hamner NL-16 coincidence unit, now operated in-the triple coincidence mode. The timing
48
Coaxial Ge(Li) Detector.. 6"x3" NaI and P.M. No45
Ch A 6"x3"t NaI and P.M.. Ch B Coincidence Unit 2.. - 77 nsec Hamner NL-16-Figure 2.10 Block Diagram of Electronics for Operation as a Pair Spectrometer.
19
of the pulses remain the same as set in the Compton suppression mbde.
The advantage of tthe pair spectrometer mode of operation is that only one peak is observed for an in-' coming gamma ray, and that the background continuum is quite lov and flat over the entire energy range being
studied. A disadvantage is that there is a decrease in efficiency.
.2., Operating Characteristics of Camma Spectronete± 2.4.1 Ge(Li) Detector and System Energy Resolution
The main gamma ray detector used in this work was Ge(Li) detector No. 45, which has been described by
Orphan. (0-1). The shape of the detector is trapazoidal with dimensions of 27 mm x 36 mm x 40 mm. It was produced
by using the one-ended coax.al drift method, and has an
outer dead layer of 2 mm thickness, and an inner p-type dead region of 9.5 mm x-17.5 mm. These give an active volume of 21.7 cc. The relatively large dead regions, and non-uniform shape of the detector at the gamma ray
impinging end of the detector are definite disadvantages to the overall efficiency of.-the system. However,
detector No. 45 was used because: (1) it was the detector used to obtain the!capture gamma data that was analysed
in NITNE-85, and (2) it provided a better high energy resolution and a higher efficiency at gamma energies
-I
greater than 4 MeV than was obtainable with other detectors avAilable.
The detector was operated at liquid nitrogen temp-erature with a reverse bias of -600V to -750V.aThetexact bias voltage was determined by optimizing the resolution. The resolution obtained varied from a-full width at half maximum, FWHM, of 4.5 keV for gamma energies less than 1.5 MeV, to 8.0 keV for- gamma energies around 8'1eV.
The resolution is dependent upon many factors, The most important of which are:
1. Electronic noise in tfie detector, preamplifier= and amplifier.
2. Stray or ground loop pick-up in the electronic components.
3.
Statistical fluctuations in the number of electron-hole pairs produced in the detector.4. Electronic instabilities (i.e., gain and/or zero shifts) during the data collection.
5.
Counting rate limitations on the Ge(Li)-electronic system which result in a loss of resolution athigh counting rates.
The first factor was treated by optimizing the op-erating bias of the detector so as to obtain as high a resolution as possible while still keeping the leakage current low acrbss the detector. A high operating bias
N,
...
--also cleaned-up the shape of the gamma peaks observed in the gamma spectra. The capacitive loading of the preampli-. fier. by this Ge(Li) detector (No 45) was
77
pf.Factor two was accounted for by checking for
ex-ternal ground loop problems and stray pick-up problems for each data run. Usually it was:-sufficient to have a solid ground between the detector .and the preamplifier, -and to have adequate shilding on the signal connection
betvayeen the detector. vacuum dewar and the preamplifiei?
head.
Factor Three is inherent in the operation of the detector. Factor Four was treated by using a spectrum
stabilizer (ND-502) in the analyser circuit to correct for these instabilities. Factor Five was treated by
operating the system at low counting rates, as described in the next section.
2.4.2 Countin; Rate Data
In general the Ge(Li) spectrometer is operated to give optimum energy resolution; however, it is known that
the energy resolution obtained depends upon the counting rate in the Ge(Li)-electronic system. It was found for this system that counting rates of 10,000 counts per second (cps) increased the FWHM of the gamma peaks by about 1 keV, and that this effebtnwasagreater for counting rates above
10,000 cps. For this reason the spectrometer was operated
52
Table 2.2
Counting Rate Data for Various Gamma Spectrometer Sample Runs
Run Number 11071 12171 11141 11201 11151 12161 11191 11192 11211 11212 11213 11221 11261 11262 Sample Fe Fe Fe Be Be Be Sm, Sm Gd Gd Nd Nd Nd Eu Eu Er Er Ba ckcround 11263 11271
Type Run(a) Collimator(b) Counting Rate(c) Inches Counts per .Minute PS CS FM (e) PS CS FM (e) PS CS PS. CS PS. CS FM (e) CS PS PS (d) CS (d) CS (f1 CS. PS 1/2 1/2 1/2 1 1 1/2 1/2 . - 1/2 -1/2 1/2 1/2 1/2 1/2 1/2 1/2 .1/2 1/2 1/2~ 1/2
836
75608
144027
-
-298
.--.4349972333
641
148720915
143471
882 162578276559
.155222765
1100285385
21214 - 19350 -- 150(a) PS - Pair spectrometer mode, CS - Compton suppression mode, FM - free mode. PS mode operated at 1/2 the gain
of the CS or FM modes.
(b) Diameter of lead collimator, seesection 2.4.3.
(c) Counting rate from RIDL scaler in cpm as measured by number of gating pulses driving the analyzer.
(d) 3 1/2. inch thick masonite in gamma beam rather than
1 1/2 inch thick masonite used in all other runs. (e) Free mode data taken with gain settin,;s the same as
for the Compton suppression runs for the same element.
(f) Background run taken one week before run 11263.
at counting rates below 10,000 ops. For many of the samples studied, the limiting factor in the experiment was the maxi-mum counting rate that the detector could tolerate rather than the amount of neutron .flux available in the 4TH1 fac-ility.
Table 2.2 lists the counting rates in counts per minute used for the various data runs listed in this work. The
counting rate values were determined -from the RID1 scaler as indicated in Figures 2.7, 2.8 and 2.10. Note, that the
scaler was set to count the nuinber of gating pules diiving the analyser, and that this is not the counting rate in the Ge(Li)-preamplifier-amplifier system except for the free mode cases.
The counting rate in the Ge(Li)-electronic system was kept below 6O0,000 opm or 10,000 ops for all of the
samples listed. It is seen that in absolute counting rates, the Compton suppression mode analysed roughly.1/2 of the counts (pulses) going through the Ge(Li) detector
and amplifying system. Also it is seen from Table 2.2 that all of the samples except berylliumitused- the 1/2" diameter lead collimator and were counting rate limited. The beryllium sample used .the largest lead collimator
diameter of 1" and was flux limited. This is to be expected because of the low neutron capture cross section of beryllium. 2.4.3 Geometry Effects
The counting rate in the Ge(Li) detector can be